
Abstract
For researching travel choice behavior about different kinds of passenger-alone urban public transportation corridor, a dynamic multiple-passenger flow analysis model was proposed based on dynamic equilibrium assignment theory. Some factors which might influence passenger travel disutility were considered in the model, and they were closely related to the characteristic of passenger. And then a heuristic solution algorithm is developed to solve this model. Relying on MATLAB simulation, the model could reflect the time–space distribution of multiple-passenger flow along this corridor and gave a theoretically quantitative relationship among the passenger characteristics and departure time or path/mode choice. And some useful conclusions about travel choice behavior of different passengers were obtained finally. Compared with the actual data, the deviation of the simulation results is less than 20%, which shows the efficiency of the dynamic multiple-passenger flow analysis model clearly.
Keywords
Introduction
With the economic growth and population expansion over the last few decades, a rapid urban expansion is taking place in many Asian countries as they drastically scaled up their city size, as seen in Beijing and Shanghai, China. This urban expansion contributes to an explosive increase in the transportation volume and thus worsening traffic congestion. To address this problem, the public transport corridor has been set up to include rail transit systems and auxiliary bus systems, in hopes of the rapid dispersal and streaming of passenger flows. Increasing the efficiency of urban transport systems has become a major issue for countries under expansion. Conducting a passenger streaming analysis is necessary before conducting further improvement measures.
When assigning passengers is the key, the passenger flow analysis is used to determine the spatial and temporal distributions of passengers. Numerous studies have covered the distribution and assignment of passengers, the earliest of which was conducted by Wordrop. The scientist focused on the equilibrium principle, which included the user optimum principle and the system optimum principle. These are principles commonly used for network assigning. Beckman et al. proposed an optimization balance model based on transportation users with fixed demands. Beckman’s 1 model is considered one of the most basic models used to calculate passenger assignment. Dafermos investigated the asymmetric continuous traffic equilibrium network model with fixed demands. Based on the Wordrop principle, two generalized mathematical models were proposed: the Nonlinear Complementarity (NC) model and the Variational Inequality (VI) model. 2 Sheffi 3 proposed an integrated distribution/assignment user equilibrium model, based on fixed demand. Magnanti and Perakis 4 studied the assignment of passengers in a static, asymmetric network and then developed a unifying geometric framework for solving variational inequality problems.
The models discussed above deal with only the issue of passenger distribution for a static traffic network, that is, only the spatial distribution of passengers is considered in the network. These models do not include a time dimension and are thus unable to analyze the relationship between time and passenger flow. In practice, there is a tremendous difference between the passenger distributions during different periods of time.
Therefore, the dynamic assignment of transportation users has become a concerning issues within the transportation field. The current mathematical programming models of the dynamic flow assignment are rooted in the dynamic traffic assignment (DTA) model proposed by Merchant and Nemhauser 5 (M-N model), which serves as an important basis for the dynamic assignment theory. Ho 6 presented a sufficient condition for developing an optimum solution for the M-N model. This model indicated that a global optimum is contained within a set of optimal solutions, for a specific linear program within the piecewise linear adaptation. To overcome the “constraint qualification” problem inherent in the M-N model, Carey 7 extended the M-N model to a nonlinear convex programming model for time-varying flows on a general congested network. By relaxing the assumption that the exogenous flows into nodes are known for all periods, Birge and Ho 8 extended a stochastic formulation to relieve the dynamic network of extreme congestion. The resulting model used flow decisions to minimize the expectation of piecewise linear, convex costs over several periods. Using a cell transmission model through a linear program, instead of travel time functions, Athanasiosk and Ziliaskopouios 9 studied the single-destination DTA problem. This cell transmission model utilized the vast array of existing approaches on the linear programming to readily solve the DTA problem.
In contrast to the static model, the dynamic assignment model is capable of replicating the network’s temporal and spatial distributions of passenger flow. However, the available models do not take into account passenger attributes and traveling behaviors. This produces assignment errors between the calculated results and reality.
Given the corresponding weighted factors, Johansson et al. 10 investigated the influence of people’s attitudes and personality traits on their selection of transportation modes. Domarchi et al. 11 studied the effect of attitudes, habit, and affective appraisal on university staffs’ chosen modes of transportation. It was suggested that personality preferences presented a significant contribution to the model utility, which might then be used to achieve an effective reduction in car use. Choo and Mokhtrian 12 studied the role of attitude and lifestyle in influencing an individual’s choice of vehicle type. The results provided a useful background to vehicle manufacturers and decision-makers of transportation policy. It is evident that the difference in the passengers’ social and economic characteristics has a great impact on the choice of transportation. Thus, more attention should be directed to investigating their influence in detail.
Therefore, based on previous studies, this study makes further improvements by implementing the following: (1) include the time dimension and passengers’ attributes into the existing static equilibrium model to establish a user-based DTA model. This model can be used to conduct a fine analysis on the spatial and temporal distributions of passengers in the transport corridor; (2) construct a negative utility model in terms of the departure time and transport route by considering various influencing factors to be consistent with the reality; (3) specify the application condition and scope of the model and design a heuristic algorithm; and (4) implement the proposed passenger flow model to investigate its application on the efficiency optimization of the passenger flow in the transport corridor.
Classification of passengers
There are a variety of passengers in the transportation corridor who act differently. In order to study the temporal and spatial distributions and evolution laws of the urban transport corridor, the passengers should be classified into different groups, according to their attributes.
Many effects, such as the social and economic attributes, personality preferences, and trip purposes, are presented in previous studies. Based on the questionnaire results (700 surveys of rail transit and 300 surveys of buses) and quantitative statistics, the type of job, level of income, and purpose of travel are adopted in this study as the criteria for the classification of passengers. These parameters have great impact on the departure time, mode selection, and so on. First, passenger occupations determine the necessity of the demand for stable and consistent travel time. For example, a passenger with a regular job has a higher requirement for a stable travel time than those with a freelance job. Second, the passenger incomes determine the affordability of transportation fares. In general, low-income passengers are far more sensitive to the fare than high-income passengers. Third, the passenger travel purposes affect the sensitivity toward time stability, comfort, and so on. The survey results show that the commuters always care about travel time stability, while the tourist-based and shopping-based passengers place riding comfort as a priority. Based on this analysis, passengers can be classified into three groups: blue-collar workers, white-collar officers, and individual traders.
From the result of the questionnaire survey, the vast majority of passengers are commuters in the transport corridor during the peak hour, which corresponds to the statistical results of passenger volume in Shanghai. As a result, the research would focus on the time–space distribution of the commuters. And occupation would be the criterion of passenger classification. In addition, the methods of passenger classification are various, which are decided by the actual situation or research purpose. For example, if trip purpose is the research point, the passengers could be divided into commuter, student, shopper, and so on. In this case, how to classify the passenger would depend on research subject. In addition, questionnaire is useful in demonstrating the correctness of passenger classification.
Establishment of the model
Before the establishment of the traffic assignment model, it is necessary to clarify two basic concepts: the transport route and the transport route segment. The “transport route” stands for the transportation path from the starting point to the destination, consisting of a series of station points. The “transport route segment” denotes the path between any two consecutive points on the transport route, that is, the transport route is composed of a number of route segments.
Assumptions of the model
The whole time domain
Assume that the passengers will pre-determine their departure time, that is, they select the departure time before they travel. This assumption has been adopted by many other studies, for example, Lam et al. 13 and Li et al. 14
The rail transit operates according to schedule and passes the real stations. The travel time and waiting time are assumed to be constant. It is also assumed that uncertainty exists in the conventional bus system due to the influence of road traffic environment.
Selection of departure time
The multinomial Logit model has been widely used to study the travel behavior of passengers. 15 This article employs this model to study the decision-making strategy for the departure time as


where
This article focuses on the influence of the difference between the actual and expected arrival times (early or late) on the selection of passengers’ departure times. A negative utility model is proposed based on this departure time strategy

Let

where
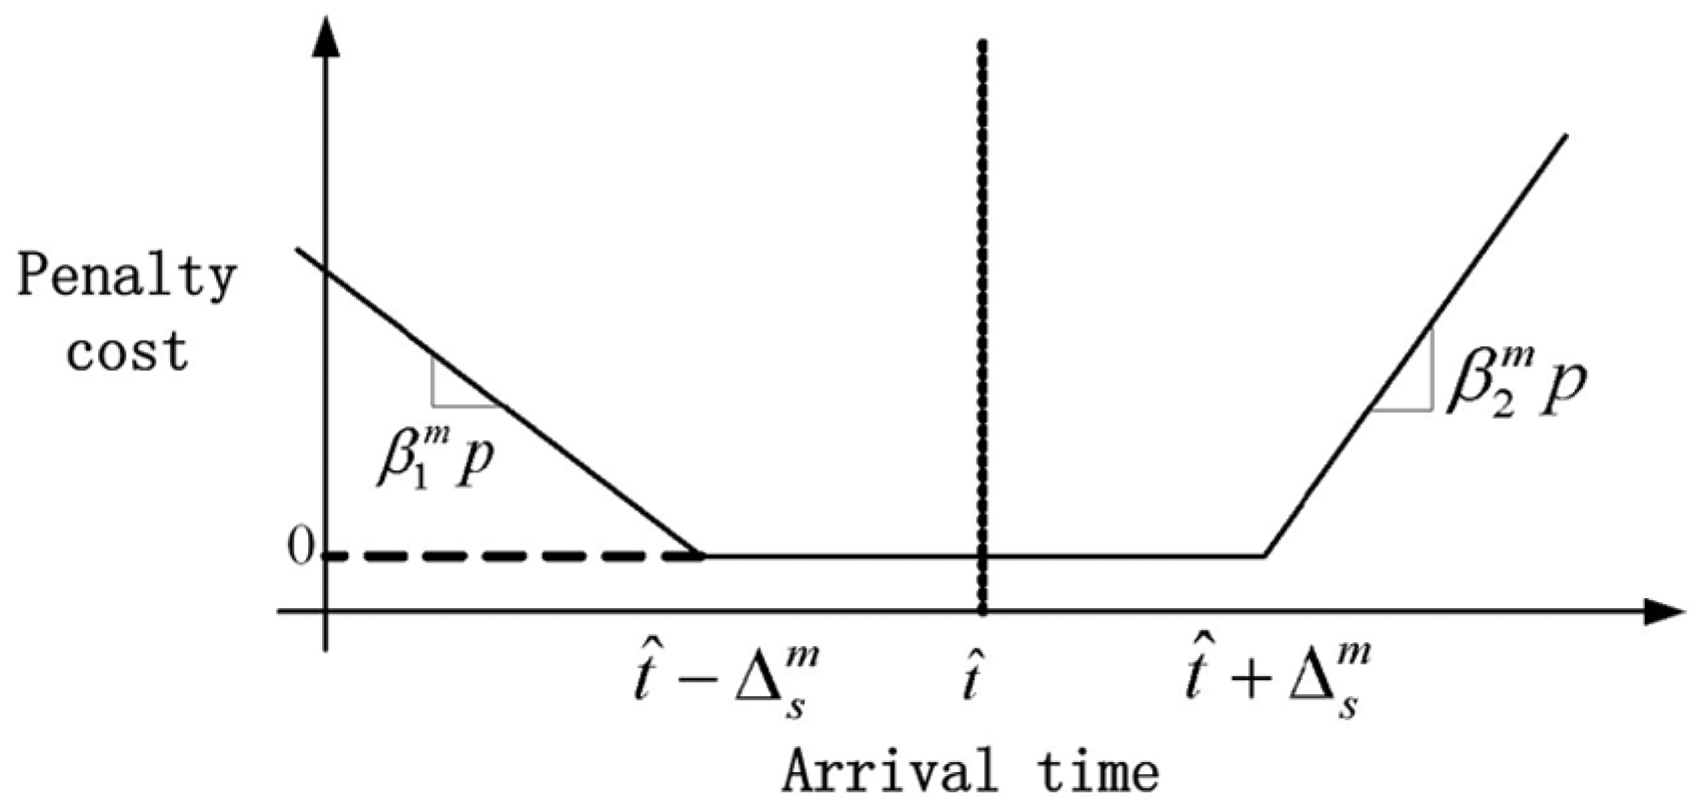
Arrival time of passengers versus penalty cost.
Selection of transport route
As for the transport route selection for various passengers, a stochastic user equilibrium traffic assignment theory is used in this article. The Probit model is employed to create the route selection model.
1. When there are two routes to select, the Probit model can be written as


2. For more than two routes, the route selection model can be extended to

and

where


where
This article investigates the influence of the travel time, waiting time, congestion, and fare on passengers’ selection of transport routes. The negative utility model based on route selections can be established as

where
1. Degree of congestion
Based on the studies by Wu et al. 16 and Lo et al., 17 the in-vehicle degree of congestion depends on the headway and passenger volume. In this case, the degree of congestion is calculated by the Bureau of Public Roads (BPR) function and is expressed in terms of time as

where
2. Travel time
The travel time


where
3. Waiting time
The average waiting time per station consists of two components: waiting time for normal vehicle arrival and delay time due to over-large passenger volume. Similar to the study by De Cea and Fernandez 18 and Lo et al., 19 the negative utility model of waiting time can be given by the BPR function as
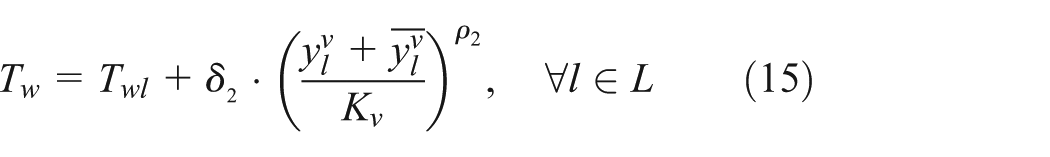

where
Solution of the model
This section presents a heuristic algorithm to solve the traffic assignment model. The whole solution process can be divided into two sub-problems: the selection of departure time and the selection of transport route. The method of successive averages (MSA) can be used to solve these two issues through the process detailed below:
Step 1. Initialization—classify all the passengers according to their attributes for all O/D pairs.
Step 2. Let
Step 3. Start to iteratively select the transport route for each types of passengers.
Step 3.1.
(1) According to the arrangement and operation of all the transport modes in the corridor, determine the effective route for all O/D pairs.
(2) For
Step 3.2. Based on the MSA algorithm, let
Step 3.3. Calculate
Step 4. If the convergence criterion
Step 5. After the selection of transport routes, calculate the negative utility for a given departure time for all O/D pairs and substitute it into equation (1) to obtain the additional passenger volume
Step 6. Calculate the modified additional passenger volume by the MSA algorithm, and let
Step 7. If the convergence criterion
Note that the selection of effective routes should adhere to the following rules: (1) confine the maximum number of transfers within 3 (no matter what style) for a single trip; (2) it is not allowed to take the same route twice for a single trip.
Case study
Taking the Shanghai public transportation corridor (including rail transit Line 2 and bus lines along the route), a case study is conducted in this section to verify the proposed traffic assignment model and the efficiency of the proposed algorithm in section “Solution of the model.”
Summary of corridor region
The rail transit Line 2 in Shanghai has an overall length of 60 km and a total of 30 stations. It connects the several transportation hubs such as airports and high-speed railway stations. Meanwhile, there are many conventional bus routes along transit Line 2. The number of collinear bus lines in the middle, west, and east parts of the lines are 7, 4, and 2, respectively.
The study chooses a time period of 7:30 a.m. to 9:00 a.m. This period is divided into six segments in an interval of 15 min. It presumes that the commuters’ working time is 8:30 a.m. The following assumptions are taken: (1) the bus lines in the middle, west, and east parts of transit Line 2 are represented by bus lines 1, 2, and 3, respectively. (The number of bus lines is indirectly accounted according to the departure frequency. However, the arrangement of bus stops is identical to the reality. Each rail station or bus stop is an O/D point.) (2) Some bus stations along rail Line 2 are close to the rail station. In this case, the rail station and bus station within 5-min walking distance are combined into one O/D point, as depicted in Figure 2.

Transport lines and stations along the corridor.
Setup of input parameters
The model parameters are taken as follows: the passenger’s expectation variables are taken as
Model parameters for the three types of passengers.

Results output and analysis
The MATLAB software is used in this study to derive the optimum solution of the proposed model. Figure 3 shows the variation in the solution error against the number of iterations. It can be seen that as the number of iteration increases, the error of results reduces. After many times of iteration, the error is confined within an acceptable level of 0.001. The results are discussed in detail below:
1. The passengers’ selection of departure time is first analyzed. Figure 4 shows the distribution of the departure time for O/D (7–11). It can be seen that (1) the vast majority of passengers will choose a certain departure time before their working time. The occurrence of the maximum passengers is defined as the departure peak hour (the longer the transportation distance, the earlier the peak hour, and in practice, the peak hour is substantially ahead of the working hour); (2) the departure time varies with types of passengers. Given the same transportation distance, the peak hour of the blue-collar workers is the earliest, followed by that of the white-collar officers. The individual traders show no obvious rush hour. This difference can be attributed to the fact that the economic level and job attributes have great influence on the selection of transportation modes and cognition value of time.

Solution error versus iteration.
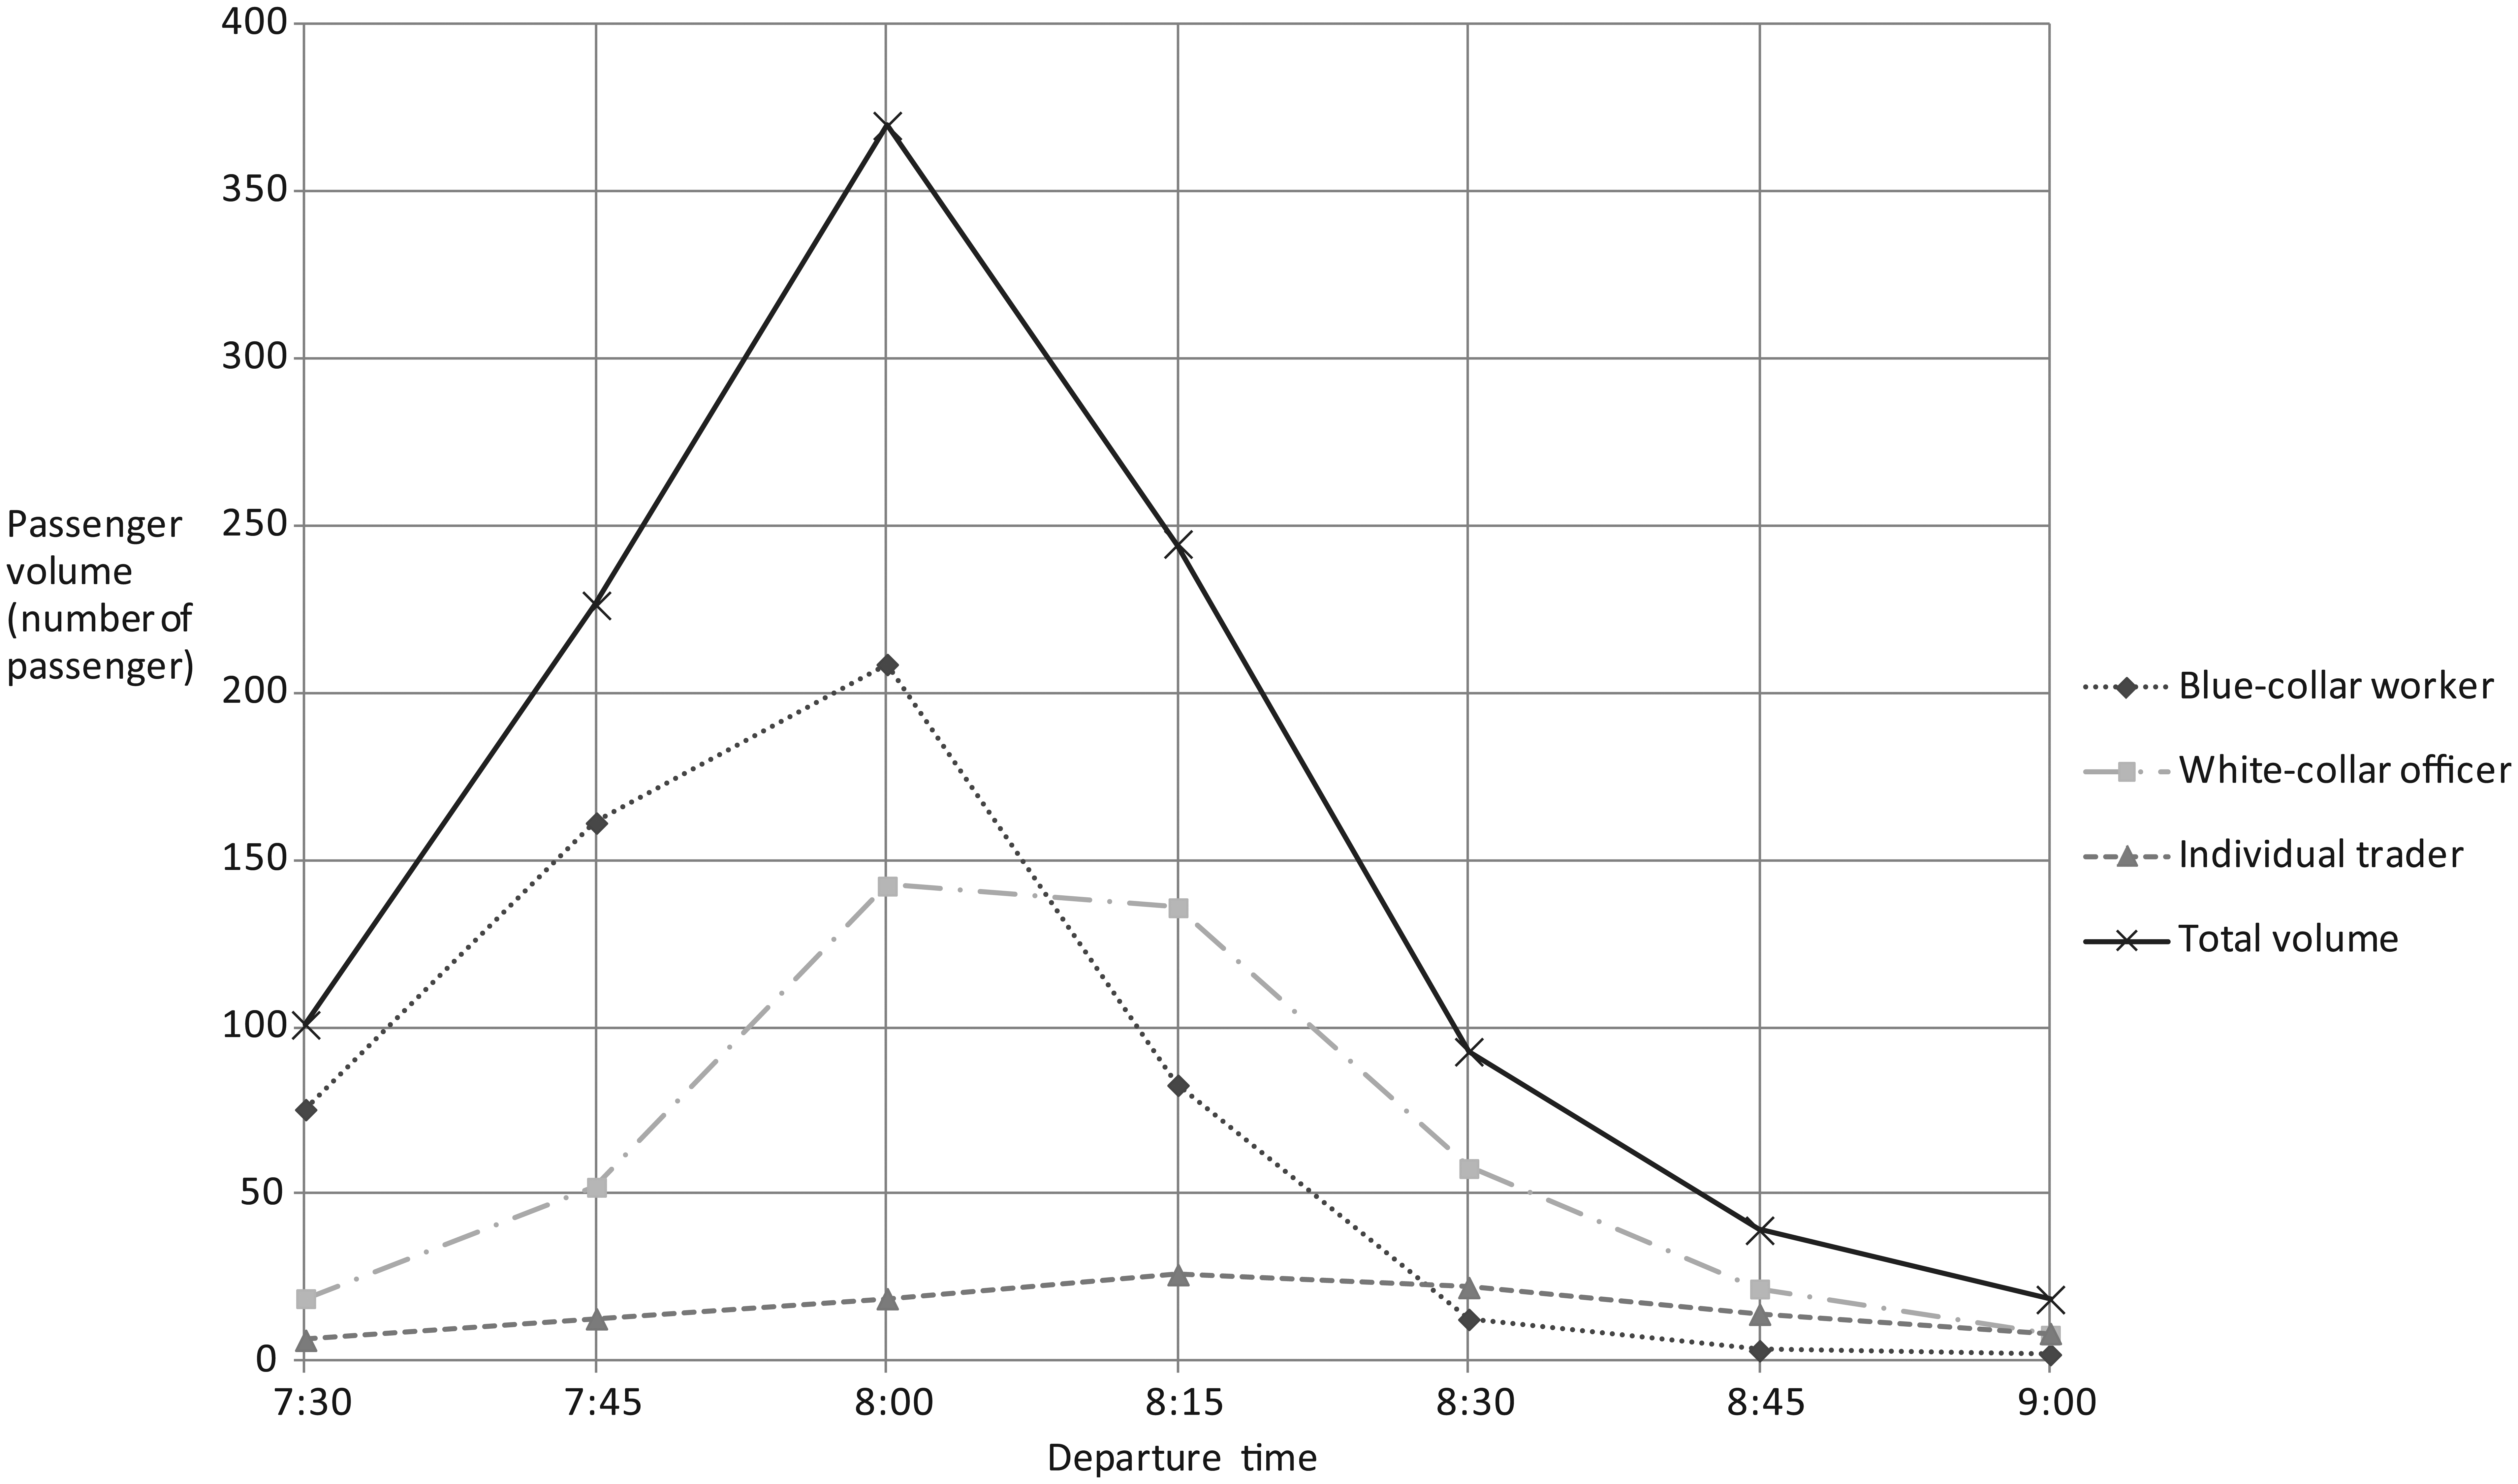
Distribution of passenger volume at different departure times based on passengers’ attributes.
From the above analysis, the passenger flow analysis model is able to accurately predict the time domain characteristics of passengers in the public transportation corridor. In contrast to static models, the dynamic model can effectively determine the peak hour. The passenger flow analysis based on passengers with multiple attributes can reflect their different selection of the departure time.
2. Second, the selection of transportation modes during the peak hour is discussed in this section. The case of O/D (7–11) is considered here. The results are shown in Table 2. It can be seen that (1) most of the passengers choose the rail transit as the unique type of transportation, while a minority of passengers select buses. The selection of transfer between two different transportation modes is negligible, and this indicates that the mode transfer has a significant effect on the selection of transportation vehicles. (2) The passenger’s selection of transports depends on the travel distance. The results show that the longer the distance, the more passengers choose the rail transit. Compared to the bus transport, the rail transit is faster and meets schedule demands. This advantage plays an important role as the distance increases. (3) The selection of transportation modes is also affected by the type of passengers. A lower percentage of blue-collar workers select the rail transit but higher percentage for bus than the white-collar officers. This is because the former has to make a balance between the travel time and fare and thus tends to select bus within a certain distance. In contrast, the latter prefers the time efficiency to the economy and takes the rail transit as the first choice. The individual traders show a balance who are not sensitive to both the two factors, and their selection is flexible.
Distribution of peak passenger volume (s: rail transit; a: bus lines).

O/D: origin–destination.
It proves that the passenger flow analysis model is able to accurately predict the passengers’ selection of transportation modes in the public transportation corridor. This indicates that the consideration of the negative utility agrees well with reality. Meanwhile, by the classification of passengers, the difference in the selection of transportation modes caused by different types of passengers can be reflected.
3. Finally, the travel behavior of passengers for O/D (9–11) during 7:30–8:15 a.m. is listed in Table 3. It can be seen that the passenger attributes have a great impact on the transportation selection. The more departure time approaching the working time, the larger percentage of blue-collar workers and while-collar officers select rail transit. The individual traders experience an opposite trend. This is because the former two groups prioritize punctuality, that is, the latter groups depart and a higher demand for stability of vehicle is needed. The latter would select a more comfortable transportation mode rather than a more stable one.
Distribution of passenger volume at different time periods (s: rail transit; a: bus lines).
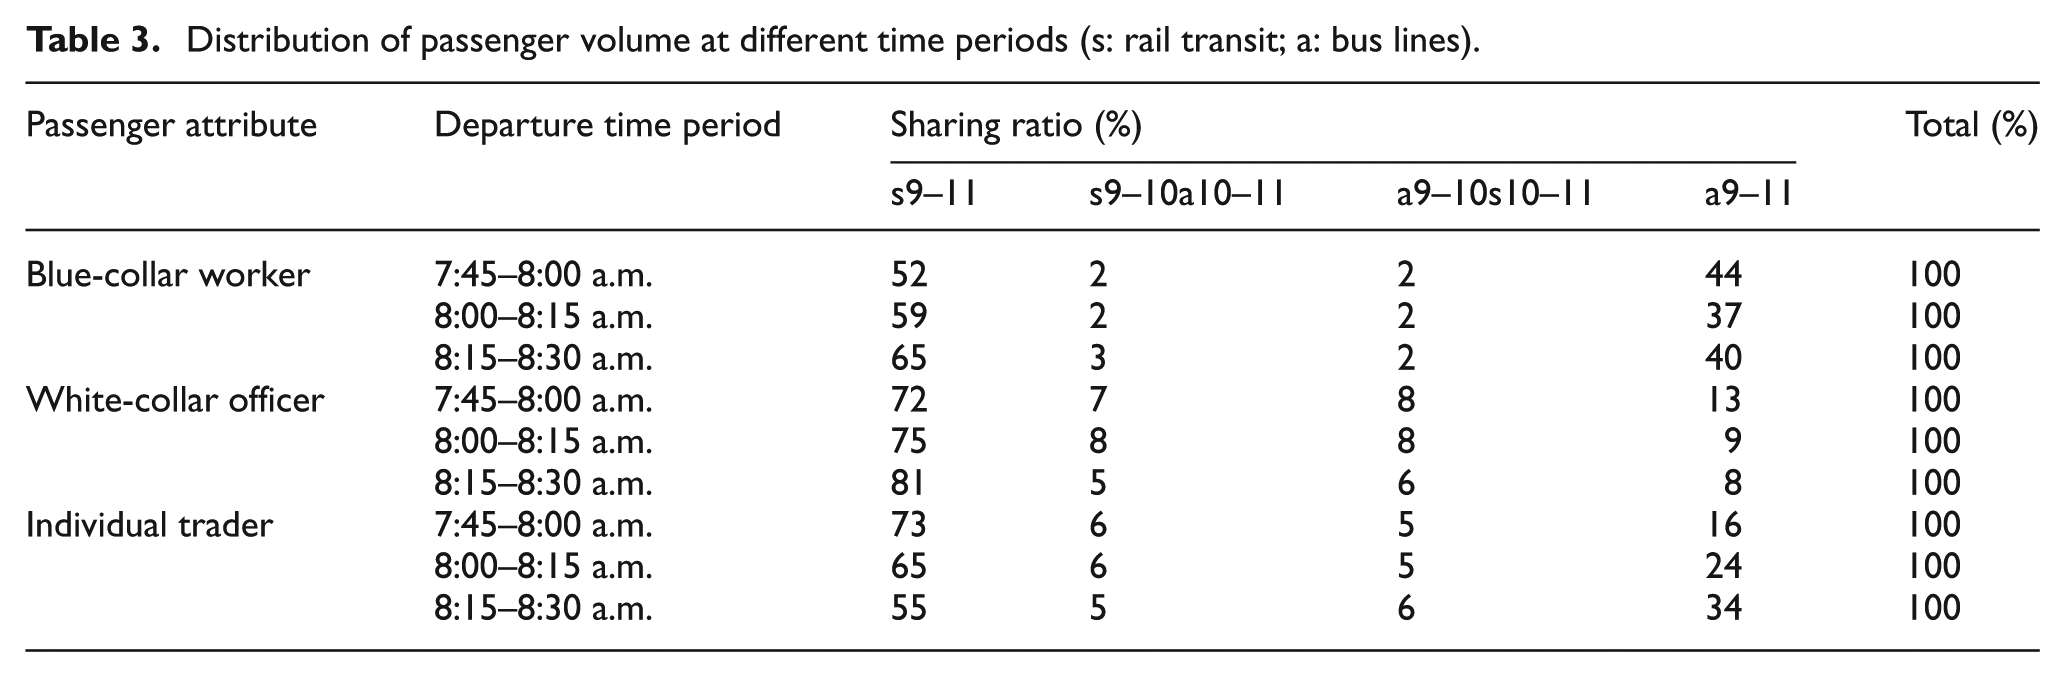
It makes sense to consider passenger attributes in the analysis of assignment of the passenger flow. Meanwhile, dynamic analysis model is capable of predicting the temporal and spatial distributions of passengers.
Improvement measures and effects
The results from the above case study demonstrate that the traffic loadings of the public transportation corridor in Shanghai are extremely large during the peak hour. The utilization of different transportation modes is highly skewed. Passenger attributes have a direct influence on their travel behavior. Therefore, management efforts should be taken to effectively alleviate the problem. First, the adjustment of the working time for different types of passengers will avoid the peak hour. Second, the adjustment of the ticket fare may, in part, affect the users’ selection of transportation vehicles.
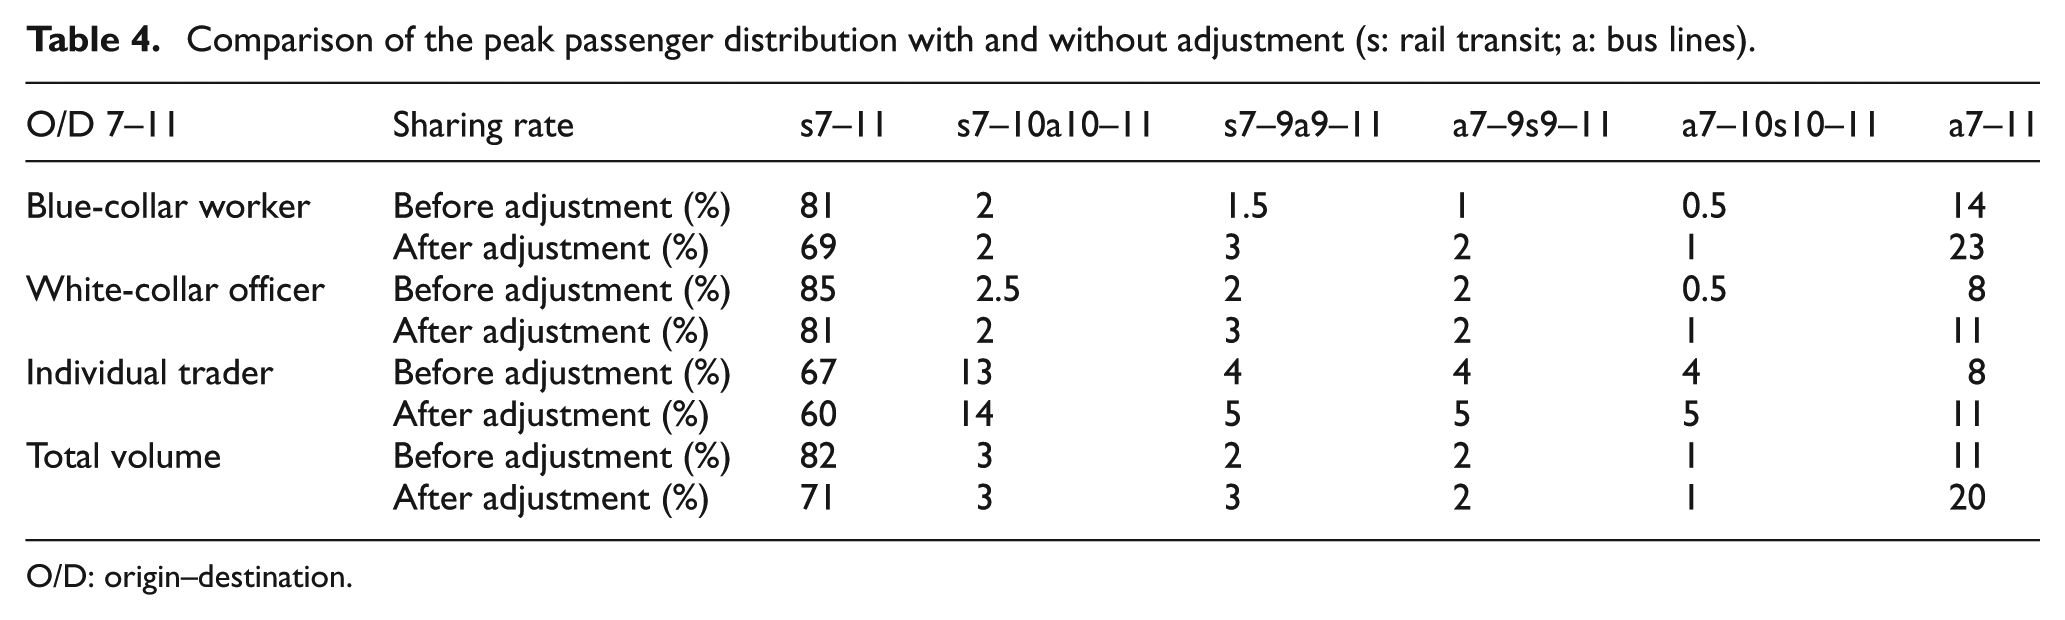
In this case, the working time of white-collar officers is delayed to 8:45 a.m., keeping the others the same. Meanwhile, the ticket fare of the rail transit increases by 10% and the fare of the bus is reduced by 10%. Taking the O/D (7–11), for example, the distribution of the passenger flow is shown in Figure 5 and Table 4. It can be seen that (1) the variation in passenger flow becomes smooth after the adjustment with a reduction in the passenger flow of 24% during the peak hour. It greatly relieves the traffic burden of the transportation corridor. (2) After the adjustment, passengers adjust and take buses, especially in regard to the blue-collar workers. It allows for a more even utilization of the rail transit system and bus system.

Comparison of distribution of the passenger flow before and after the adjustment.
Comparison of the peak passenger distribution with and without adjustment (s: rail transit; a: bus lines).
O/D: origin–destination.
Conclusion and further work
Based on the stochastic user equilibrium theory, a DTA model of urban public transportation corridor is established based on the classification of passengers. The proposed model embeds the time variable and passengers’ attributes into the static equilibrium model. The model is used to represent the selection of passengers at the departure times and on the transportation routes. The application condition and scope of the model are specified through the basic assumptions made. The solution algorithm is then proposed.
A case study is conducted to verify the application of the proposed traffic assignment model. It is evident that the dynamic model is capable of predicting the preferences of passengers in the selection of vehicles. In addition, the model can show the variety of travel behavior of various types of passengers.
Not only can the model deal with the temporal and spatial distribution of the passenger flow but it can also simulate and estimate improvement measures and their effects. This is due to the consideration of the time-varying effect and passenger classification. Therefore, the model provides an effective tool to study the function optimization and efficiency enhancement facing the urban transportation corridor.
The model proposed in this article is available for simply describing the temporal and spatial distributions of passengers. Further work is underway to make extensions. The extensions will include the effect of the negative utility or the refinement of passenger classification, not only from their occupation but also from their personality and preferences.
Footnotes
Academic Editor: Xiaobei Jiang
Declaration of conflicting interests
The author(s) declared no potential conflicts of interest with respect to the research, authorship, and/or publication of this article.
Funding
The author(s) received no financial support for the research, authorship, and/or publication of this article.