
Abstract
W-beam guardrails are the most widely used road safety barriers worldwide. They are used for protecting vehicle occupants on dangerous areas of roadways. All road safety barriers used on European highways are designed according to the European standard EN 1317. Conventionally, such road safety barriers have the following dimensions: a 750-mm height from the top of the W-beam to the ground and a 1.33-, 2-, or 4-m post spacing. This study applied the finite element code LS-DYNA for evaluating the safety performance of an AG04-2.0 A-type barrier, which was designed using three post spacings and various rail heights, when impacted by a 900-kg small passenger car. Eight crash test simulations were conducted for evaluating the crashworthiness of the AG04-2.0 barrier according to the European Standard EN 1317. A baseline model was developed and validated against the existing crash test models. The results showed that the various post spacings (1.33, 2, and 4 m) and rail heights (600, 650, 700, 750 and 800 mm) enabled the AG04-2.0 barrier to withstand the impact of the 900-kg car, satisfying the EN 1317 criteria (i.e. TB11 test). The 2000-mm post spacing and 700-mm rail height were considered the optimal dimensions for AG04-2.0 road safety barriers.
Introduction
Providing forgiving roadside environments reduces the risk of vehicles veering off safe, traveled roads. Hazards such as trees, utility poles, fixed objects, and water are typically located adjacent to roadways and relocating them is often impractical. Vehicles veering off roadways might encounter these hazard elements. These elements present varying degrees of danger to vehicles and their occupants. However, geographic and economic constraints prevent designing and implementing ideal highway environments. Measures adopted for mitigating such hazard elements depend on the probability of an accident occurring, the likely severity of the accident, and the available resources. 1 In these instances, road safety barriers are the most appropriate solutions for mitigating the mentioned hazards. Road safety barriers are typically used to safely contain and redirect errant vehicles from nearby hazards. W-beam guardrails are the most widely used safety barrier systems for protecting vehicles from hazards located adjacent to traveled roads. Such systems are used for providing protection on hazardous roadway locations. When a vehicle collides with a W-beam safety barrier system, the system forms a redirection ribbon, guiding the vehicle away from nearby hazards. This may reduce the damage incurred from the impact, increasing the safety of occupants. Road safety barrier systems used on European highways must fulfill the European standard EN 1317. 2 The European standard EN 1317 provides criteria for determining the levels of vehicle containment, appropriately redirecting errant vehicles to the road, and providing guidance for pedestrians and other road users. Safety barriers are typically designed according to EN 1317 using three main criteria: vehicle containment, impact severity, and barrier working width.
Conventionally, W-beam guardrail systems designed according to the European standard EN 1317 have the following dimensions: a 750-mm height from the ground surface to the top of the W-beam and a 1.33-, 2-, or 4-m distance between posts3–6 (Figure 1). Before such systems are installed on roads, they are analyzed and subjected to certification tests that emphasize only the mentioned dimensions.4–8 However, it is unclear how changes in these dimensions affect the safety performance of barrier systems. Tests on the safety performance of barriers having rail heights and post spacings that are not within the mentioned conventional range are scant. Nevertheless, in real-world applications, the rail height and post spacing are sometimes not within this range. The rail height may be altered by various installation or environmental deviations, such as poor installation, human error, soil erosion, frost heave, settlement, road resurfacing, and roadway overlay.9–11 Low rail heights may increase the risk of vehicle rollover or truck overriding, whereas excessively high rails may cause small vehicle underriding or penetration (truck) to hazardous areas.12,13 When W-beam guardrail systems must be installed on curved roads or when the deflection of the guardrail system may be limited by roadside hazards during impact, post spacing can be altered to dimensions falling within supplier guidelines.14,15 Thus, rail heights and post spacings in W-beam guardrails play a critical role in the manner in which errant vehicles interact with safety barriers. Therefore, understanding the effect of the heights and post spacing of barriers on safety performance is imperative. This can enable designing safe vehicle redirection systems to resolve problems regarding appropriate guardrail height variability, achieving economic advantages in roadside maintenance, and determining potential environmental deviations.10,11
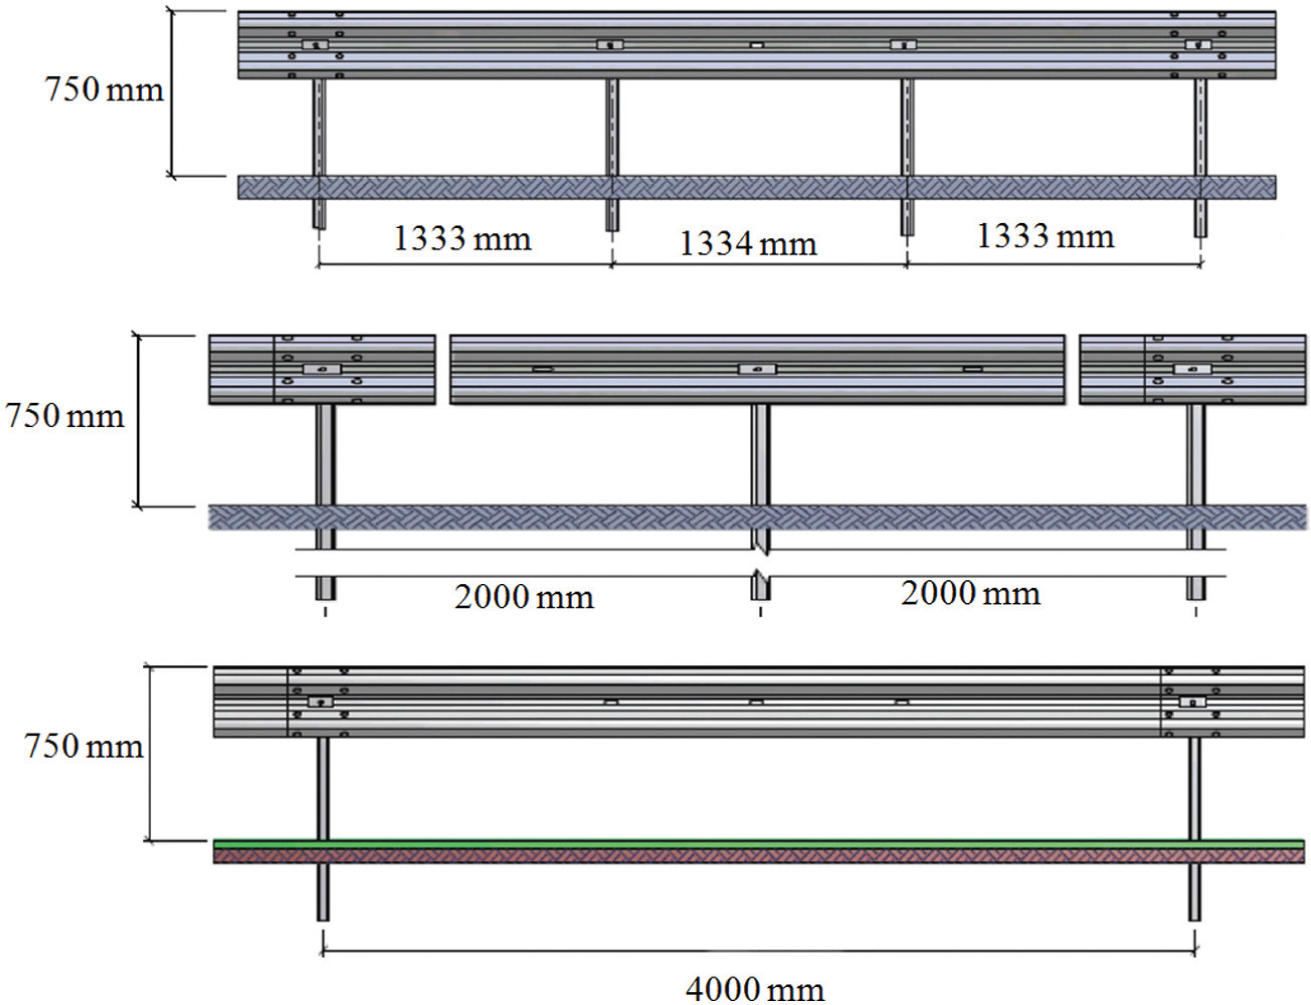
Typical W-beam guardrail on Europe highway. 3
This study applied the finite element code LS-DYNA for evaluating the safety performance of an AG04-2.0 A-type barrier,6,7 which was designed using three post spacing and various rail heights, when impacted by a 900-kg small passenger car (TB11 test). Eight crash test simulations were conducted to assess the crashworthiness of the AG04-2.0 barrier according to the European standard EN 1317. This study presents the optimal rail height and post spacing values for AG04-2.0 barriers for protecting small cars during impacts. Furthermore, this study presents crashworthiness test results for W-beam guardrails with various heights and post spacings, and these results can serve as a reference in making appropriate decisions in routine maintenance and rehabilitation efforts.
Road safety barriers and European standard EN 1317
W-beam guardrail system
W-beam guardrails are the most widely specified safety barrier systems that provide protection against hazards located adjacent to roadways. W-beam guardrails provide designers with an economical and dependable roadside solution. They are used for protecting specific road regions, such as dangerous areas. W-beam guardrails are semi-rigid, moderately flexible barriers during vehicle impact. W-beam guardrails comprise a rail element (called a W-beam) and supporting posts (Figure 2). The ability of W-beam guardrails to absorb some of the crash energy reduces the risk of injury for vehicle occupants and limits deformation of impacting vehicles. Safe vehicle containment and redirection systems are developed through a combination of the flexural resistance of the rail and the bending resistance of the supporting posts. Upon impact, the posts absorb some of the crash energy by rotating in the surrounding soil before separating from the rail as they undergo full yield. Once the rail separates from the posts, the rail forms a redirective ribbon, guiding the vehicles away from the nearby hazard. 14

W-beam guardrail. 3
European standard EN 1317
The European standard EN 13172 was approved by the European Committee for Standardization in March 1998 and was revised on 29 April 2010. This standard provides guidelines for evaluating real impact tests on roadside barriers. The standard prescribes criteria that road safety barriers must fulfill to reduce the severity of accidents related to roadside barriers.
Table 1 presents impact tests between various vehicles and barriers. On the basis of the aforementioned standards, road safety barriers must be tested under various conditions (e.g. angle impact and vehicle velocity) using different vehicles (e.g. passenger cars, buses, and trucks). Safety barriers were designed according to the European standard EN 1317 by evaluating three main criteria for various performance levels:
Containment level: this represents the level of containment of safety barriers for various types of impacting vehicles at various speeds and impact angles. Four containment levels (low, normal, high, and very high) were defined.
Impact severity: two indices were proposed for assessing the injuries of occupants during impact between a vehicle and roadside barrier: the acceleration severity index (ASI) and theoretical head impact velocity (THIV).
Vehicle impact test descriptions.

HGV: heavy goods vehicle.
To ensure safety, these indicators must not exceed the determined limits (Table 2).
Impact severity levels.
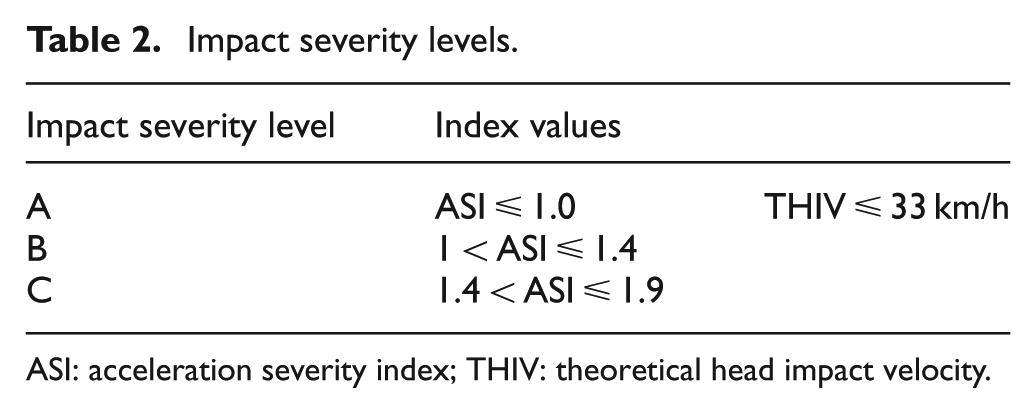
ASI: acceleration severity index; THIV: theoretical head impact velocity.
The ASI is used for characterizing the impact intensity, which is considered the most critical indicator of the impact rate on vehicle occupants. The ASI measures the severity of vehicle collision during impact (Figure 3). In general, a higher ASI index indicates a more severe collision and, thus, a higher injury risk. An impact severity level of A signifies a greater level of safety for an errant car’s occupant compared with an impact severity level of B; furthermore, an impact level of B signifies greater safety than a level C impact.
Acceleration severity index, intensity of the impact. 4
The THIV describes the theoretical speed at which an occupant’s head collides with an obstacle during an impact.
Barrier deformation is expressed according to the working width (Wm), which is the maximum lateral distance between any part of the barrier on the undeformed traffic side and the maximum dynamic position of that part of the barrier. The deformation of road safety barriers can be categorized into eight classes (W1–W8).
Finite element model of road safety barrier impact test
Finite element model of road safety barrier impact test
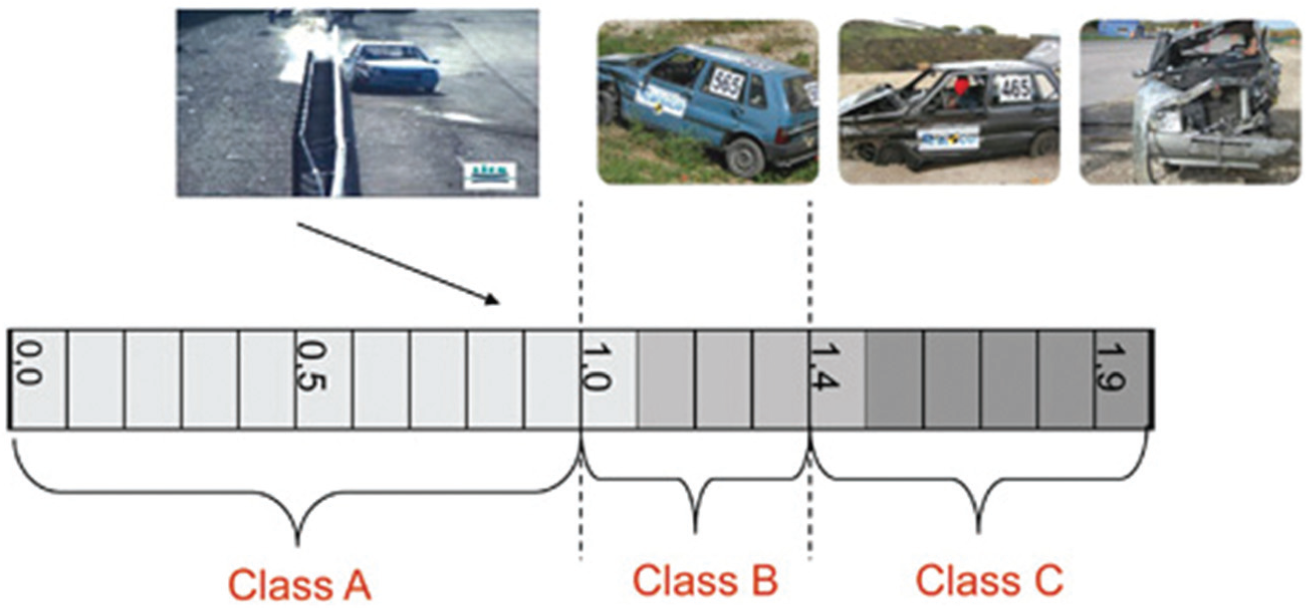
AG04-2.0 A-type barrier was used for this study, and this barrier was produced by the ALKA group 6 according to the European standard for road safety barriers. The barrier was installed on a highway at a 750-mm height and 2000-mm post spacing according to the manufacturer’s guidelines. Atahan et al. 7 conducted a full-scale crash test on an A-type AG04-2.0 barrier at the CSI proving ground facility near Bollate, Italy, on 13 December 2011. The experimental test involved an AG04-2.0 A-type barrier and an 882.5-kg Fiat Uno brand car (TB 11 test).
Road safety barrier model
Figure 4 shows the actual and simulation models of the W-beam guardrail system. The system comprised W-shaped guardrails and C-posts. The length of the W-beam guardrail segments was 4300 m. The C-post was 1600 mm in length and was embedded 950 mm in the soil. The dimensions of the post were 125 mm × 62.5 mm × 25 mm. The distance between each post was 2 m. The height of the barrier was 750 mm from the ground.
W-beam guardrail system.
All safety barrier parts were modeled using fully integrated shell elements (having an average size of 20 mm) with five integration points throughout the shell thickness for preventing a zero-energy mode (hourglass mode).16,17 The thickness of the shell parts was based on the actual thickness of the parts used in the experimental tests: 2.5-mm W-shaped guardrails and 5-mm C-posts. The bolt connection between the W-shaped segments and the posts were modeled using a spot-weld element. The keyword CONSTRAINT-SPOTWELD was used to simulate bolts that connected the barrier components. The AUTOMATIC_SINGLE_SURFACE card with a soft constraint option assigned as type 1 was used to define a contact between the barrier components.
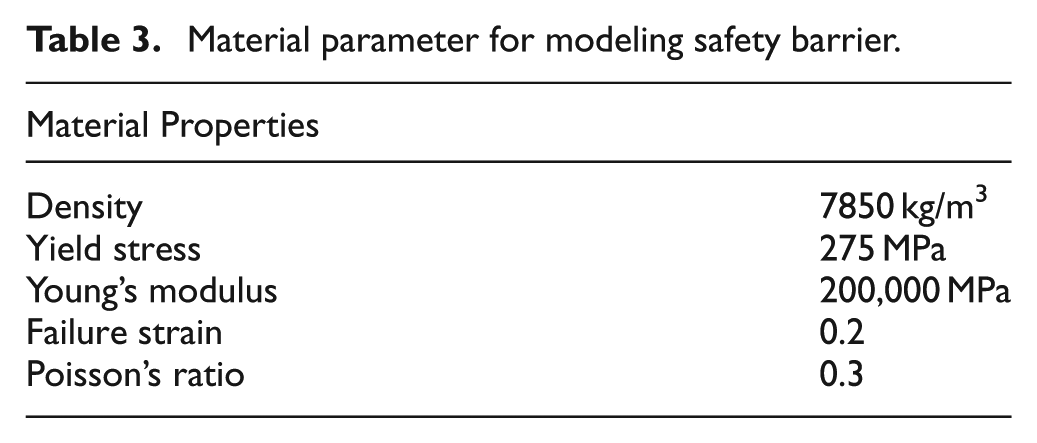
The W-beam guardrail component materials, such as the posts and W-beam, were represented using MAT024 (a piecewise linear plasticity material model) in LS-DYNA. The strain rate was evaluated using a Cowper–Symonds 18 strain rate model with the following parameter values: D = 40.4/s and q = 5. Table 3 shows the properties of the material used for creating the road safety barrier model.
Material parameter for modeling safety barrier.
Vehicle model
A Geo Metro vehicle model (version GM-R3) available in the National Crash Analysis Center (NCAC) database 19 was used in this experiment. This vehicle was selected according to the European standard EN 1317. The vehicle model was developed and improved in Politecnico di Milano, Italy, and is publicly accessible on the NCAC Web page. This car was useful in simulating the impact of a passenger car (900 kg) on the road safety barrier according to the TB11 test regulation for EN 1317-2. The car model contained 227 parts, 25,037 shell elements, and 28,656 nodes (Figure 5). An element was defined using the ELEMENT_SEATBELT_ACCELEROMETER card in LS-DYNA as an accelerometer for collecting the acceleration–time history in the vehicle local coordinate system from the center of gravity. The car was validated according to the procedures introduced in the Robust Project. 20
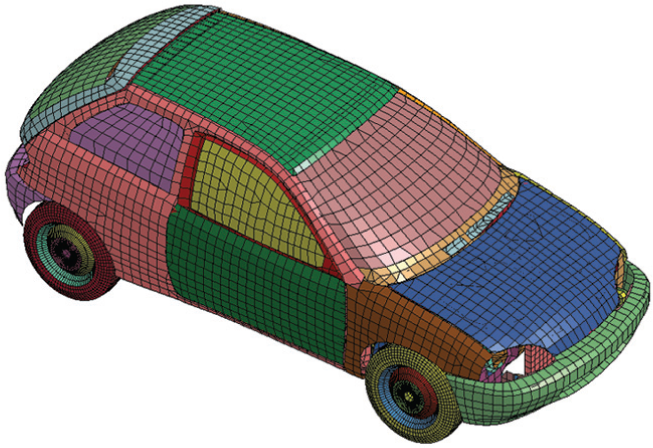
Finite impacting vehicle model.
Boundary condition
Guardrail continuation: elastic springs were added at both ends of each node along the depth of the W-beam to represent boundary conditions (Figure 6). The spring stiffness can be calculated as follows

Boundary condition.
where A is the cross-sectional area of the W-beam, E is the Young’s modulus of steel, and L is the length of the unmodeled W-beam guardrail.
Post–soil interaction: the post–soil interaction was modeled using nonlinear spring elements fixed along the longitudinal and lateral directions on the two adjacent sides of the posts. Nine-layered springs with a spacing of 100 mm were used. Figure 6 illustrates the nonlinear springs in the model. The stiffness of the nonlinear springs increased with the depth and was determined according to the method proposed by Habibagahi and Langer 21 and Plaxico et al. 22
Roadway mode: the roadway was defined using a rigid wall card (RIGIDWALL_PLANAR) to simulate contact between the car and the ground.
Impact test simulation
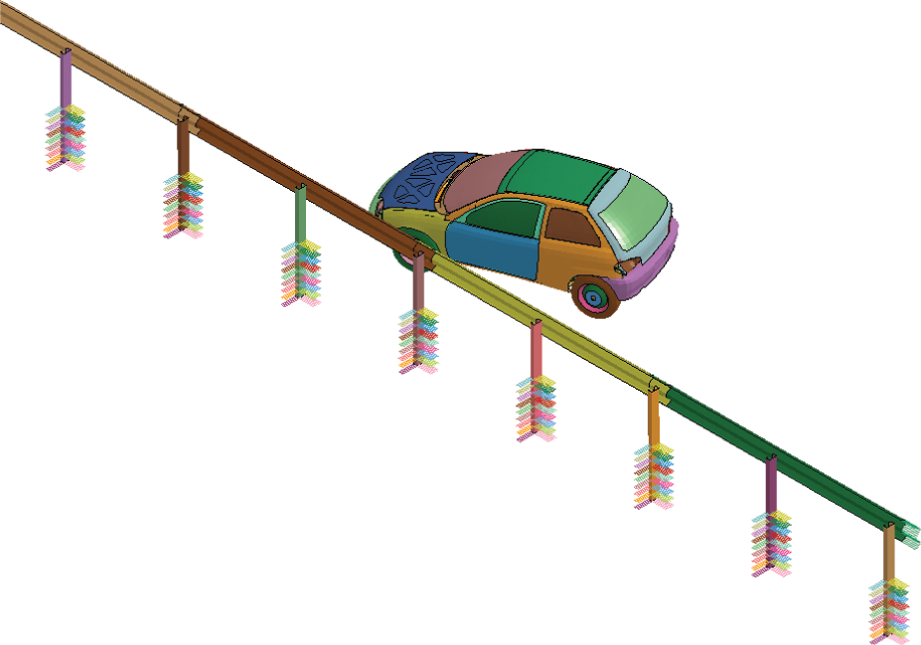
Figure 7 depicts the initial condition of the road safety barrier simulation and experimental test. The impact test model comprised the vehicle and safety barrier. The vehicle speed was set to 100 km/h with an impact angle of 20° according to the TB11 test regulation.

Picture of W-beam guardrail before crash testing.
An AUTOMATIC_SURFACE_TO_SURFACE card with soft constraint type 1 was used as a contact between the vehicle and the barrier. The static coefficient of friction was set to 0.15, dynamic coefficient of friction was set to 0.09, and exponential decay coefficient was set to 0.266e−3. 23
The sampling period was set to 10 µs in NODOUT data to reduce the number of points collected and to prevent the occurrence of aliasing phenomena. 24 The output data were filtered using a 180-Hz SAE filter and then processed using the Test Risk Assessment Program software developed by the Texas Transportation Institute. 25
Validation
The computer-simulated roadside barrier models were validated according to a procedure proposed by Plaxico and colleagues. 26 Energy balance curves produced using LS-DYNA were analyzed as a measure of the numerical stability of the simulation. Figure 8 shows the energy balance curves in the model, which were used to verify the numerical stability of the analytical solution. From the initiation to the termination of the analysis, the variation in the total energy (including kinetic, potential, and contact energy) of the analytical solution must not exceed 10%. The hourglass energy of the analytical solution at the end of the run was less than 5% of the total initial energy at the beginning of the run and less than 10% of the total internal energy at the end of the run.
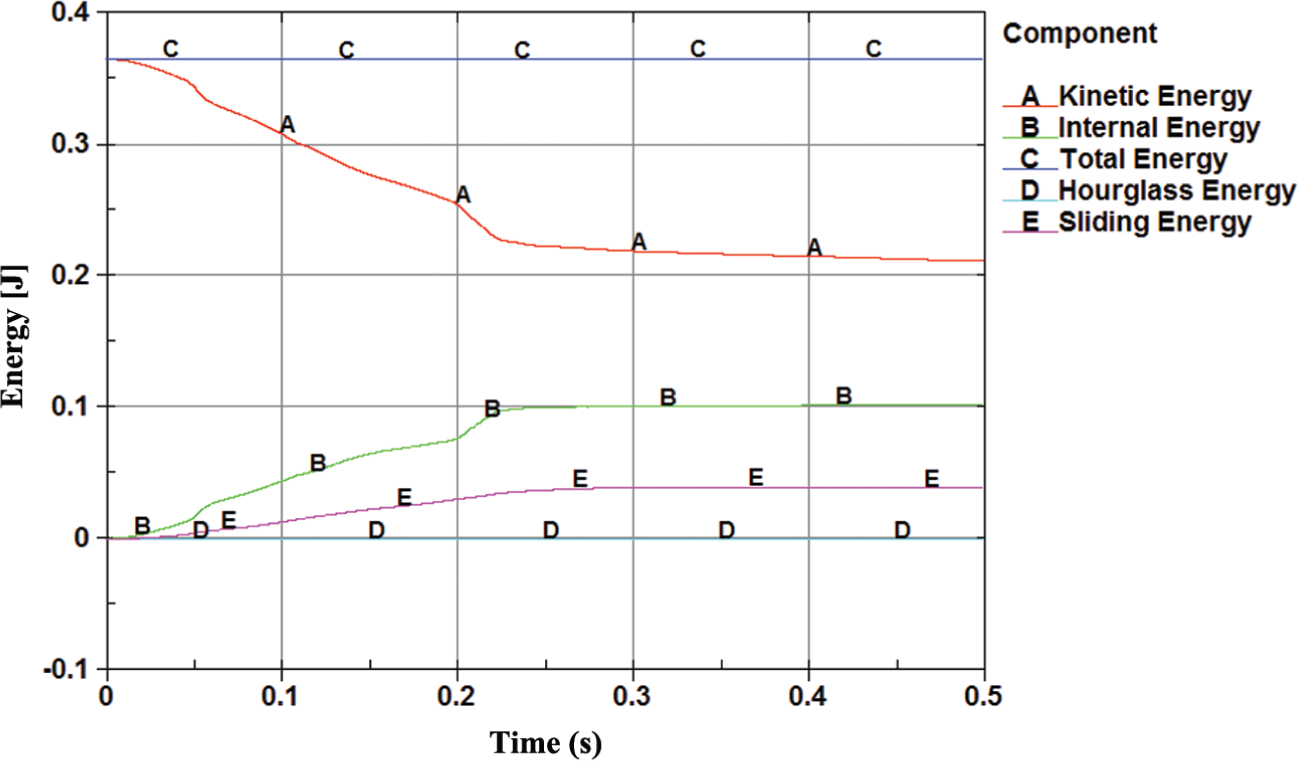
Global energy balance curves of model.
Figure 9 illustrates a time sequence comparison between the simulation and the test results. The vehicles in the crash test and simulation were effectively redirected. A phenomena important ranking table (PIRT) was used to compare the test and simulation results. The maximum recommended relative difference between the simulation and test results observed in the PIRT was 20%. As shown in Table 4, the experimental and simulation results were highly consistent, satisfying PIRT criteria. A reasonable overall correlation was observed between the test and simulation results. Thus, the model was validated and served as a baseline model.

Validation result on road safety barrier impact test.
Comparison between experimental and simulation.

THIV: theoretical head impact velocity; ASI: acceleration severity index.
Effect of post spacing of W-beam guardrail on safety performance
Results
In this analysis, three models were run, and the distance between posts in these models was 1333, 2000, and 4000 mm, respectively. The rail height in all models was 750 mm. Other model components such as W-beam splices, posts, soil, and barrier continuation were designed using the same approaches as those used in previous models. Figures 10–13 show the impact test results of the road safety barrier finite element models. In all three cases, the barriers prevented the vehicle from leaving the road and redirected it onto the road. Table 5 shows the impact severity (ASI and THIV) and working width of the simulation models. The barriers with 2000- and 4000-mm post spacing registered working widths of 805 and 892.1 mm, respectively. These values corresponded to the working width class W3. The barrier with the 1333-mm post spacing demonstrated a working width of 700 mm, which corresponded to class W2. The barrier with the 2000-mm spacing had ASI value of 0.93 and THIV value of 26.1, corresponding to the impact severity class A. The barrier with the 4000-mm spacing had ASI value of 1.05 and THIV value of 23.1 (km/h) and that with the 1300-mm spacing registered ASI value of 1.15 and THIV value of 26.1 (km/h), both barriers corresponding to the impact severity class B. Figure 14 illustrates the ASI values obtained over time for the three barriers with various post spacings.

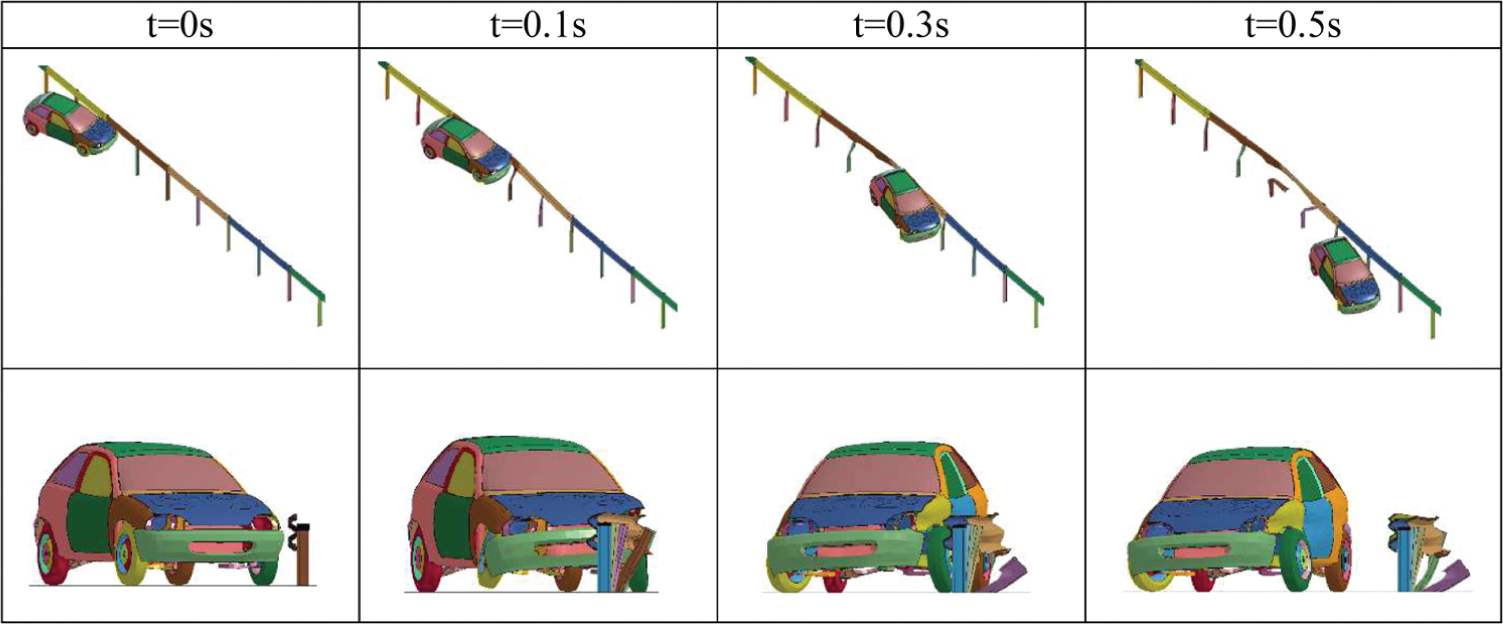
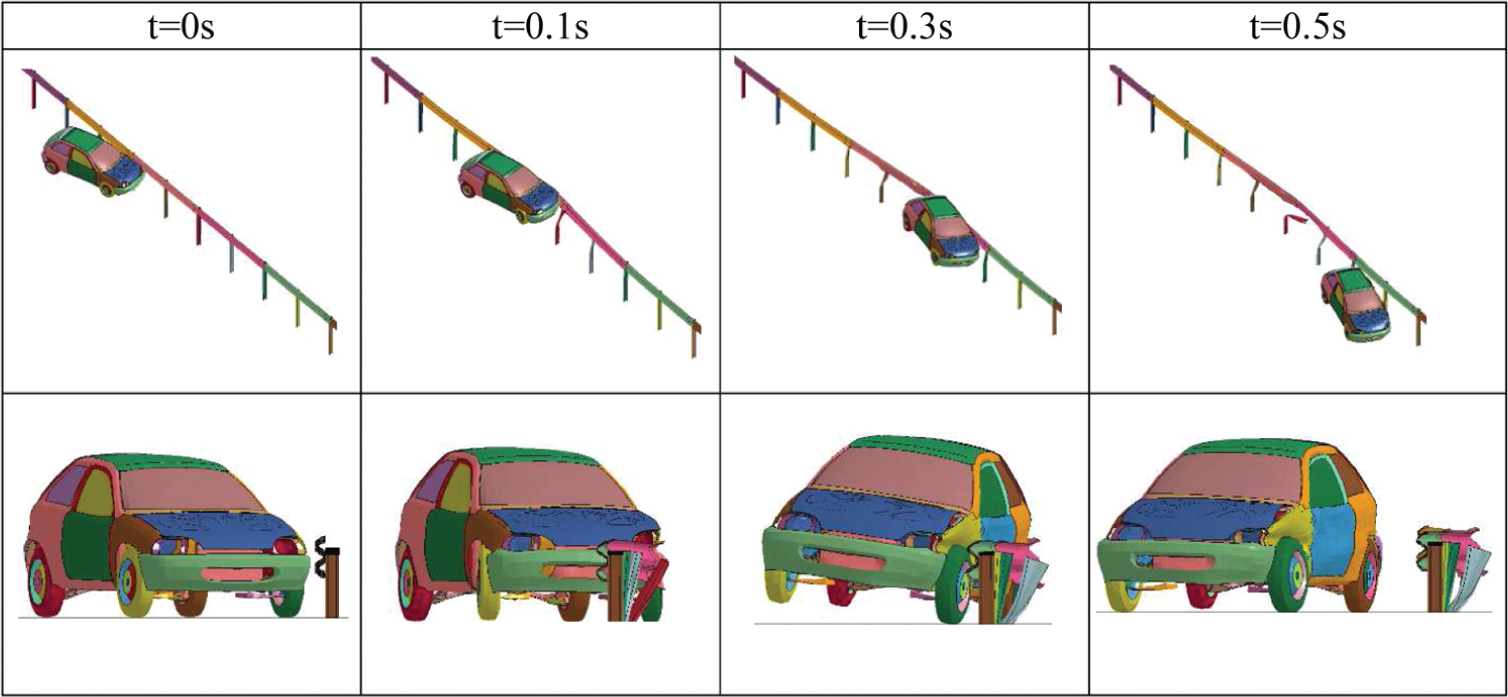
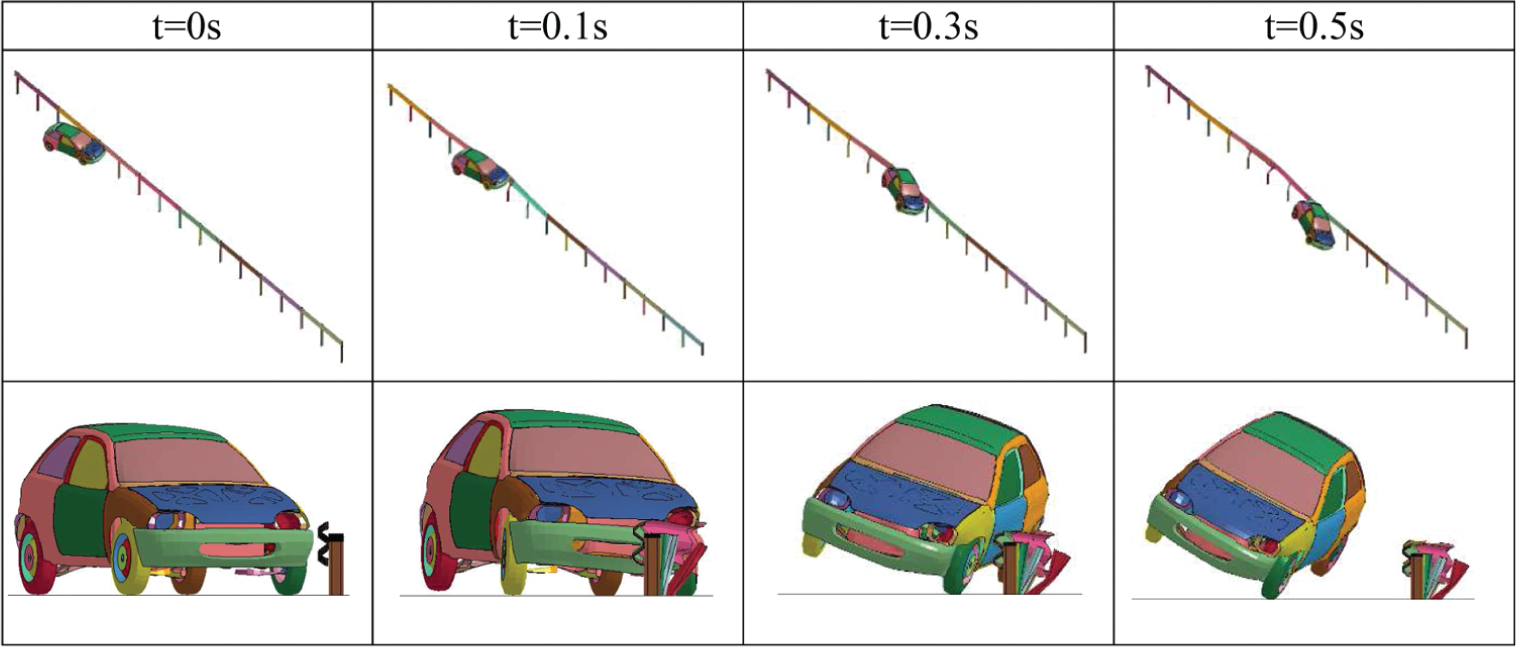
Sequential from simulation test with 4000 m distance between posts.

Sequential from simulation test with 2000 m distance between posts.

Sequential from simulation test with 1333 mm distance between posts.

Barrier deflection and vehicle with various distances between posts at 500 ms.

Acceleration severity index value over time with various distances between posts.
Impact severity and working width with different distances between posts.

ASI: acceleration severity index; THIV: theoretical head impact velocity.
Discussion
These results indicated that the barrier working width decreased with the distance between posts. In all the three test cases, the barrier met the EN 1317-2 requirement. In this test case, the barrier with the 2000-mm spacing demonstrated superior performance relative to the remaining barriers, resulting in this barrier system belonging to impact severity class A. The barrier with the 1333-m post spacing registered the highest ASI value (i.e. 1.15).
Effect of rail height of W-beam guardrail on safety performance
Results
When the rail height is changed, the relationship between the car bumper height and the barrier also changes. Ross and Sicking 27 presented containment criteria for W-beam barriers using a car’s bumper as a reference point (Figure 15). Figure 15 indicates that when the mid-height section of the bumper impacts a region between the upper and lower corrugation centers of the W-beam barrier, the barrier demonstrates acceptable behavior as expected.

Small car and containment criteria for W-beam barrier.
Several LS-DYNA simulations were conducted using various rail heights for examining the relationship between rail heights and the crashworthiness of the barriers. When the model was validated as presented in the previous section, five additional simulations involving varying rail heights were run. According to the procedures described by Engstrand, 28 from the standard height of 750 mm, the barrier height was increased and decreased at a step size of 50 mm until the minimum number of simulation tests was reached. In these simulations, the rail heights were varied from the ground level to the top of the W-beam as follows: 600, 650, 700, 800, and 820 mm. The minimum and maximum heights were set to determine how the bumper of the test vehicle impacts the barrier containment and redirection zone according to Ross and Sicking’s 27 assumption (Figure 15). During the result analysis and performance evaluation of the barrier, emphasis was placed on the potential of the barrier to contain and redirect the vehicle, with the acceptable impact severity and working width set according to EN 1317-2. All models were identical, except for the rail height. Figures 16–23 and Table 6 show the simulation results. The results revealed that in the cases involving the standard barrier height (750 mm), three 50-mm reductions in the barrier height (700, 650, and 600 mm), and one 50-mm increment in the barrier height (800 mm), the vehicle was redirected, indicating that the barrier satisfied the EN 1317 standard. This barrier height (820 mm) had ASI value of 1.02 and THIV value of 38.7 km/h (Table 6). Thus, the 820-mm-high barrier did not satisfy the EN 1317 standard.

Simulation results from the 820-mm barrier height.

Rail contact with hood.

Simulation results from the 800-mm barrier height.
Simulation results from the 750-mm barrier height.
Simulation results from the 700-mm barrier height.

Simulation results from the 650-mm barrier height.
Simulation results from the 600-mm barrier height.
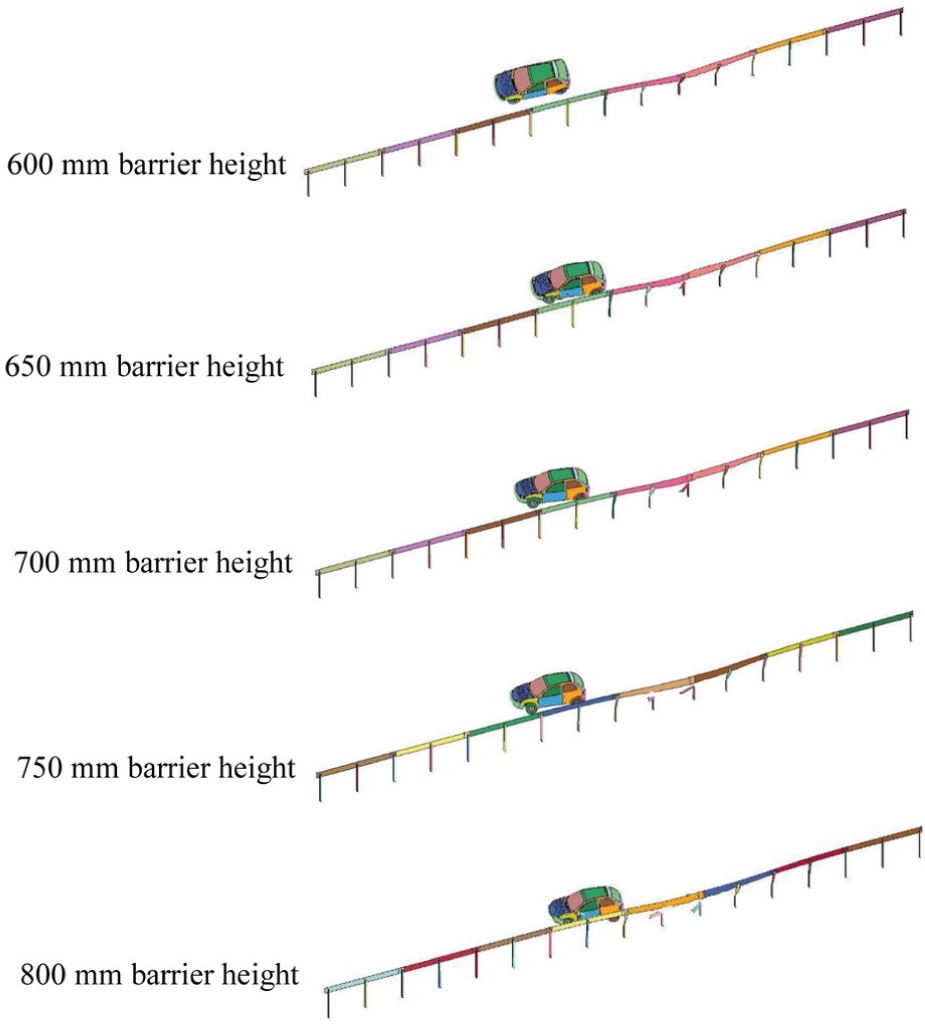
Barrier deflection and vehicle with various rail heights at 500 ms.
Results from simulation with various barrier heights.
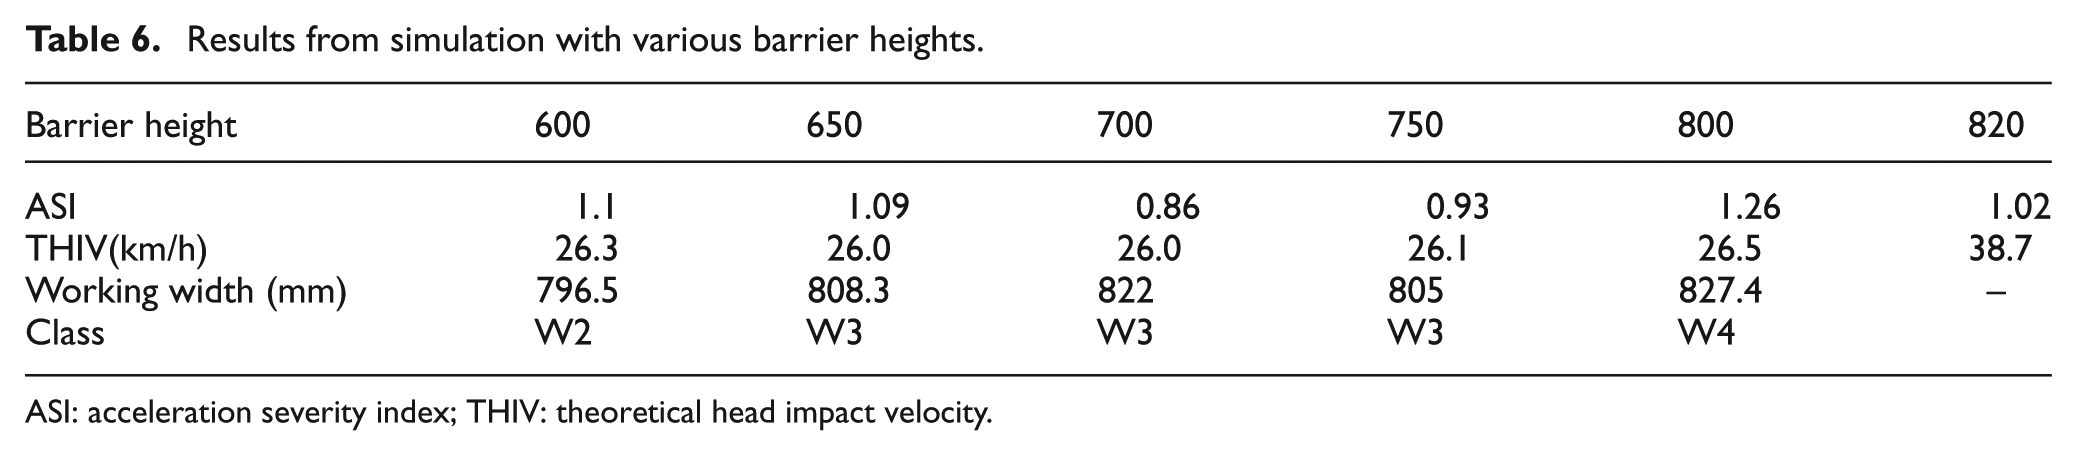
ASI: acceleration severity index; THIV: theoretical head impact velocity.
Discussion
These simulations showed that the rail height does not affect working width and THIV. But the barrier height affects ASI. A slight difference was observed in the THIV value and working width; only the case involving the 600-mm barrier height registered a working width corresponding to class W2, and the remaining cases exhibited working widths corresponding to class W3. The 800-mm barrier height showed the highest ASI value (i.e. 1.26), and the 700-mm barrier height demonstrated the lowest ASI value (i.e. 0.86). The impact severity levels of the 700- and 750-mm-high barriers corresponded to class A, whereas those of the remaining barriers corresponded to class B. Therefore, 700- and 750-mm-high barriers provide a greater safety level for errant vehicle occupants compared with barriers installed at other heights. Figure 24 illustrates the ASI values recorded over time in the simulations of the 700- and 750-mm-high barriers. Figure 25 depicts the absorbed crash energy of these models. The results showed that the 700-mm-high barrier absorbed considerably more energy than the standard 750-mm-high barrier did. The optimal result was registered by the 700-mm-high barrier with a 2000-mm span, which demonstrated a lower ASI value and higher energy crash absorption than the standard model did.
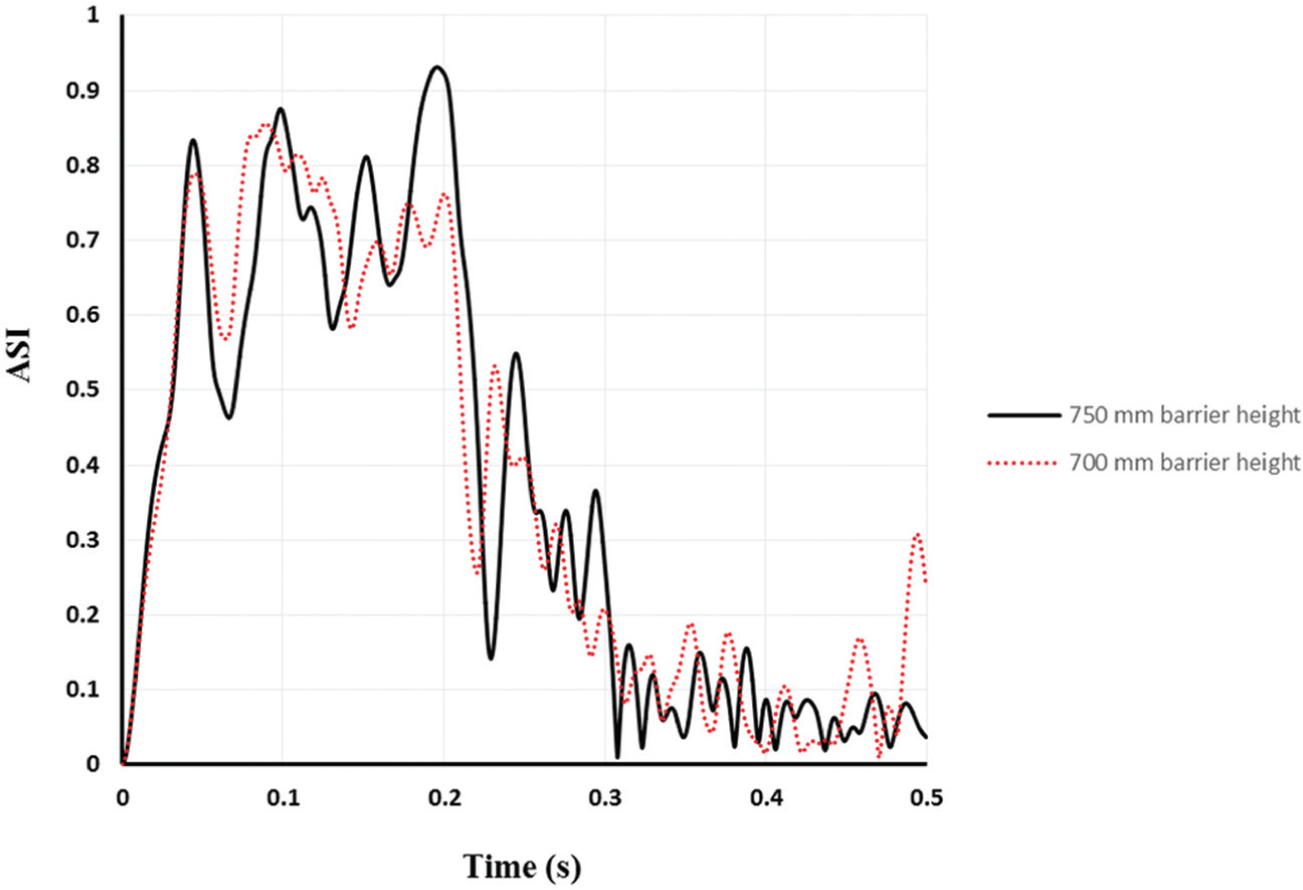
Acceleration severity index value over time with various barrier heights.
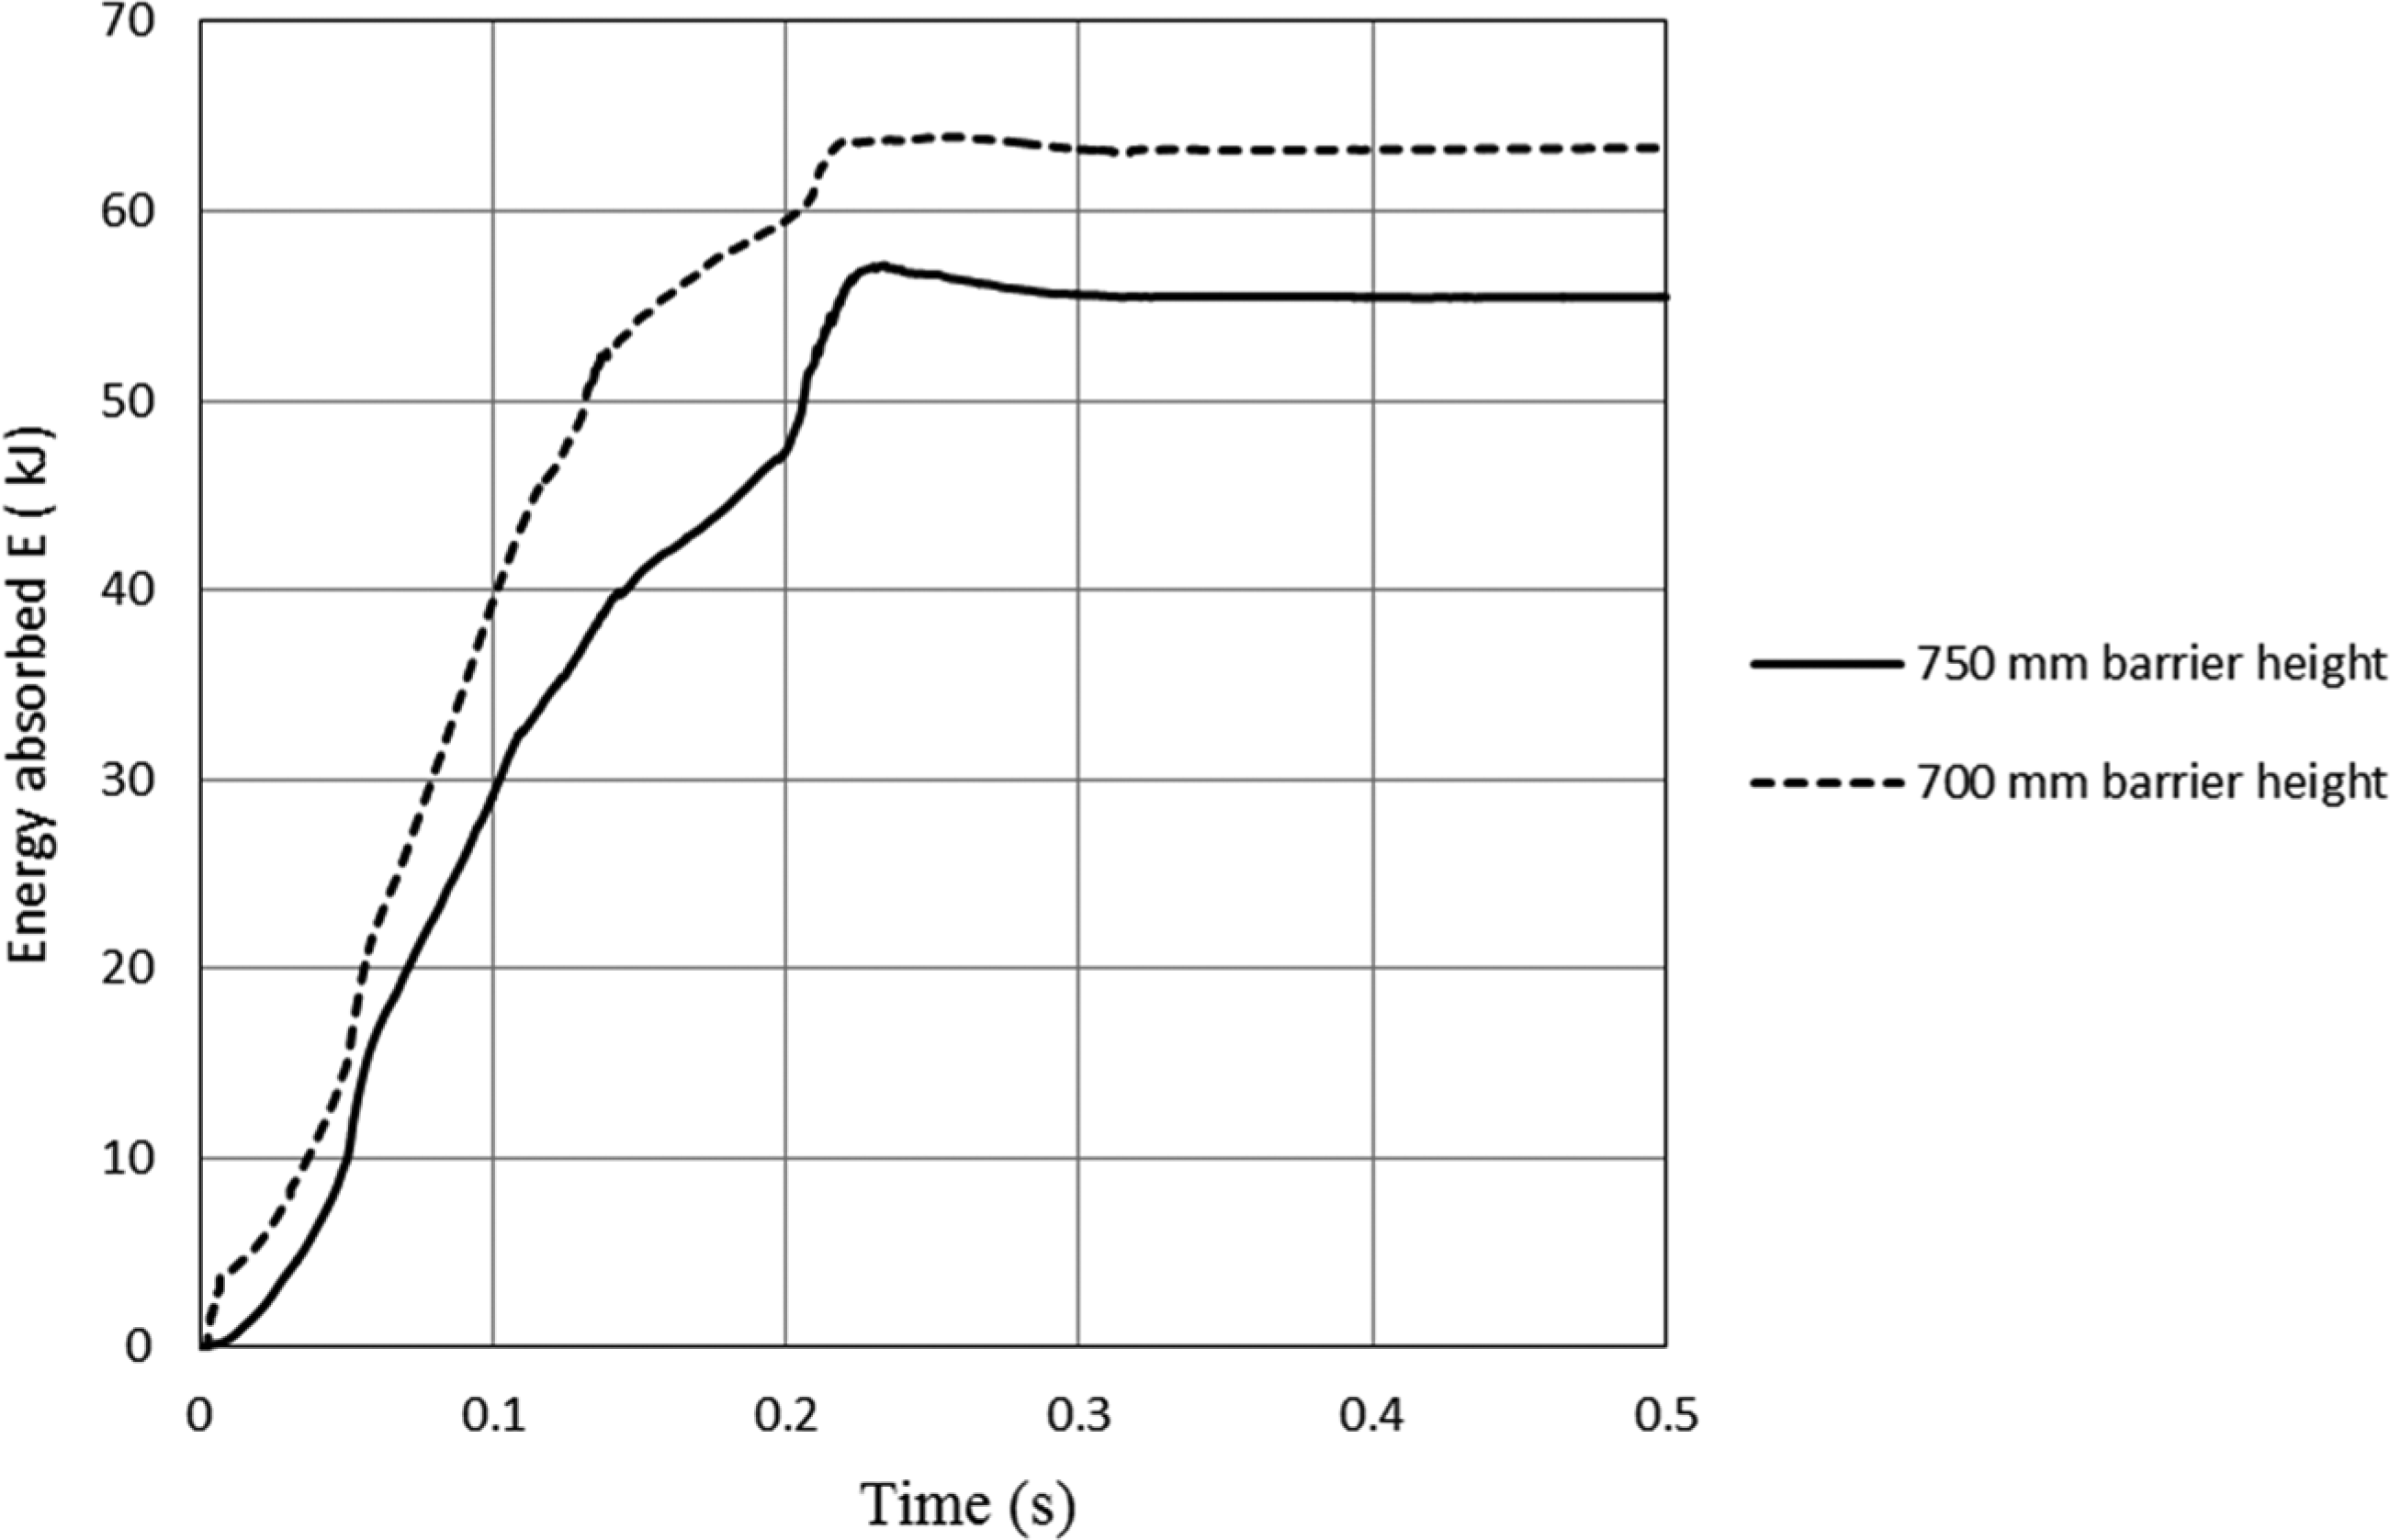
Absorbed crash energy of road safety barrier for difference barrier heights.
When the rail of the 820-mm-high barrier was impacted by the hood of the vehicle (Figures 16 and 17), the vehicle was prevented from penetrating the barrier further. If the rail height is increased, it may be impacted by the windshield, causing unacceptable penetration to the occupant compartment or forcing the vehicle through the barrier and hitting the dangerous barrier. 13 The maximum safe guardrail mounting height is 800 mm.
Conclusion
The study applied the finite element code LS-DYNA to evaluate the safety performance of W-beam guardrail, which had various rail heights and three post spacings, when impacted by a 900-kg small passenger car (TB11 test). Eight crash test simulations were conducted to evaluate the crashworthiness of the AG04-2.0 barriers at various rail heights and post spacings according to the European standard EN. A baseline model was developed and validated against the existing crash test models. The results can be used as a reliable reference when installing and maintaining W-beam guardrail systems. According to the simulation results, the following conclusions were drawn:
The W-beam guardrail with the 750-mm rail height and 1330, 2000, and 4000 mm spans met the EN 1317 requirement. The barriers with the 1333- and 4000-mm spans corresponded to the impact severity class B, and the barrier with the 2000-mm span demonstrated optimal safety performance, resulting in the system corresponding to the lowest ASI value and impact severity class A. The barrier working width decreases with the post span.
For the four height cases (600, 650, 700, and 800 mm) associated with the 2000-mm post span, the vehicle was redirected and the barrier met the EN 1317 standard. The impact severity of the 700- and 750 mm-high barriers corresponded to class A, whereas those of the remaining barriers corresponded to class B. The 820-mm-high barrier did not meet the EN 1317 standard. The maximum safe guardrail mounting height is 800 mm.
The optimal result was registered by the W-beam guardrail with a 700-mm rail height and 2000-mm post spacing, which resulted in a lower ASI value and higher crash energy absorption compared with the standard model. These barrier dimensions are considered the optimal design dimensions for providing protection vehicle occupant during impacts.
Footnotes
Academic Editor: Magd Abdel Wahab
Declaration of conflicting interests
The author(s) declared no potential conflicts of interest with respect to the research, authorship, and/or publication of this article.
Funding
The author(s) received no financial support for the research, authorship, and/or publication of this article.