
Abstract
A numerical and experimental study was conducted for heat transfer enhancement and fluid flow in a constant heat-fluxed rectangular wooden duct fitted with two shapes of vortex generators (circular and square). These vortex generators are of the same area and placed at two different locations (
Introduction
In recent years, energy and material saving considerations have promoted an expansion of efforts that aim to produce more efficient heat exchanger equipment through the augmentation of heat transfer. The potential of heat transfer in engineering applications is high. Among these applications are the heat exchangers, in which the increase in heat exchanger efficiency by augmentation or enhanced heat transfer may result in considerable saving in the required material. Therefore, the use of enhanced surfaces allows designers to increase heat duty for a given exchanger, usually with pressure drop penalty, or to reduce the size of heat exchanger for a given heat duty. A variety of different techniques that have been employed for heat transfer processes are generally referred to as enhancement. 1
Energy saving and efficiency are the key issues in power generation system not only from the viewpoint of fuel consumption but also for the protection of global environment. 2 At present, different methods of convective heat transfer enhancement in heat transfer channels have been proposed and studied. 3 A vortex generator (VG) is a technique that holds promise in air-side heat transfer enhancement. 4 The study of improved heat transfer performance is referred to as heat transfer enhancement, augmentation, or intensification. In general, this means an increase in heat transfer coefficient. Attempts to increase normal heat transfer coefficients have been recorded for more than a century. 5
Classification of enhancement techniques
All techniques used to generate flow perturbations around the surface of a heated body, in order to improve its heat transfer rate, are generally known as “techniques for the augmentation of heat transfer.” These enhancement techniques can be classified into two main categories: active and passive techniques. The former consist of mechanical devices, which are able to modify directly the boundary layer structure (suction or injection of fluid, fluid and surface vibrations, jet impingement, etc.), and the latter are static devices such as perturbation grids, winglets, surface ribs, or grooves, placed upstream of the heated body in order to increase perturbations and turbulence intensity in the flow stream. 6 These passive schemes promote higher heat transfer coefficients by disturbing or altering the existing flow behavior. This, however, is accompanied by an increase in pressure drop. In the case of active techniques, the addition of external power essentially facilitates the desired flow modification and the concomitant improvement in the rate of heat transfer. The use of passive and/or active in conjunction constitutes a compound enhancement.
Vortex generation
Longitudinal vortices generated by wings at an angle of attack spiral the flow around their axes and persist to hundreds of wing chords downstream of the wing. When longitudinal vortex generators (LVGs) are placed near a heat transfer surface or when they are part of the heat transfer surface, they increase the heat transfer by transporting fluid from the wall into the free stream and vice versa. The effectiveness of a VG in substantially enhancing the heat transfer over a large area is the vortex strength that can be generated per unit area of the VG. From theory and experiment, it is well known that slender delta wings are the most effective LVGs. For heat transfer enhancement, a price always has to be paid in the form of high flow losses. Also, turbulators are devices that turn a laminar flow into a turbulent flow. Turbulent flow can be desired on parts of the surface of an aircraft wing (airfoil) or in industrial applications such as heat exchangers, mixing of fluids, and can also be put for use in certain internal combustion engines—particularly, a ramjet engine.
Previous studies on the enhancement of heat transfer by VGs
Numerical studies
Prabhakar et al. 7 studied numerically, for a laminar flow, the forced convection heat transfer in a narrow rectangular duct with a built-in oval tube in conjunction with the presence of a winglet pair. The results of longitudinal vortices generated due to VGs are stronger for winglet located away from the tube wall. Also, winglets that are far away from the tube brought more heat transfer enhancement than nearer winglets. Also, the interaction between the secondary flows generated by the tube and by the winglets, as well as the interaction of the longitudinal vortices due to different arrangements of the winglets, plays an important role in heat transfer enhancement.
Valencia and Sen 8 investigated the flow structure and heat transfer in a plane channel with periodically placed VGs of different forms in the Reynolds number range corresponding to unsteady laminar and transitional flow. The numerical results from four different configurations—a pair of square bars, a rectangular bar, and two different baffle arrangements—showed that the heat transfer and pressure drop are strongly dependent on the geometry used. They concluded that the best result is with the two square bars, which has a heat transfer enhancement of factor 5 and pressure drop increase of 43 for Re = 800. The arrangements with only one built-in rectangular bar had in general a better performance than the other configurations. The performance of all the configurations was very sensitive to the geometrical parameters, in particular to the choice of pitch.
Hiravennavar et al. 9 investigated, for a laminar flow, the flow structure and heat transfer enhancement of winglet pair compared to a single winglet. It was observed that enhancement in heat transfer due to a pair of winglets is almost twice that due to a single winglet. Also, the finite thickness of winglet provides more cross-sectional area for energy transfer from the bottom plate and results in increased heat transfer.
Wu and Tao 10 studied the effect of the punched holes and the thickness of the rectangular winglet pair (RWP) to the fluid laminar flow and heat transfer numerically. They found that the average Nusselt number of the whole channel with holes is slightly higher than that without holes while the average friction factor is slightly lower. Also, the average Nusselt number of the whole channel at the condition of considering the thickness of LVG is lower than that of the case neglecting the thickness of LVG. The thickness of LVG has little influence on the average friction factor of the channel at the present condition.
Tian et al. 11 performed three-dimensional (3D) numerical simulations on laminar heat transfer and fluid flow characteristics of a flat-plate channel fitted with LVGs. The effects of two different shaped LVGs, RWP and delta winglet pair (DWP) with two different configurations, common-flow-down (CFD) and common-flow-up (CFU), were studied. The numerical results indicated that the application of LVGs effectively enhances heat transfer and increases pressure drop in the channel. Also, the channel with DWP has better overall performance than RWP; the CFD and CFU configurations of DWP have almost the same overall performance; the CFD configuration has a better overall performance than the CFU configuration for RWP.
Experimental studies
Chomdee and Kiatsiriroat 12 investigated experimentally the heat transfer performance of staggered array electronic modules with the presence of a delta winglet VG integrated in front of each electronic module. From the study, it could be concluded that due to delta winglet VGs, higher value of Reynolds number results in higher pressure drop in the laminar fluid flow. Also, delta winglet VGs could enhance the adiabatic heat transfer coefficient and reduce the thermal wake function including the module temperature effectively for the staggered module array.
Depaiwa et al. 13 examined heat transfer and friction loss behaviors for turbulent airflow through a constant heat flux channel fitted with 10 pairs of rectangular winglet turbulators. They found that the use of the rectangular winglet turbulators provides significantly higher heat transfer rate and friction loss than the smooth wall channel heater. Also, larger attack angle value leads to higher heat transfer rate and friction loss. The best operating regime for using rectangular winglets turbulators was found at the lowest Reynolds number value.
Min et al. 14 presented a modified rectangular LVG obtained by cutting off the four corners of a rectangular wing. Heat transfer characteristics of this LVG mounted in rectangular channel are experimentally investigated and compared with those of original rectangular LVG, for a turbulent flow. The results showed that modified rectangular wing pairs (MRWPs) have better heat transfer characteristics than those of rectangular wing pairs (RWP).
Chompookham et al. 15 carried out an experimental investigation to study the effect of combined wedge ribs and winglet-type vortex generators (WVGs) on heat transfer for a turbulent airflow through a constant heat flux channel. The presence of combined ribs and WVGs showed significant increase in heat transfer rate over smooth channel. The Nusselt number values obtained from combined ribs and WVGs are found to be much higher than those from ribs/WVGs alone. Aris et al. 16 conducted an experimental work of transitional airflow to determine heat transfer enhancement and flow pressure losses due to the presence of active delta wing VGs on a heated rectangular channel surface. Both the heat transfer and the pressure loss resulting from this experiment have demonstrated the ability of active VGs as heat transfer enhancers. Although the active delta wing VGs developed in this research were scaled and tested for microelectronics applications, they still have great potential for use in a variety of different applications such as in automotive and aerospace industries. Henze and Von Wolfersdorf 17 tested the longitudinal vortices induced by tetrahedral VGs. The vortices and the related heat transfer depend on the approach turbulent flow conditions. The results showed that the highest VGs showed the highest heat transfer enhancement. Also, an increasing Reynolds number leads to increasing heat transfer coefficients, whereas the heat transfer enhancement related to the smooth channel flow decreases.
Experimental and numerical studies
Yousif 18 carried out an experimental and numerical study on the flow and heat transfer from a heated cylinder using (rectangular, triangular, trapezium and elliptic)-type VGs where Reynolds number was 7200–14,400 with an angle of attack (20°, 26°, and 32°). The average heat transfer enhanced by 4%−15% using WVG. JE O’Brien et al. 19 focused on whether air-side heat transfer can be improved through the use of fin-surface VGs (winglets) while maintaining low heat exchanger pressure drop. Representative experimental and numerical results presented in this article reveal quantitative details of local fin-surface heat transfer in the vicinity of a circular tube with a single DWP downstream of the cylinder. The winglets were triangular (delta) with a 1:2 height:length aspect ratio and a height equal to 90% of the channel height. Overall mean fin-surface Nusselt number results indicate a significant level of heat transfer enhancement (average enhancement ratio 35%) associated with the deployment of the winglets with oval tubes. Comparisons of heat transfer and pressure drop results for the elliptical tube versus a circular tube with and without winglets are provided with flow Reynolds numbers based on channel height and mean flow velocity ranging from 700 to 6500.
Wu and Tao 20 carried out experimental and numerical analyses of the average convective heat transfer on the top and bottom surfaces of a plain plate and four plates with a pair of delta winglet LVG punched directly from the plates at attack angles of 15°, 30°, 45°, and 60°, respectively. The experimental results show that the average Nusselt number on the surfaces of plate increases with the increase in the attack angle of DWP compared with that of plain plate without DWP in the test range. The average Nusselt number of the plate with attack angle of 60° is slightly higher than that of plate with attack angle of 45°, yet may bring larger pressure drop. The heat transfer in the tested channel of five cases is also numerically investigated. The variance of average Nusselt number between the numerical results and experimental results for the five cases is less than 10%, validating the present models and methods used for the simulation of fin channel flow with punched VGs feasible and reliable. The experimental and numerical results reveal that the transverse flow of air stream through the punched holes disturbs airflow in the lower channel, enhancing heat transfer under surface of fin.
The literature survey has shown that VG types and vortex phenomena affect heat transfer. Also, most of the works of other authors focused on the friction factor, pressure drop, heat transfer, and relation between Nusselt number and Reynolds number. The literature survey has also shown that no work has been done on the heat transfer through the duct heaters with constant heat flux along the duct using various shapes of VGs (circular and rectangular).
Scope of this research
The aim of this study is to investigate turbulent flows in heated rectangular ducts using two types of VGs (circle cross-sectional vortex generator (CCSVG) and square cross-sectional vortex generator (SCSVG)) at two different locations (
Numerical simulation
Fluent code on flow characteristic
Fluent is a computational fluid dynamics (CFD) software package to simulate fluid flow problems. It uses the finite volume method to solve the governing equations of a fluid. It provides the capability to use different physical models such as being incompressible or compressible, inviscid or viscous, and laminar or turbulent flow using Fluent 6.3. Geometry and grid generation are done using GAMBIT which is the preprocessor bundled with Fluent. Fluent is a state-of-the-art computer program for modeling fluid flow and heat transfer in complex geometries. It provides complete mesh flexibility, including the ability to solve flow problems using unstructured meshes that can be generated about complex geometries with relative. Fluent is written in C computer language and makes full use of the flexibility and power offered by the language. Figure 1 shows the basic program structure, and Figure 2 shows the analysis steps for Fluent software package.

Basic program structure.

CFD simulation pipeline.
Numerical approach by Fluent
The Fluent solver is based on the finite volume method. The fluid problem scheme of Fluent 6.3 is defined by the law of conservation of mass, momentum, and energy. This law is expressed in terms of partial differential equation which is discretized with finite volume–based technique. The solution to the turbulent problem then revolves around the solution of the turbulent viscosity. The turbulent viscosity is calculated as a function of the turbulence model, kinetic energy (k), and its dissipation rate (ε). The empirical constant is in the (k–ε) models. The discretized conservation is solved iteratively. A number of iterations are usually required to reach a converged solution. Convergence is reached when residuals are
Grid generation
The choice of which mesh type to use will depend on the application. For the problems that involve complex geometries, the creation of structured or block-structured grids (consisting of hexahedron cells) can be extremely time-consuming, if not impossible. Therefore, the setup time is the major motivation for using unstructured grids employing tetrahedron cells. The range of length scales of the flow is large and a tetrahedron mesh can often be created with far fewer cells than the equivalent mesh consisting of hexahedron cells. This is because a tetrahedron mesh allows cells to be clustered in selected regions of the flow domain as shown in Figure 3 at the heater and VG regions, whereas structured hexahedron meshes will generally force cells to be placed in regions where they are not needed. This is the reason behind this case in this study of unstructured tetrahedron meshes chosen.

Example of grid system generated. Top view for case (a) without VGs and (b) with VGs.
Selection of test section design (heater and VG designs)
Fluent program was used and run over different possible cases to design the experimental test rig whereby the number of heaters, their arrangement, shape, size, and location of VGs inside the duct were examined. First of all, the heater numbers, arrangements, and the correct distances between them and the distance from duct’s walls were examined. It was found that 11 heaters were found suitable for this study, and their design is shown in Figure 4.

Schematic diagram of the arrangement of 11 heaters inside the test section.
Using Gambit program, many diameters of heaters were examined with the same height of 30 cm (the height of test section); heaters’ diameters were taken as 2, 1.5, 1, and 0.65 cm. It was found that the most suitable diameter of heaters was 0.65 cm since it is of the same diameter of the heaters used in the experimental rig. Also, the type of VGs was determined by considering many different shapes and sizes in Gambit program until reaching the two types used in this work. Finally, the final design was run using Fluent program to get the solution.
Mathematical formulation model
The problem under consideration includes the solution of flow field and heat transfer through heaters with and without VGs. The VGs were added to enhance heat transfer from the duct heaters. Their addition affects the flow field and heat transfer in a complex manner suggesting a numerical study. The objective in addition to resolving the flow field is finding the best location for the VGs, although a rather simplified model is considered by assuming the flow to be Newtonian, compressible, unsteady, 3D, turbulent, and k–ε models (standard). The governing equations used are conservation, continuity, momentum, and energy equations. The governing equations are presented in Streeter and Wylie 21 and Welty et al. 22 as shown below:
1. Continuity equation
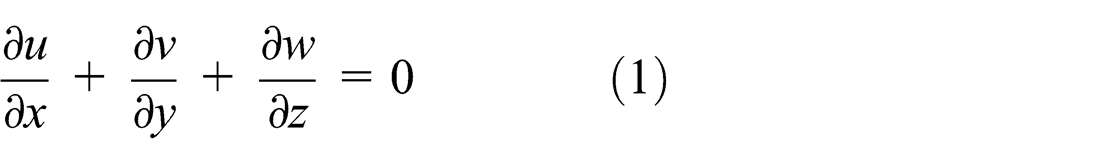
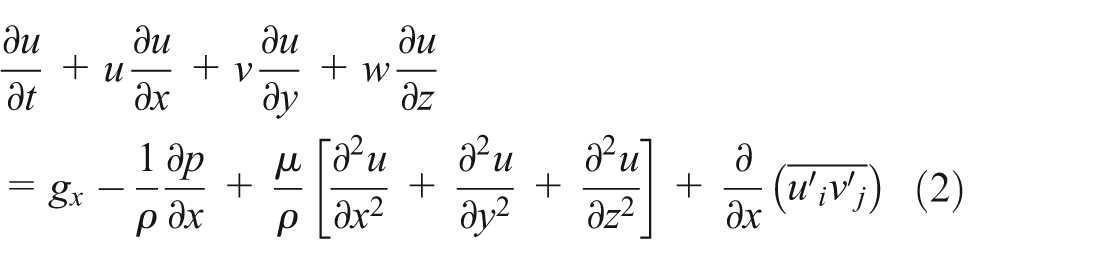
2. Momentum equation
Momentum equation at x-axis
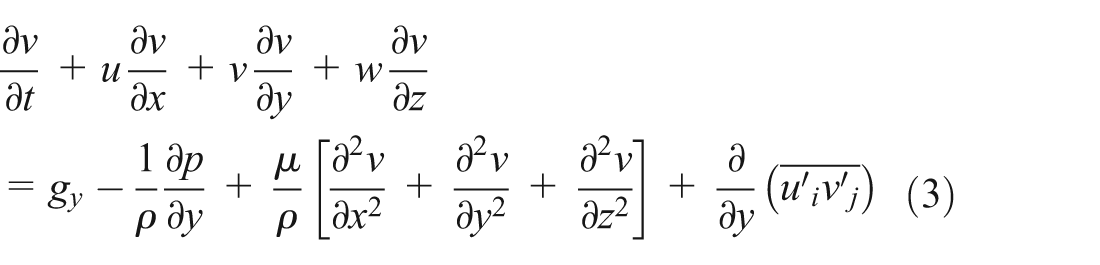
Momentum equation at y-axis
Momentum equation at z-axis

With assumption of steady state, equations (2)–(4) would eliminate the terms
3. Energy equation

Configurations and verification
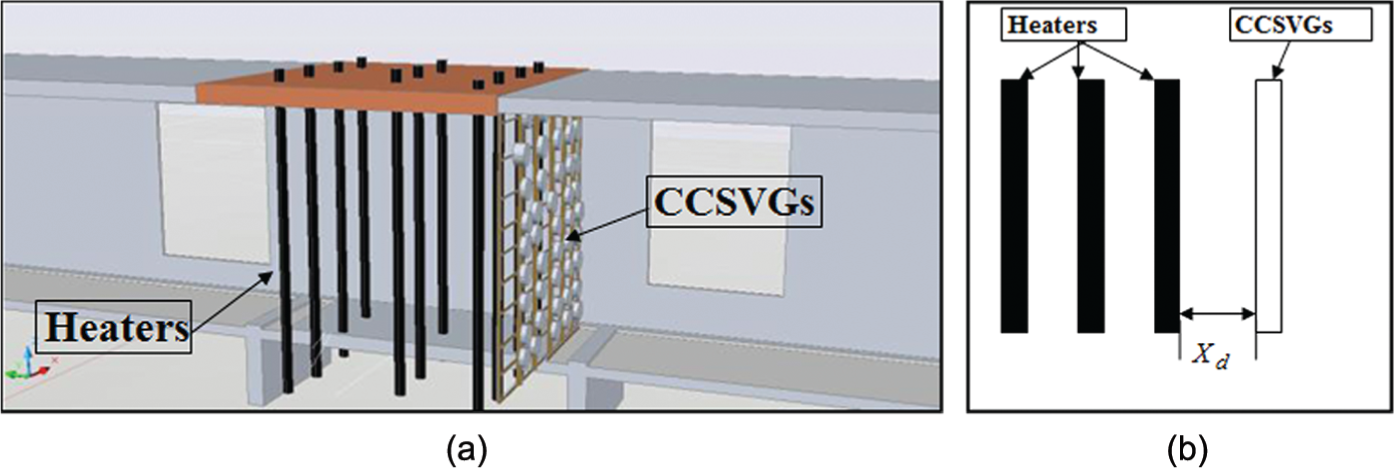
In this study, two grids of VGs were studied: the CCSVGs and SCSVGs of the same area. Both types of VGs are placed ahead of the heater set at two different locations (Xd = 1 cm and Xd = 2 cm). The details of VG arrangement are shown in Table 1.
Arrangement of CCSVGs and SCSVGs of the same area for the grid in y- and z-directions.

VG: vortex generator; CCSVG: circle cross-sectional vortex generator; SCSVG: square cross-sectional vortex generator.
Experimental rig description
The test rig consists of a rectangular wood duct of cross section 15 × 30 cm2 as shown Figure 5, which is constructed of four sections clipped tightly together. The entrance length is 300 cm where the velocity is assumed to be fully developed. The test section contains heaters and VGs of 20 cm in length, 15 cm in width, and 30 cm in height. It contained 11 heaters, each of 30 cm long and 0.65 cm in diameter (Figure 6). Each heater is capable to produce 450 W arranged in a staggered arrangement for three rows (first and last rows contained four heaters, while the second row of the heater set contained three heaters; see Figure 4). The two shapes of VG grids (i.e. CCSVGs and SCSVGs) consist of 84 pieces of cross section of area 2.0 cm2 as shown in Figures 7 and 8. The duct heaters’ section can easily be replaced because it lies between two identical sections of wood.
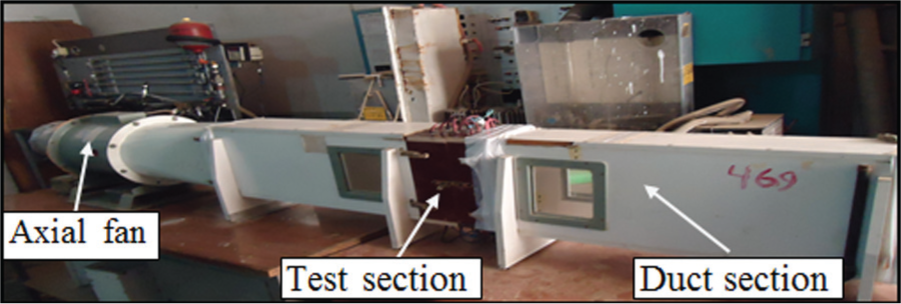
Experimental test rig.

Tube heater.

Vortex generator of CCSVG grid type.
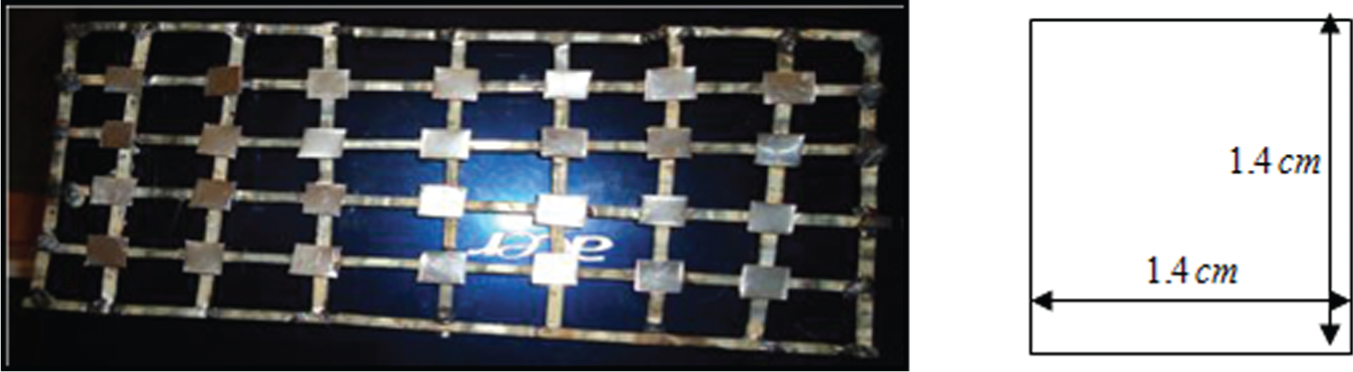
Vortex generator of SCSVG grid type.
The experimental procedure is carried out for three cases (i.e. no VGs, CCSVGs, and SCSVGs). For each test run, the two shapes of VGs are placed ahead of the heater set at two different locations
(a) Heater set arrangement with CCSVG grid type placed at two different locations

Heater set arrangement with SCSVG grid type placed ahead of the heater set at two different locations
The set of experimental measurements of temperature at different locations using thermocouples of type K, located at numbers 2–6, are recorded as shown in Figure 11 and Table 2. The device and Pitot static tube for pressure drop are all recorded. The experiment is repeated for velocities at 4, 8, and 10 m/s with and without the presence of VGs to study the flow behavior at low and high velocities, respectively. The characteristics of the Nusselt numbers, effectiveness, and the Reynolds numbers are based on the film temperature calculated for the tube temperature and the averaged air temperature.

Thermocouple locations inside the wooden duct.
Positions of thermocouples along the duct.

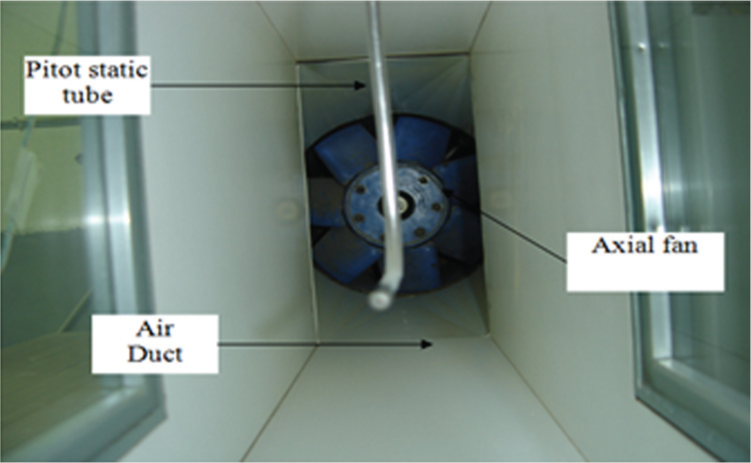
A suction-type axial fan driven by an alternating current (AC) motor, as shown in Figure 12, has been used to supply the flow of air to the system working section. The flow of air is controlled using an adjustable throttling valve mounted just at the mouth of the air intake. Since there is no need for any connection in the fan inlet, and the throttling valve being fully open to obtain maximum airflow rate, air delivered by the fan should have a uniform velocity profile with a minimum turbulence level. To get the required values of Reynolds numbers, the blower air velocity can be adjusted by varying the throttle valve and measured using an anemometer device.
Suction-type axial fan.
Data analysis
Simplified steps were used to analyze the heat transfer process for the airflow. The local heat transfer is given by equation (6) as follows

But

It should be noted in equation (7) that the tube heaters in the experimental setup are fixed to the wooden wall duct by ceramic material which is a very good insulator. Therefore, losses to wall duct are negligible and all the heat produced will be transferred to the air passing through the heaters.
The local heat transfer coefficient can be obtained from equation (8)


where


where
It should be noted that all the air properties are evaluated at the mean film air temperature

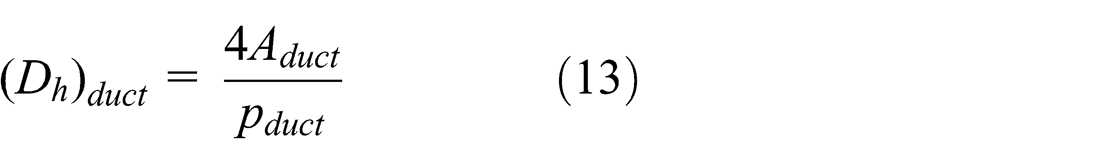
For this experiment, the hydraulic diameter of the duct

The average values of Nusselt number
The average values of the other parameters can be calculated based on the calculation of average tube surface temperature


Reynolds number and Prandtl number can be calculated using equations (18) and (19) as follows


All the air physical properties
The effectiveness is calculated according to equation (20)

Also, pressure drop ratio can be found from equation (21)

Error analysis
When attempting to correlate or compare experimental results with numerical simulations, it is imperative that the issues of errors and uncertainties are addressed. Here, the various sources for errors and uncertainties for the experimental work are identified. The summarized analysis of the experimental accuracy of measuring properties for some selected measuring devices is shown in Table 3.
Experimental accuracies.

Temperature accuracy is based on the individual measurement accuracies as well as a statistical analysis of a sample of temperature measurements. Errors in the flow and blower configuration, as well as errors in manometer readings, determine the accuracy of the volumetric flow rate. The sources of error, which comprise air velocity accuracy, were determined to be perturbation error, sensor orientation, and the sensor accuracy. 18
The general equation of uncertainty is given by

Therefore, the error in Nusselt number is calculated according to equation (22)

The relative error in Nusselt number is equal to
Based on equations (23) and (24), the results of uncertainty in Nusselt number (relative error %) of all the experimental data are given in Table 4.
Results of calculations of relative error percentage analysis of VG grid for Nusselt number.

VG: vortex generator; CCSVG: circle cross-sectional vortex generator; SCSVG: square cross-sectional vortex generator.
Results and discussion
Numerical results
A numerical study has been carried out for the 3D domain at Reynolds number {32,000 < Re < 83,000}. Air has been used as the working fluid in this study. Two shapes of the same cross-sectional area (CCSVG and SCSVG) are used and placed ahead of the heater set at two different positions (
Contour distribution of CCSVG presence ahead of heater set compared with the case of no VGs
Case (1): location of CCSVGs at distance Xd = 1 cm ahead of the heater set
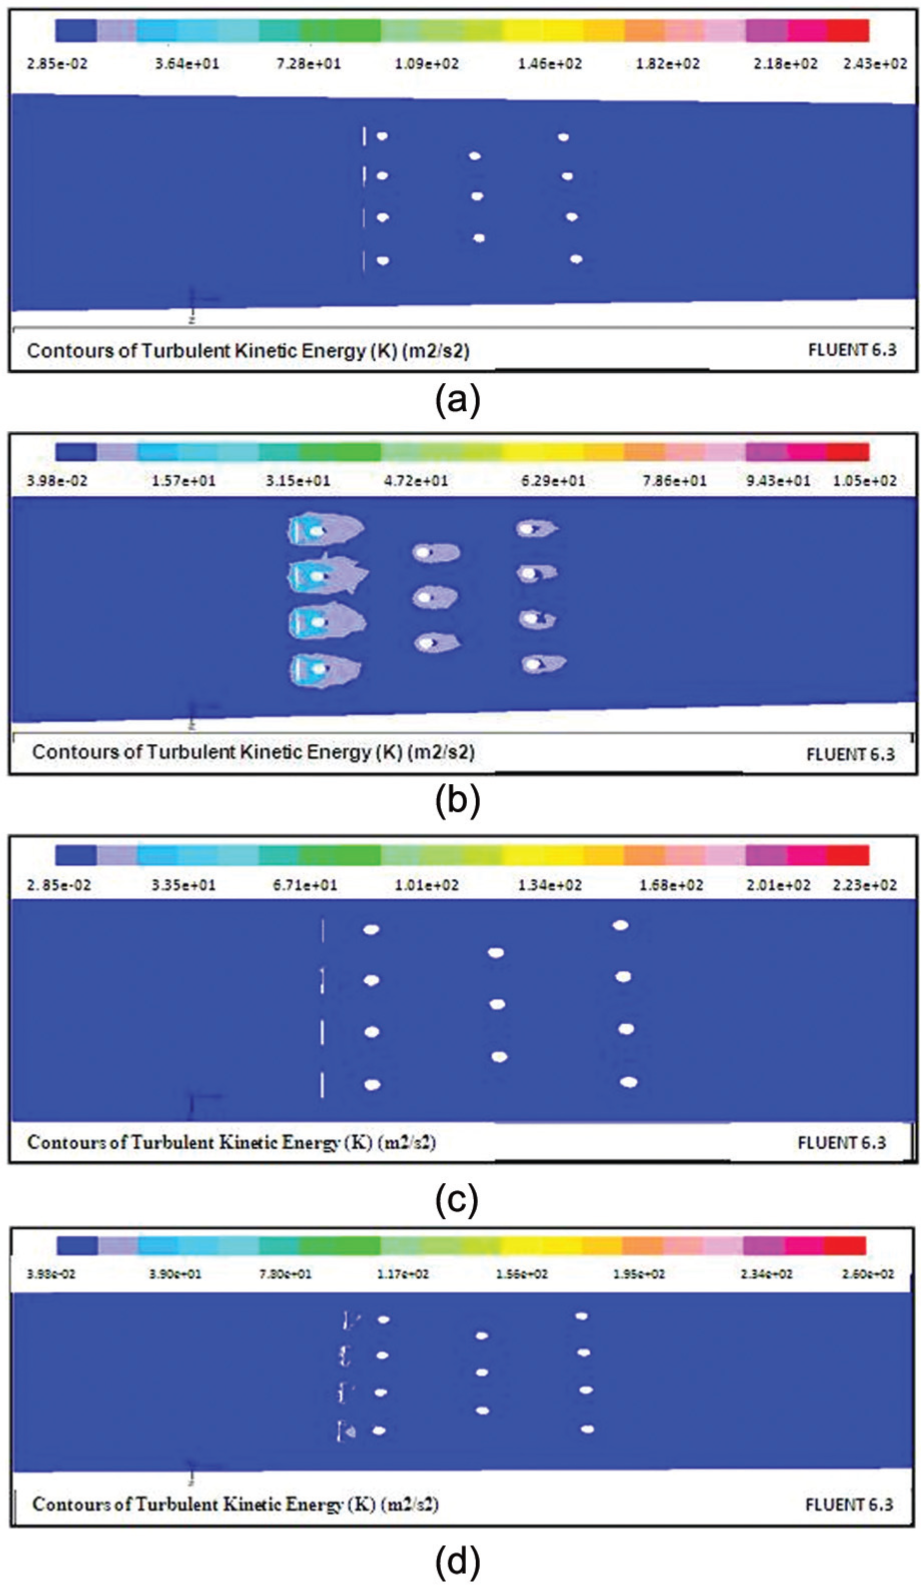
It was observed that the presence of CCSVG (Figure 14(a)–(e)) leads to a longer eddy lifetime, after the heater bank set, compared with the case of no VGs (Figure 13(a)–(e)) for all properties (dynamic pressure, total pressure, total temperature, and turbulent kinetic energy) at an inlet flow velocity of V = 4 m/s, except for the static pressure contour distributions for CCSVG (Figure 14(a)) after the first rows of the heater set are more regular than the case of no VGs (Figure 13(a)); also, a longer eddy lifetime was noticed.

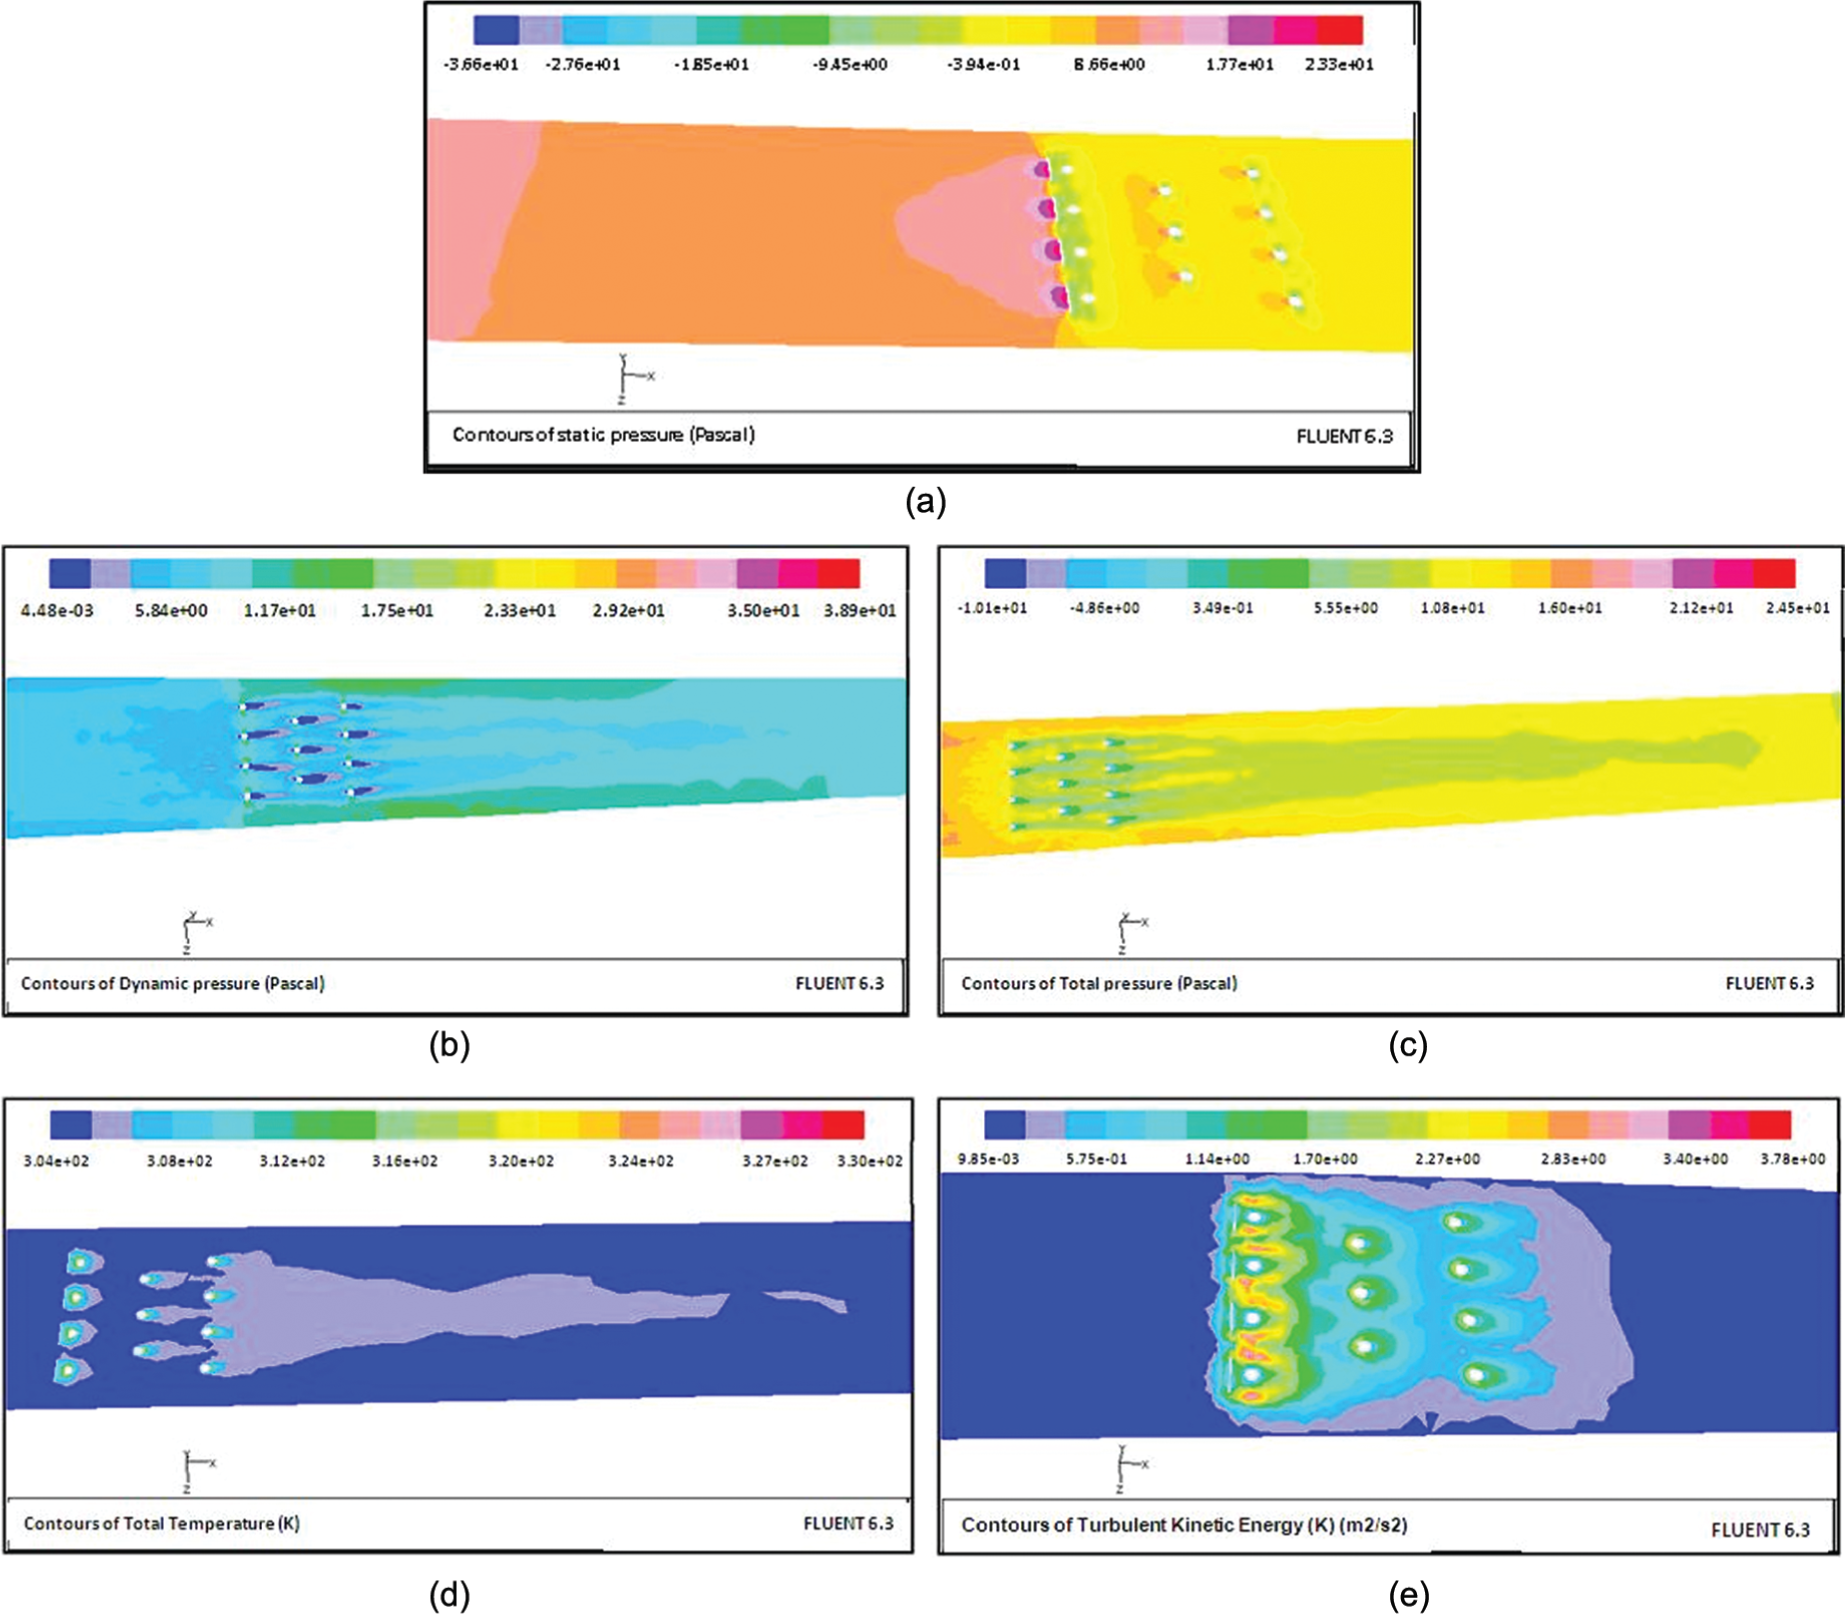
(a) Distribution of static pressure contours (without VG case at V = 4 m/s), (b) distribution of dynamic pressure contours (without VG case at V = 4 m/s), (c) distribution of total pressure contours (without VG case at V = 4 m/s), (d) distribution of total temperature contours (without VG case at V = 4 m/s), and (e) distribution of turbulent kinetic energy (without VG case at V = 4 m/s).
(a) Distribution of static pressure contours (CCSVG case at V = 4 m/s, Xd = 1 cm), (b) distribution of dynamic pressure contours (CCSVG case at V = 4 m/s, Xd = 1 cm), (c) distribution of total pressure contours (CCSVG case at V = 4 m/s, Xd = 1 cm), (d) distribution of total temperature contours (CCSVG case at V = 4 m/s, Xd = 1 cm), and (e) distribution of turbulent kinetic energy contours (CCSVG case at V = 4 m/s, Xd = 1 cm).
Similar trends of contours (not shown here for brevity) were found for the other inlet flow velocities of 8 and 10 m/s, except for static pressure contour distribution where the presence of VGs almost diminished after the last row of the heater set as shown in Figures 15(a), (b) and 16(a) and (b).

(a) Distribution of static pressure contours (without VG case at V = 8 m/s) and (b) distribution of static pressure contours (CCSVG case at V = 8 m/s, Xd = 1 cm).

(a) Distribution of static pressure contours (without VG case at V = 10 m/s) and (b) distribution of static pressure contours (CCSVG case at V = 10 m/s, Xd = 1 cm).
2. Case (2): location of CCSVGs at distance Xd = 2 cm ahead of the heater set
Similar behaviors and trends of contours distributions were observed for all properties (dynamic pressure, total pressure, total temperature, and turbulent kinetic energy) as for the case of Xd = 1 cm at the inlet flow velocities of 4, 8, and 10 m/s. Again, they are not shown here for brevity.
Contour distribution of the effect of SCSVG presence ahead of heater set compared with the case of no VGs
Case (1): location of SCSVGs at distance Xd = 1 cm ahead of the heater set
For the inlet flow velocity of 4 m/s case, the static pressure results showed that the formed eddies that appear after the first row of the heater set are more than those of other two rows of heaters (Figure 17(a)) and also for the case with no VGs (Figure 13(a)). The total pressure and turbulent kinetic energy in Figure 17(c) and (e) show that the formed eddies seem to have a shorter lifetime than that of no VGs (Figure 13(c) and (e)), while the contrary happened with dynamic pressure and total temperature contours whereby the presence of SCSVG as shown in Figure 17(b) and (d) led to a longer eddy lifetime especially after the last row of the heater set, with more regular distribution of pressure values than that in the case of no VGs shown in Figure 13(b) and (d). Furthermore, the presence of SCSVG showed that the turbulent kinetic energy contour distribution has no eddies near the wall (Figure 17(e)).

(a) Distribution of static pressure contours (SCSVG case at V = 4 m/s, Xd = 1 cm), (b) distribution of dynamic pressure contours (SCSVG case at V = 4 m/s, Xd = 1 cm), (c) distribution of total pressure contours (SCSVG case at V = 4 m/s, Xd = 1 cm), (d) distribution of total temperature contours (SCSVG case at V = 4 m/s, Xd = 1 cm), and (e) distribution of turbulent kinetic energy contours (SCSVG case at V = 4 m/s, Xd = 1 cm).
For the other two inlet flow velocities of 8 and 10 m/s, the contour behaviors of all properties are the same as for the velocity of 4 m/s case, except for the static pressure contours (Figure 18(a) and (b)) which were better noticed than the case of no VGs (Figures 15(a) and 16(a)) and had more eddy lifetime after the heater set than the case of 4 m/s (Figure 17(a)). Also, the turbulent kinetic energy contour distribution is hardly affected by the eddy formation as shown in Figure 19(a) and (b).

(a) Distribution of static pressure contours (SCSVG case at V = 8 m/s, Xd = 1 cm) and (b) distribution of static pressure contours (SCSVG case at V = 10 m/s, Xd = 1 cm).

(a) Distribution of turbulent kinetic energy contours (SCSVG case at V = 8 m/s, Xd = 1 cm) and (b) distribution of turbulent kinetic energy contours (SCSVG case at V = 10 m/s, Xd = 1 cm).
2. Case (2): location of SCSVGs at distance Xd = 2 cm ahead of the heater set
For the 4 m/s inlet flow velocity case, the results showed no big difference between the contour’ distribution of dynamic pressure and total temperature with the case of SCSVGs placed at Xd = 1 cm, except for the static pressure distribution (Figure 20(a)) which showed a longer eddy lifetime after the heater set than that of SCSVGs placed at Xd = 1 cm (see Figure 17(a)). However, the total pressure contours (Figure 20(b)) and turbulent kinetic energy contours (Figure 20(c)) show a longer eddy lifetime than that of SCSVGs placed at Xd = 1 cm (see Figure 17(c) and (e)).

(a) Distribution of static pressure contours (SCSVG case at V = 4 m/s, Xd = 2 cm), (b) distribution of total pressure contours (SCSVG case at V = 4 m/s, Xd = 2 cm), and (c) distribution of turbulent kinetic energy (SCSVG case at V = 4 m/s, Xd = 2 cm).
For the inlet flow velocities of 8 and 10 m/s, similar trends were found for dynamic and total pressure contours as for the case of SCSVGs placed at Xd = 1 cm. However, less eddy lifetime of total temperature contours was noticed for the location of SCSVGs at Xd = 2 cm (Figure 21(a) and (b)) compared with SCSVG presence at Xd = 1 cm (Figure 21(c) and (d)).

(a) Distribution of total temperature contours (SCSVG case at V = 8 m/s, Xd = 2 cm), (b) distribution of total temperature contours (SCSVG case at V = 10 m/s, Xd = 2 cm), distribution of total temperature contours (SCSVG case at V = 8 m/s, Xd = 1 cm), and (d) distribution of total temperature contours (SCSVG case at V = 10 m/s, Xd = 1 cm).
Furthermore, for the turbulent kinetic energy contours, eddy formation was noticed; only for the case of velocity at 10 m/s, Xd = 1 cm compared with other cases as shown in Figure 22(a)–(d).
(a) Distribution of turbulent kinetic energy (SCSVG case at V = 8 m/s, Xd = 1 cm), (b) distribution of turbulent kinetic energy contours (SCSVG case at V = 10 m/s, Xd = 1 cm), (c) distribution of turbulent kinetic energy contours (SCSVG case at V = 8 m/s, Xd = 2 cm), and (d) distribution of turbulent kinetic energy contours (SCSVG case at V = 10 m/s, Xd = 2 cm).
It can be concluded that the contour distribution of total temperature and turbulent kinetic energy showed an effect of VG presence on heat transfer performance for both cases of CCSVGs and SCSVGs compared with the case of no VGs. Also, eddy formation is different for different shapes of VGs. The vortex is a manifestation of the vortices generated in the separated shear layer at the leading edge of each VG and its interaction with the mean secondary flow from the lower to the upper side wall.
The vortex core is small and located in the close vicinity of the VGs at its origin near the lower side wall, and the growth of the vortex can clearly be seen behind each VG as they move in line with the secondary flow from the lower to the upper wall and impinge on the upper wall, thus enhancing the heat transfer in that region as shown in Figure 23(a)–(d).
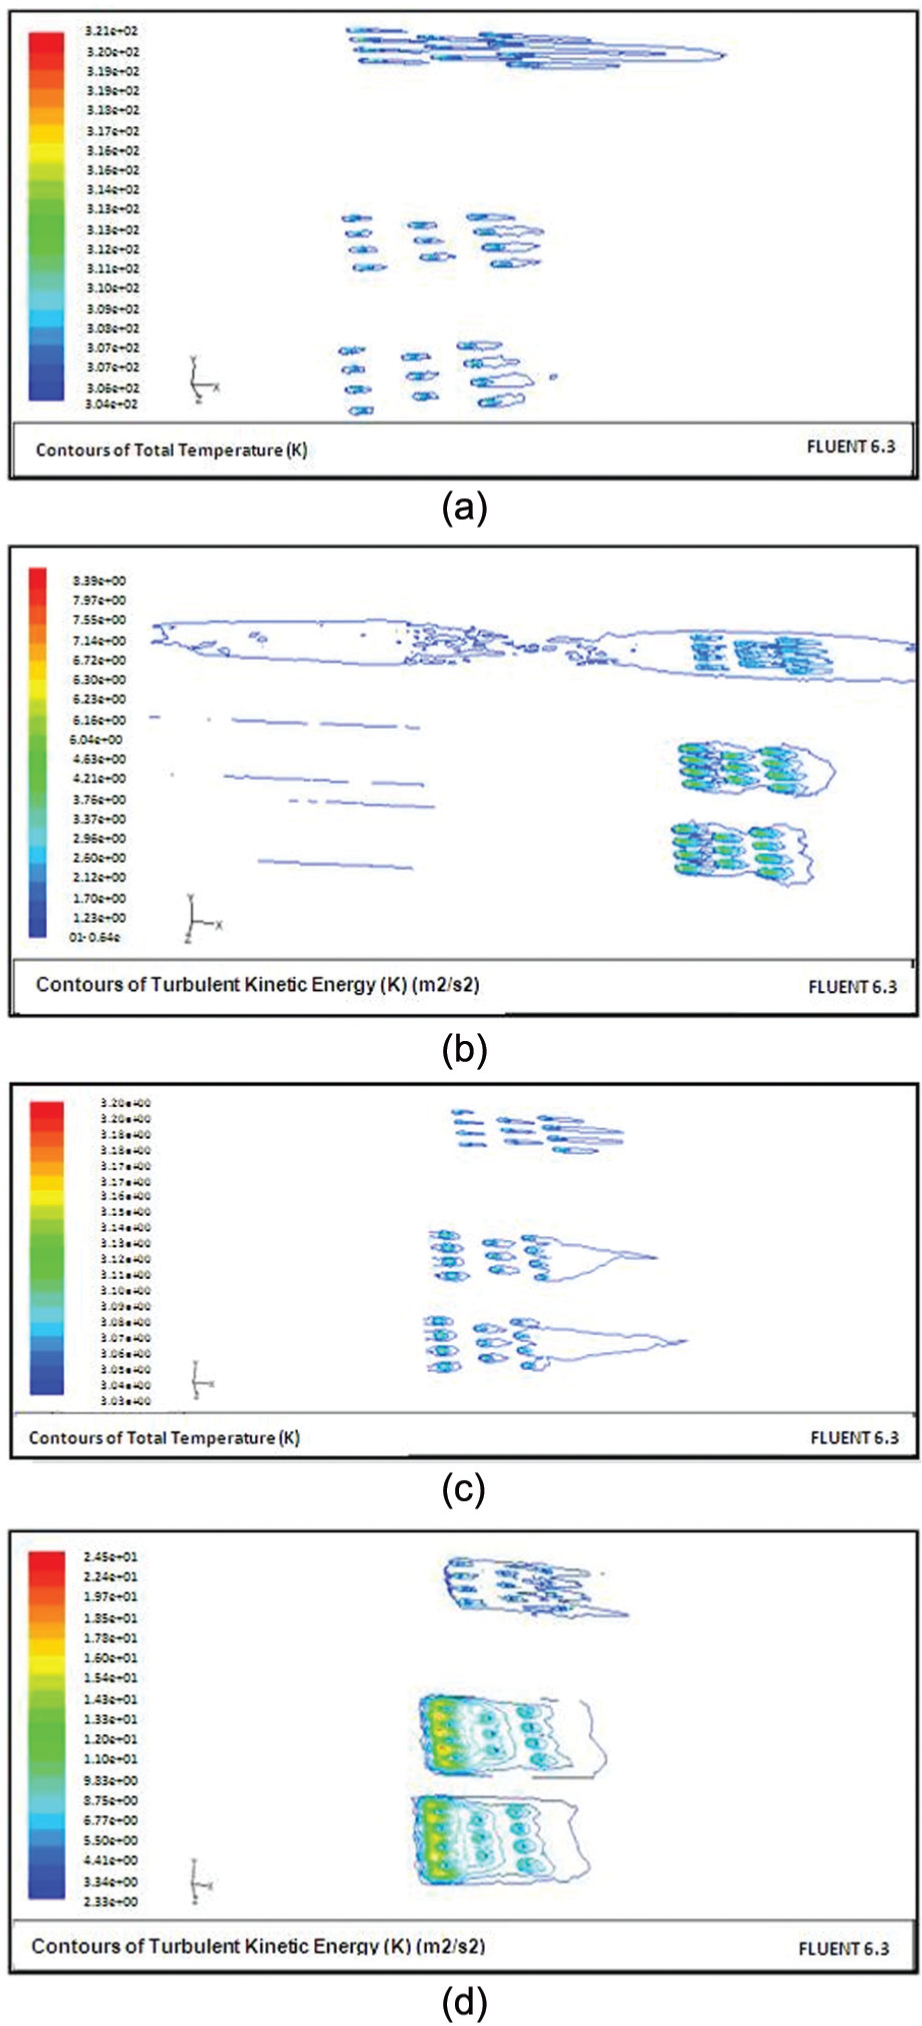
(a) Total temperature contour dissipation from the lower to the upper wall without VGs, (b) turbulent kinetic energy contour dissipation from the lower to the upper wall without VGs, (c) total temperature contour dissipation from the lower to the upper wall with CCSVG presence, and (d) turbulent kinetic energy contour dissipation from the lower to the upper wall with CCSVG presence.
Also, for all cases considered, eddies with the presence of VGs have a longer lifetime than the case with no VGs and cause the formation of longitudinal vortices and horseshoe vortices around the heaters. It can be noticed that the longitudinal vortices lead to the deformation of the temperature profiles in the flow channel and the temperature field has been influenced by the VGs. However, the variations in the temperature profile are due to the fact that the VGs are spreading gradually and lead to the mixing of fluid in the duct.
From the Fluent program, it can be concluded that the presence of VGs saves energy, also cools the test section, and produces a better mixing than the case of no VGs. It needs 27% of extra power (heat flux power) for the case without VGs to have the same outlet conditions as for the case with VGs. Varying the geometry of VGs resulted in the formation of longitudinal vortices and horseshoe vortices, and the sharp edges of SCSVG have more effect on heat transfer enhancement, which can be more noticeable at total temperature contours. For all cases considered, eddies produced would die out quickly with the increase in velocity flow (Reynolds number). Furthermore, the eddy lifetime would last longer when the VGs are placed at a distance of Xd = 2 cm rather than Xd = 1 cm.
Experimental results
An experimental study has been carried out at different Reynolds numbers based on the hydraulic diameter of the duct for different shapes of VGs. The location of the VGs was varied according to the longitudinal distance. In the experimental work, velocities of 4, 8, and 10 m/s were chosen in order to compare high flow (high Reynolds number with a minimum flow, minimum Reynolds number).
Temperature distributions
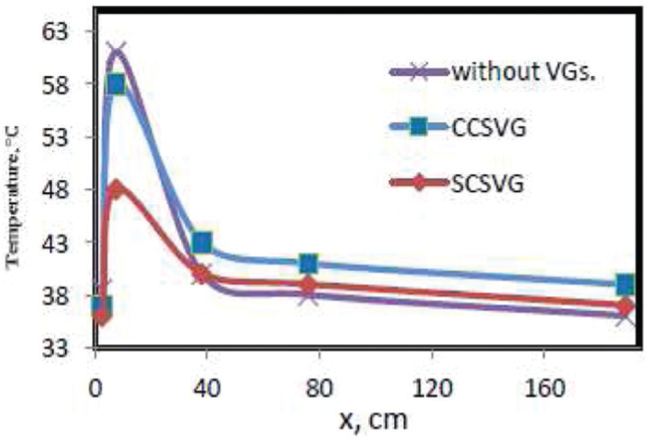
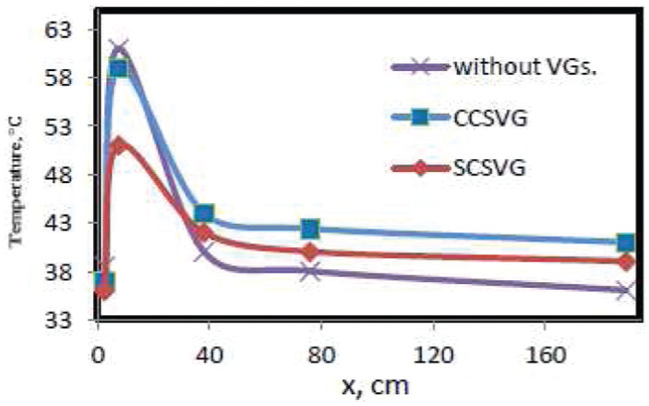
Figures 24–29 show temperature distribution along the duct for a flow without VGs and with the presence of CCSVGs and SCSVGs at different flow velocities of 4, 8, and 10 m/s. It can be noticed that the temperature profiles show similar trends for the three cases considered. The maximum temperature values are recorded in the duct for the case without the presence of VGs due to undisputed heat in the test section, followed by the CCSVG values, which are higher than those of the SCSVGs at distances of Xd = 1 cm and Xd = 2cm, respectively. The reason go back to the fact that the values of the maximum temperatures for both cases are affected by the formation of the longitudinal vortices and horseshoe vortices due to CCSVG and SCSVG presence and tube heaters, respectively. Also, the maximum temperature values are relatively lower when the velocity flow increases from 4 to 8 to 10 m/s, for the three cases considered.

Experimental temperature distributions along the duct at V = 4 m/s, Xd = 1 cm.

Experimental temperature distributions along the duct at V = 4 m/s, Xd = 2 cm.

Experimental temperature distributions along the duct at V = 8 m/s, Xd = 1 cm.

Experimental temperature distributions along the duct at V = 8 m/s, Xd = 2 cm.
Experimental temperature distributions along the duct at V = 10 m/s, Xd = 1 cm.
Experimental temperature distributions along the duct at V = 10 m/s, Xd = 2 cm.
The outlet temperatures and the temperature distribution curves for the three cases considered with the VG presence at distances of Xd = 1 cm and Xd = 2 cm have identical trends. However, CCSVGs showed the highest outlet temperature among all cases followed by the SCSVG, and finally the case without VGs. This means that the case with CCSVG presence is considered the best as higher outlet temperatures lead to higher Nusselt number.
It can be deduced from the above results that the benefit of adding VGs is to add turbulence to the air, where the heat is convected from the heaters and transferred into the fluid flow in the flow passage.
Nusselt number distributions
It can be seen from Figures 30 and 31 that Nusselt number increases with increasing Reynolds number as expected. This result is due to the formation of a horseshoe vortex system that consists of two counter-rotating longitudinal vortices, which improves the heat convection and hence heat transfer. Also, the enhancement of Nusselt number is associated with the corner vortex system, which is visible for the VG presence which is far from the tubes. The corner vortices of the nearer VGs coalesce with the main vortices of other VGs. As shown previously, Nusselt number increases by inserting CCSVG and SCSVG. The presence of VGs (CCSVGs and SCSVGs) gives a higher Nusselt number than the case without VGs for both distances of Xd = 1 cm and Xd = 2 cm, respectively. Also, higher values of Nusselt number are obtained at Xd = 2 cm compared with Xd = 1 cm.
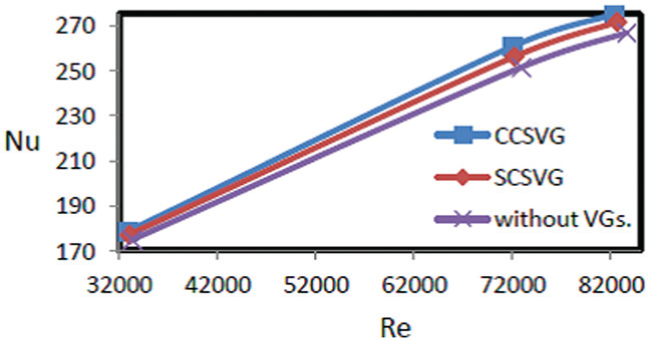
Nusselt number variation with Reynolds number at Xd = 1 cm.
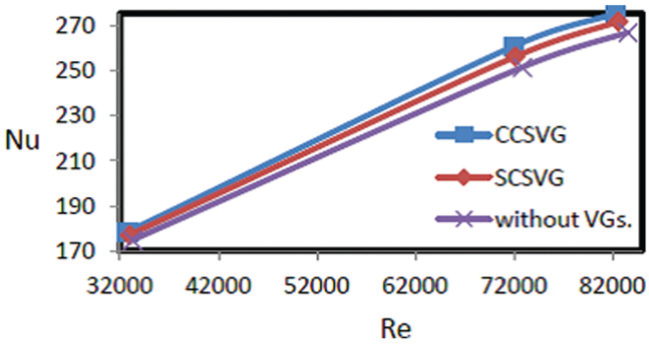
Nusselt number variation with Reynolds number at Xd = 2 cm.
The wave-like distribution of the local Nusselt number in the cross-flow direction is found. The heat transfer is enhanced near the centerline of the heater wall due to relatively higher velocity. The heat transfer is enhanced due to the strong longitudinal vortices generated by the presence of the LVGs so that the value of Nu decreases along the flow direction near the centerline, and far from the centerline, the value of Nu reverses. This is because the velocity near the centerline reduces and the longitudinal vortices generate behind the LVGs far from the centerline, and the distance between the cores of the vortices increases along the flow direction. This agrees with the work done by Tian et al. 11
Effectiveness distributions
Figures 32 and 33 show the experimental calculated results of the effectiveness variation with Reynolds number for CCSVGs and SCSVGs at two different distances of Xd = 1 cm and Xd = 2 cm. The trends are similar, but CCSVG shows higher values of effectiveness than SCSVG. Also, it can be noticed that the increase in effectiveness from a low Re = 32,000 at velocity 4 m/s to a maximum value at Re = 72,000 corresponds to velocity 8 m/s, and then effectiveness starts to decrease at highest Re = 82,000, corresponding to a velocity of 10 m/s. The results show that placing the VGs for both cases at location Xd = 2 cm gives better effectiveness than at location Xd = 1 cm. This may refer to the elongated eddy lifetime between VG rows and heater rows.

Effectiveness versus Reynolds number at Xd = 1 cm.
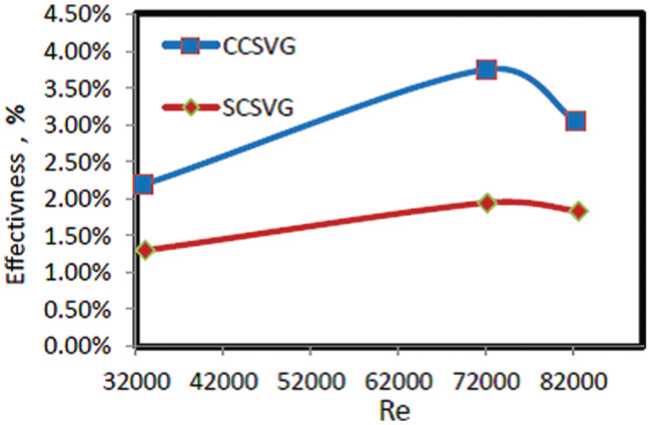
Effectiveness versus Reynolds number at Xd = 2 cm.
Pressure drop distributions
During the experimental tests, the pressure drop percentage values were calculated at different velocities (4–10 m/s) according to equation (21) for the two cases with VGs and without VGs as shown in Table 5.
Pressure drop percentage values for CCSVG and SCSVG of the same area for one row in y and z-directions.
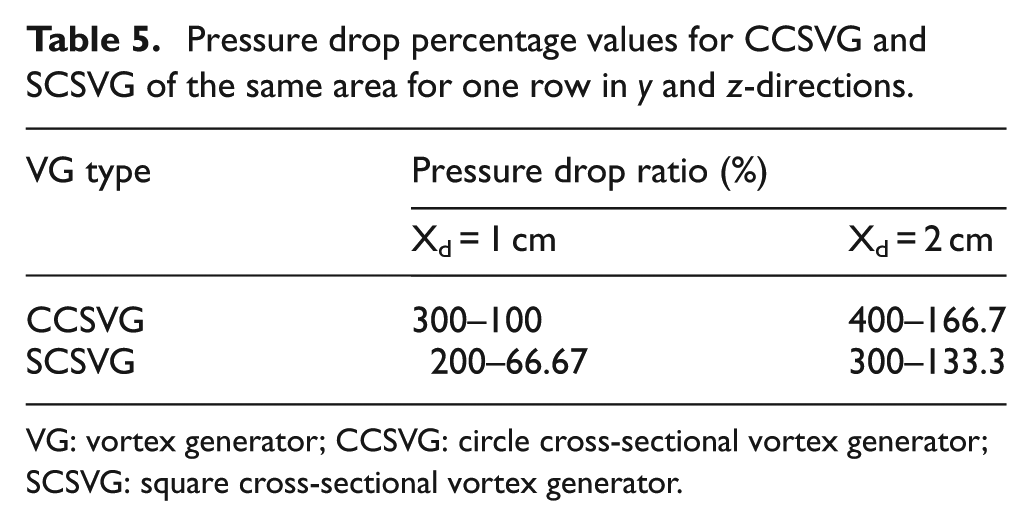
VG: vortex generator; CCSVG: circle cross-sectional vortex generator; SCSVG: square cross-sectional vortex generator.
It can be seen from Table 5 that the pressure drop values for CCSVGs are higher than those of SCSVGs. This is due to the edges of SCSVGs that affect the shape of vortice formation. Also, it is noticed that the increase in distance Xd between VG row and front heater row leads to the increase in pressure drop. Also, higher surface area and the action caused by the reverse flow can cause more pressure drop. Moreover, the pressure drop has a high possibility of occurring by the interaction of the pressure forces with inertial forces at the boundary layer. It is clear that the addition of CCSVG increases both the outlet temperature and pressure drop in the duct heater flow, and better results are obtained when the VGs are placed at Xd = 2 cm between VG row and front heater rows. This is due to high turbulence formed and longer lifetime of eddies.
Comparison between experimental and numerical results
The experimental and numerical results for the case of CCSVGs and SCSVGs at location Xd = 2 cm are chosen compared with the case without VGs. The results showed that the numerical values from Fluent gave a similar trend as experimental curves as shown in Figures 34 and 35. There are no big differences between the experimental and numerical solutions, but the little difference is due to the uncertainty of measurement devices used during experimental work that led to some error in reading tests.

Comparison between experimental and numerical results for total temperature distribution with duct length without VG presence.

Comparison between experimental and numerical results for total temperature distribution with duct length of one row of CCSVGs.
Correlation equations for Nusselt number with an error 2.6% for VGs are obtained as follows:
Arrangement without VGs

Arrangement for one row of VGs

For both cases (CCSVGs and SCSVGs), the general equation of this relation is given as

Conclusion
A numerical and experimental study for heat transfer in the duct heater using VGs of two different shapes (circular and square) of the same area in turbulent flow has been carried out. For the experimental study, an apparatus was set up to measure the pressure, velocity, and temperatures around the duct heater with constant heat flux. A numerical model based on Fluent package 6.3 is developed to solve the governing equations based on continuity, momentum, and energy using the (k–ε) turbulence model. The following points can be concluded for this work:
There is an effect of the shapes of VGs on heat transfer enhancement, temperatures, pressure drop, and velocity distribution. Good agreement between numerical and experimental studies for this work is achieved. The results show that heat transfer was enhanced by 2.186%−3.75% using circular type, and it enhanced by 1.3%−1.94% using square type.
The pressure drop at the outlet of the duct increases by 166.7%−400% when using circular VGs and increases by 133.3%−300% when using square VGs. These values were obtained for the velocity ranging between 4 and 10 m/s and when VGs were placed at location
The CCSVG shape is a better geometry for enhancing heat transfer than the SCSVG shape.
CCSVGs show higher pressure drop than that of SCSVGs. Also, CCSVGs show higher values of effectiveness
Heat transfer increases when the location of VG row ahead of the heater set increases from Xd = 1 cm to Xd = 2 cm.
Nusselt number increases when Reynolds number increases.
The presence of VGs (CCSVGs or SCSVGs) gives a higher Nusselt number than the case without VGs for both distances of Xd = 1 cm and Xd = 2 cm, respectively. Also, higher values of Nusselt number are obtained at Xd = 2 cm compared with Xd = 1 cm.
Fluent program results show that VG presence would save energy of about 27% compared with the case of no VG presence.
Footnotes
Appendix 1
Academic Editor: Chin-Lung Chen
Declaration of conflicting interests
The author(s) declared no potential conflicts of interest with respect to the research, authorship, and/or publication of this article.
Funding
The author(s) received no financial support for the research, authorship, and/or publication of this article.