
Abstract
This study proposes an efficient, cost-effective analytical methodology involving computational fluid dynamics for improving the performance of industrial-grade gas mask canisters. Computational fluid dynamics and the quadratic Forchheimer equation, used for calculating high momentum loss, were applied for analyzing the flow fields of six gas mask canisters. Streakline flow visualization and compression tests were conducted to determine the design performance. The results indicated that the designed honeycomb passageway in the canister demonstrated superior aerodynamics and structural loading to the original design. The honeycomb passageway design enhanced the flow rectification and increased the passageway sizes, improving the effective flow-through area and reducing the inhalation resistance. Finally, an improved prototype was produced based on the honeycomb passageway design. Aerosol penetration and hydrogen cyanide breakthrough tests confirmed that the improved prototype achieved a P100-level filter efficiency performance and maintained a 60-min breakthrough time. Without replacing the raw material, the inhalation resistance and absorbency of the improved prototype reduced by 46.48% and 33%, respectively, compared with the original canister.
Keywords
Introduction
Gas mask canisters used in air-purifying respirators primarily induce inhalation pressure drops. Gas mask canisters with chemical, biological, radiological, and nuclear (CBRN) functions and high-efficiency particulate air (HEPA)-grade aerosol particle filtration abilities typically comprise a filter layer (to filter suspended particulates) and an adsorption layer (to adsorb toxic gases). The characteristics of porous media used to produce these layers can cause considerable inhalation pressure drops in gas mask canisters. Inhalation pressure drops typically serve as an index for determining the performance of gas mask canisters. The National Institute for Occupational Safety and Health (NIOSH) 1 specifies that a standard canister’s pressure drop in respirators comprising CBRN gas mask canisters must be less than 50 mmH2O (approximately 490.6 Pa) at an inhalation rate of 85 L min−1.
In this study, Model A is an extant mass-produced industrial-grade CBRN canister with a filter capacity conforming to the NIOSH 42 CFR Part 84 standard. However, it is marred by its excessive weight (330 g) and high respiratory drag factor. An inhalation rate of 30 L min−1 corresponds to a pressure drop of approximately 200 Pa. Figure 1 shows the internal configuration of Model A. The main sieve diaphragm (involving a circular hole design) separates the filter and adsorption layers. The filter layer comprises a multipleated fold of melt-blown HEPA-grade media involving nonwoven. The adsorption layer comprises granular activated carbon adsorption layer material.
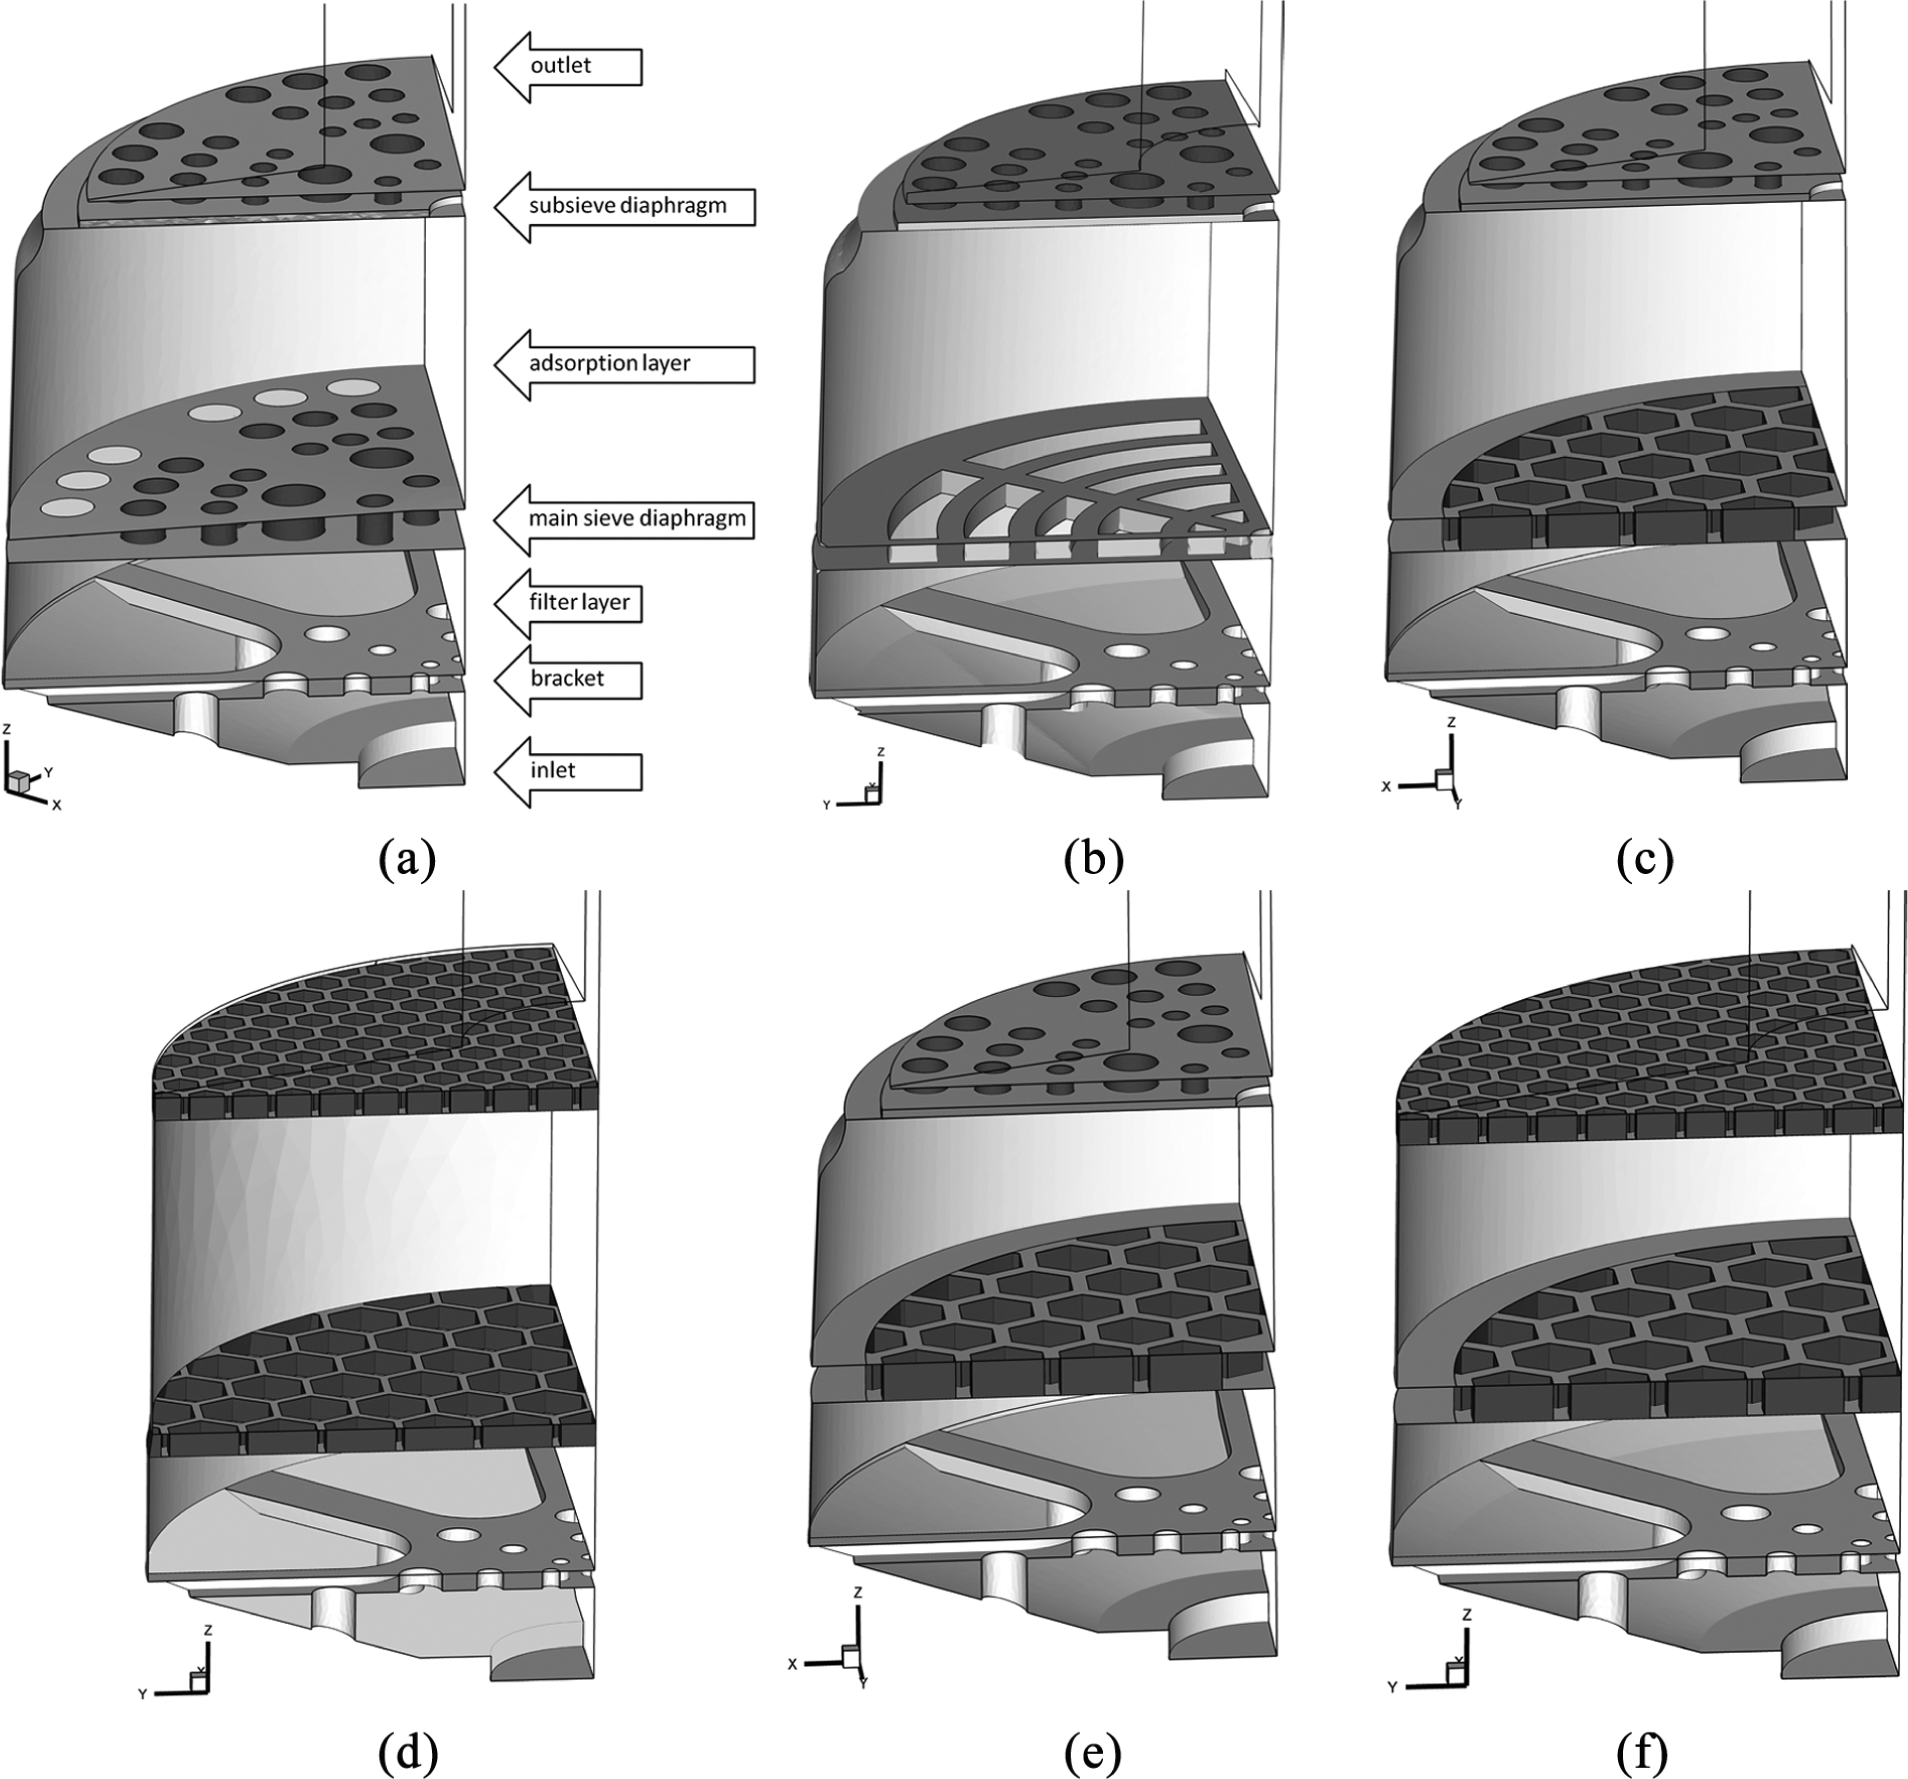
(a) Model A, (b) Model B, (c) Model C, (d) Model D, (e) Model E, and (f) Model F.
Assuming that the porous media constituting the filtration and adsorption layers are macroscopic and homogeneous, the medium characteristics can be analyzed using fluid dynamics, which can show a considerable momentum loss of a flow when moving through the porous medium. Darcy’s equation can be employed in situations involving laminar flow and only viscous effects 2
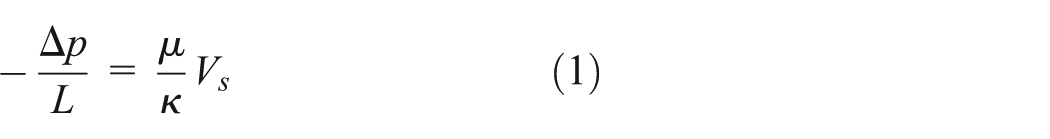
where Δp is the pressure drop of the porous medium zone, L is the flow direction length, κ is the permeability, μ is the fluid viscosity, and Vs is the superficial velocity of the fluid entering the porous medium zone.
When inertial effects are considered, inertial items are integrated into the equation. The corresponding modified equation is denoted by the Forchheimer equation 2

where α is the porous material’s reciprocal permeability (i.e. viscosity parameter) and β is typically called the inertial parameter. An increase in surface velocity induces a greater drop in pressure. The main factors influencing a drop in pressure include parameters α and β, both resulting from porous medium characteristics, and L and Vs .
The nondimensional form of equation (2) is

where
The drop in a gas mask canister’s inhalation pressure can be reduced using one of the two methods: (1) modifying the porous media parameters (α and β) by adjusting the absorbent formula or (2) modifying the passageway design within the canister to reduce the superficial velocity Vs and adsorption layer thickness L. Both approaches must comply with aerosol penetration and gas breakthrough inspection specifications. Because absorbent materials used in typical industrial-grade gas mask canisters are procured in bulk and would have already been subjected to (and passed) specification tests, developing a new formula is not cost-effective. If the passageway designs within gas mask canisters can be modified to reduce the weight and pressure drop without altering the absorbent material while meeting the requirements of relevant specification tests, then the efficiency of product development can be enhanced.
In addition to filtration function, aerodynamic characteristics are a primary consideration in modern porous media-based industrial products. Typically, previous studies proposing optimized designs according to minimal pressure drops have emphasized designing filters with multipleated configurations and investigating the multipleating effect on pressure drops and flow structures.4–20 Because of the high requirements for protection or respirator specifications, the inhalation pressure drops of CBRN gas mask canisters exceed those of general industrial-grade canisters. Thus, the aerodynamic behavior of low-pressure drops is crucial in designing CBRN gas mask canisters. For example, to ensure that the new-generation US military M50 respirator mask meets industry standards, research and development for the CBRN gas mask canister has been aimed at reducing both the canister weight and breathing resistance by 50%. Excessive inhalation resistance causes an increase in heart rate and oxygen consumption, resulting in physiological discomfort, which further influences work performance. Therefore, numerous studies have emphasized human factors and ergonomics by investigating the physiological characteristics of users;21–29 however, few studies have investigated the aerodynamic behaviors of gas mask canisters.
Li 30 determined that sealing the pores on the outside of the main sieve diaphragm induced aerodynamic deficiencies in Model A. These pores were sealed to prevent activated carbon particles from infiltrating the main sieve diaphragm through the adsorption layer during packing. However, this caused an uneven flow, producing local high-velocity preferential flow and dead zones that reduced the utilization rate of the adsorption layer. Thus, Li modified the distribution and size of the circular pores on the main sieve diaphragm to prove that a favorable passageway distribution and large passageway areas could effectively reduce the pressure drop, eliminate dead zones, and increase adsorption times. Nevertheless, Li examined only circular passageway designs. Although relevant indices were proposed for analyzing the aerodynamic characteristics of gas mask canisters, Li neither proposed an appropriate design for the main sieve passageway nor discussed the structure of the main sieve passageway and protective performance of the canister.
The research process in this article is based on the study of Li, 30 which involved analyzing the aerodynamic characteristics of the main sieve passageway design within gas mask canisters. Subsequently, industrial packaging techniques and processing convenience were considered in developing five conceptual gas mask canister designs (Models B–F, Figure 1). The main sieve passageways for these conceptual designs adopted either a rib-strip or honeycomb design. First, computational fluid dynamics (CFD) was applied to analyze the porous medium characteristics and factors causing substantial pressure drops in the adsorption layer. CFD was used because it enables achieving rapid model development and high accuracy and is suitable for flow-field simulations. Furthermore, inhalation pressure drop, inhalation resistance, Re′, effective flow-through area ratio, and air age indices were examined to determine the optimal passageway design. This study also analyzed the flow characteristics of the homogeneous porous media of the adsorption layer. Numerous tests were conducted on the optimal main sieve diaphragm design, including flow visualization, compression, aerosol penetration, and gas breakthrough tests, to confirm that the prototype reduced the canister weight and inhalation pressure drop.
This study’s objective was to apply CFD for improving canister passageway designs to reduce inhalation pressure drops. The designed prototype passed current aerosol penetration and hydrogen cyanide (HCN) gas breakthrough tests. In the future, the canisters will be combined with gas masks, and realistic breathing patterns will be incorporated to facilitate investigating the overall performance of gas masks.31–33
Problem
Governing equations
The continuity and momentum equations constitute the governing equations; both equations obey the conservation principle


where ρ is the gas density and
The air age equation is

where τ is the air age, μeff
= μl
+ μt
(μeff
, μl
, and μt
are the effective, molecular, and turbulent viscosities, respectively), and
Boundary conditions
The canister inlet maintained a steady inhalation flow rate for all simulations. Because the inlet area was fixed, the calculated mean velocity was specified according to the inlet boundary. The reference pressure (1 atm) at the inlet was constant. The outlet boundary condition was the pressure outlet boundary. The no-slip condition was assumed for all solid walls. For computational efficiency, only one-quarter of the full 3D model was constructed.
Numerical method
This study applied ANSYS (version 12.1.2) flow solver, which is based on the finite volume method. The integral form of the governing equations was discretized using an unstructured tetrahedral grid. The convection term was discretized using the first-order upwind scheme, and the viscosity term was discretized using a second-order central differential scheme. The semi-implicit method for pressure linked equation (SIMPLE) algorithm 35 was the solution algorithm for the pressure–velocity coupling; the related discretization algebraic equations were solved using the tridiagonal matrix algorithm (TDMA) method.
Grid configuration and research matrix
Because the filter layer material (polypropylene melt-blown nonwoven) is light and causes a considerably lower pressure drop compared with the adsorption layer (activated carbon granules), this study focused on the adsorption layer. To simplify the computational domain, the effect of multipleated filter paper was disregarded, and the filter layer was considered a single layer. The medium of the two porous layers was assumed to be homogeneous. A complex unstructured tetrahedral mesh with self-adaptive characteristics was adopted. Local grids for the inlet, outlet, sieve diaphragm, and adsorption layer were refined to accurately capture the flow patterns. The domain was divided into 23 subdomains, yielding approximately 830,000 grids for the prototype.
For all six models, CFD was employed to simulate the various passageway patterns of the primary and auxiliary sieve diaphragms and the exterior modifications (Figure 1).
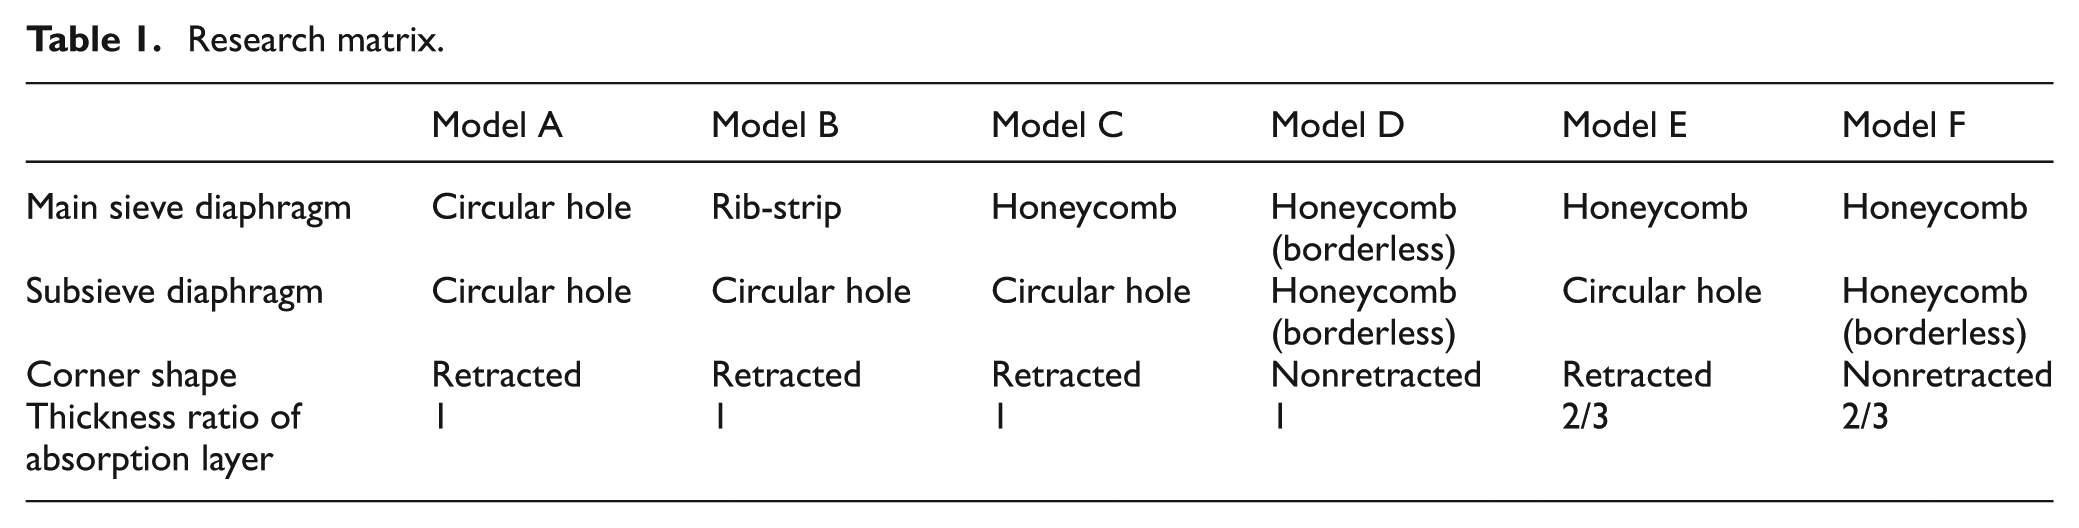
Furthermore, CFD was used to analyze the aerodynamic characteristics of the canister types under six distinct inlet conditions (15, 30, 60, 85, 110, and 135 L min−1). All the derived results were grid independent. The residual convergence threshold in all cases was less than 1 × 10⁻⁴. Table 1 shows the research matrix.
Research matrix.
Results and discussion
Porous medium characteristics
In this study, the characteristic coefficients for the porous medium in the gas mask canisters’ filter and adsorption layers were based on the coefficients used by Li 30 for analyzing the adsorption and filter layers in Model A. If the pressure difference and adsorption layer superficial velocity can be expressed as a typical quadratic equation, then

The flow rates can be expressed as the product of the velocity and actual flow area. Thus, the equation (7) can be rewritten as


If the inhalation resistance (R) is Δp/Q (Pa min L−1), the equation can be expressed as equation (9), where
Coefficients a 1 and a 2 are based on the characteristics and thickness of the porous medium, and coefficients b 1 and b 2 are related to the characteristics and thickness of the porous medium and the effective flow area in the porous medium. Thus, an excellent sieve diaphragm passageway design can increase the effective flow area, reduce the superficial velocity, and reduce pressure drops in the adsorption layer. When the porous medium characteristics are expressed using the Darcy equation, the inhalation resistance R is a constant (b 1), indicating that the flow area is unaffected by the increased inhalation rate. These results are consistent with the findings of previous studies.17,18 Moreover, expressing the porous medium characteristics as a quadratic equation shows that the inhalation resistance increases linearly with the flow rate, and that slope b 2 is inversely proportional to the square of the effective flow area.
When equation (3) is used to conduct relevant explanations, the straight line in Figure 2 represents the Darcy equation, indicating that the flow behavior is laminar. The curve in Figure 2 represents a quadratic Forchheimer equation, where f = 1/Re′ + 1; bifurcation is initiated in the range of 10−2 < Re′ < 10−1. The bifurcation between the straight and curved lines increases with Re′, indicating a strong inertial effect. In Model A, Re′ ranged from 1.8 × 10⁻² to 1.6 × 10⁻¹ when the inhalation rate in the filter layer was 15–135 L min−1, which is similar to that of a laminar flow. The Reynolds number interval of the adsorption layer was between approximately 4 × 10⁻² and 3.81 × 10⁻¹, signifying the presence of a substantial inertial effect at high inhalation rates. Furthermore, the Re′ and friction factors of Models A–F were compared using an inhalation rate of 135 L min−1 (Figure 2, bottom right). The results showed that the Re′ values (friction factors) for models with identical adsorption layer thicknesses, namely, Models A, B, C, and D, were 0.381 (3.623), 0.305 (4.283), 0.286 (4.499), and 0.257 (4.896), respectively. The results also indicated that the uniform passageway design and large passageway area in Model D reduced Re′ (weakening the inertial effects) and decelerated the superficial velocity Vs . Although the f value increased, the pressure drop in the adsorption layer declined with Re′ because Δp∝fVs 2. Although Models C and E demonstrated identical passageway patterns, Model E exhibited an increased Re′ and reduced f value compared with Model C, which exhibited a shortened flow length, accelerated superficial velocity, and strengthened inertial effect. Among the six models, Models D and F yielded a relatively low Re′, confirming that incorporating an optimal aerodynamic design without replacing the porous material reduced Re′ in the porous medium, mitigated the inertial effects in the fluid, and reduced the pressure drops. Because of the high momentum loss in the porous zones, the subsequently established passageway patterns of the main sieve and subsieve diaphragms dominated the flow structure in the porous medium area.

The f–Re′ relationship of the filter layer and adsorption layer of Model A; f–Re′ of the adsorption layer of Models A–F at 135 L min−1.
Adsorption layer aerodynamic characteristics
This section describes the analysis of the adsorption layer aerodynamic characteristics. According to the adsorption layer pressure drops between the main sieve and subsieve diaphragms in Models A–F, equation (2) was used to calculate the superficial velocity Vs and adsorption layer flow area for the various models at varying inhalation rates. Subsequently, the results were used to calculate the adsorption layer flow area, which was defined as the effective flow area Aeff . The ratio of this area to the adsorption layer cross-sectional area Ac was then derived and denoted as the effective flow area ratio Aeff /Ac (Table 2). Moreover, 1 − Aeff /Ac represented the dead zone area ratio. In Table 2, at 85 L min−1, the Aeff /Ac value of Model A was 66.29%; those for Models B and C were 82.08% and 87.55%, respectively. Model E, which had a smaller adsorption layer compared with Model C despite both having identical internal structures, registered an Aeff /Ac value of 84.49%. The Aeff /Ac value of Model E was inferior to that of Model C because of the smaller axial flow distance. Consequently, the exit velocity was relatively rapid, preventing the flow from expanding to the surrounding area to increase the flow area. The Aeff /Ac value of Model D was 97.33%, with a 1 − Aeff /Ac ratio of only 2.66%. This result indicated that incorporating the honeycomb design into the main sieve and subsieve diaphragm facilitated flow uniformity and increased the flow area, generating scanty dead zones. Furthermore, the Aeff /Ac value of Model F was 90.89%. Although the decreased thickness in Model F facilitated the pressure drop minimization, an increase in superficial velocity reduced the Aeff /Ac value. The Aeff /Ac value of Model A also decreased as the inhalation rate increased, demonstrating Aeff /Ac values of approximately 68.94% and 65.51% (a reduction of 3.43% points) at 15 and 135 L min−1, respectively. Model C yielded similar results, with a flow rate drop from 88.05% to 87.39%. Finally, Model D demonstrated an excellent passageway design, and the flow rate dropped from 97.39% to 97.29%, indicating that increasing the inhalation rate reduced Aeff /Ac only slightly.
Effective flow area ratio of Models A–F.

Figure 3 illustrates the velocity contours near the adsorption layer’s inlet, middle, and outlet sections for Models A–D; these contours were measured by introducing fluid through the sieve passageways and into the adsorption layer. The considerable loss in momentum reduced the fluid velocity, disrupting the radial flow. Therefore, the passageway area must be sufficiently large and uniformly distributed throughout the sieve. Because of the flawed design of the original sieve, the velocity contour near the inlet section of Model A exhibited localized high- and low-speed flows (Figure 3(b), top right). By contrast, the honeycomb passageway design, a no-margin design, demonstrated the most uniform velocity distribution (Figure 3(b), bottom left). However, margins are necessary in sieve designs for preventing absorbent material from dripping through sieve edges into filter layers, which may render the absorbent material ineffective. The margin width depends on the packaging technology. Because of the disrupted radial flow, the velocity discrepancies initially detected at the inlet section of the adsorption layer were also observed in the middle section extending toward the outlet section. Therefore, the main sieve passageway structure predominately controls the fluid structure within the adsorption layer. The honeycomb passageway design accommodates larger passageways, inducing a more uniform flow distribution compared with the circular passageway design. At a similar inhalation flow rate, such a design demonstrates a slower superficial velocity at the inlet section and a more uniform velocity profile throughout the adsorption layer compared with the other designs. Moreover, such a design is less prone to generating preferential flow and dead zones.

(a) Main sieve diaphragm, (b) velocity contour near the inlet section of the adsorption layer, (c) velocity contour near the middle section of the adsorption layer, and (d) velocity contour near the outlet section of the adsorption layer.
Air age analysis
Air age was used as an index to determine the adsorption time by observing the residence time of the gases in the adsorption layer. 30 Figure 4(a)–(f) depicts the air ages of Models A–F at 30 L min−1. In Model A, the defects in the original main sieve diaphragm passageway design produced large dead zone areas and local preferential flow and dead zones around the canister. These defective zones caused nonuniform air age distributions at the exit in the adsorption layer. The shortest air age at the exit was approximately 0.67 s, indicating that this location was the preferential flow area with the fastest flow velocity, and that toxic gases were most likely to breakthrough in that location. Compared with Model A, the rib-strip and honeycomb passageway designs in the main sieve diaphragms of Models B–D (having identical adsorption layer thicknesses to Model A) facilitated achieving a more uniform and even flow velocity at the adsorption layer entrance. As the passageway area increased, the flow velocity decreased. The canister retraction design produced dead zones at the adsorption layer exit (Figure 4(b) and (c)). However, these zones were substantially smaller than those observed in Model A. Model D exhibited a highly uniform age distribution (Figure 4(d)) because of the main sieve and subsieve diaphragm passageway designs and the nonretracted exit designs. The uniform flow in the adsorption layer reduced the production of preferential flow and dead zones. Thus, Aeff /Ac could reach a percentile of more than 97.33%. Figure 4(e) and (f) illustrates the air ages of Models E and F, indicating that although the adsorption layers were reduced, both models demonstrated a uniform air age distribution at the location because they shared a honeycomb passageway design in their main sieve diaphragms. Regarding the entrance, because the borders in the main sieve diaphragm were wider than those in the other models, the entrance velocity distribution was less uniform than that of Model D.

Air age contours for adsorption layer in (a) Model A, (b) Model B, (c) Model C, (d) Model D, (e) Model E, and (f) Model F.
Figure 5 depicts the air age at the exits of the adsorption layers in the six models, where the defective aerodynamic design of Model A is noticeable. The air age at the exit in Model A was shortened to approximately 0.67 s because of the local preferential flow, indicating that toxic gases had a propensity to breakthrough at this location. The air age in the dead zones in Model A was approximately 1.6–1.8 s, signifying that it would be difficult for toxic gases to flow through this area, which consequently consumed the adsorption material. When the main sieve diaphragm was solely transformed into the rib-strip and honeycomb designs, Models B and C yielded a more uniform air age distribution at the exit location compared with Model A, increasing their shortest air age at the exit location to 0.8 and 0.9 s, respectively. When both the main sieve and subsieve diaphragms and external configuration of the exit were modified, the shortest air age at the exit of Model D increased to more than 1 s, and the distribution was uniform. This phenomenon indicates that Model D exhibited a higher breakthrough time for poisonous gases compared with Model A. These results revealed that reducing the thickness of the adsorption layer reduces the pressure drop and canister weight and conserves the raw materials in the adsorption layer; this design strategy, however, reduces the effective flow area. Nevertheless, the key problem of reducing the adsorption layer is that the canister must maintain sufficient adsorption times to pass toxic gas breakthrough tests or experiments. An analysis of the air age distribution at the exit locations in Models E and F revealed that the shortest air ages of these models were 0.68 and 0.7 s, respectively, both of which are superior to that of Model A (0.67 s). These results indicated that although the adsorption layer thicknesses were reduced in Models E and F, the excellent aerodynamic designs of their passageways facilitated achieving adsorption times consistent with the testing standards for Model A.
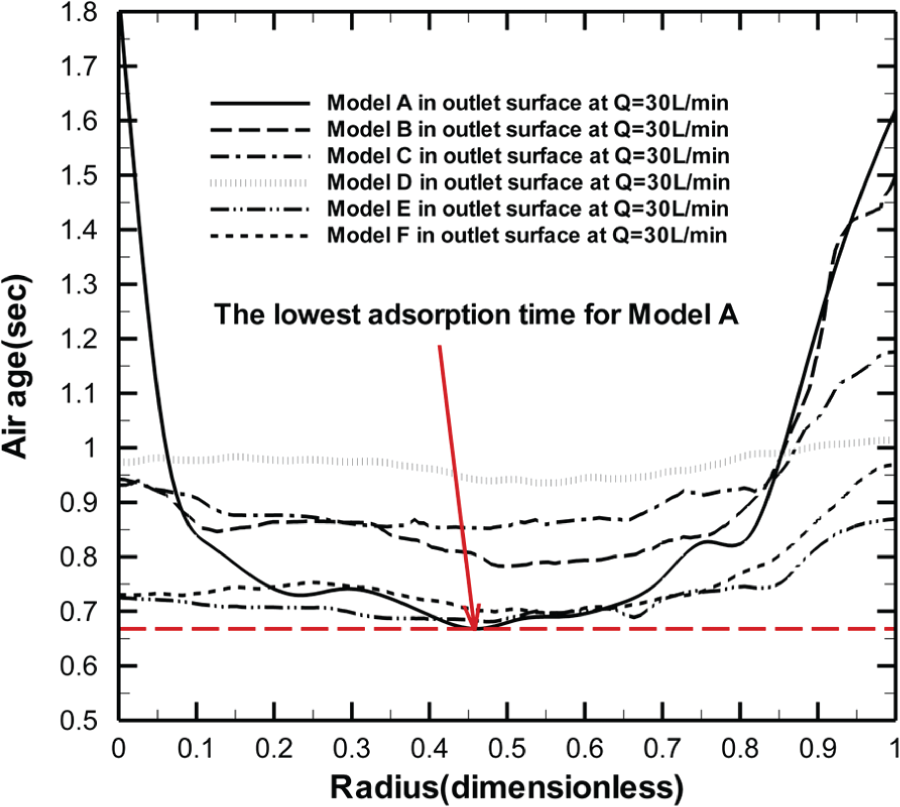
Air age distribution for Models A–F.
Overall pressure drop analysis
Table 3 lists the pressure drop and resistance values of Models A–F when subjected to common inhalation test conditions for gas mask canisters (i.e. 30 and 85 L min−1). Subsequently, Models A and C were compared. The main sieve diaphragms for these models included a circular hole design (Model A) and honeycomb design (Model C), where the passageway area for Model C was approximately 3.53-fold larger than that of Model A. Under the two inhalation conditions, the pressure drop for Model C decreased by 25.18% (at 30 L min−1) and 28.60% (at 85 L min−1) compared with Model A. These results indicated that using a honeycomb-type main sieve diaphragm (instead of a circular hole-type main sieve diaphragm) considerably reduced the canister pressure drops, further verifying that the main sieve diaphragm’s passageway design is a key factor minimizing canister pressure drops.
Pressure drop and resistance values of Models A–F at 30 and 85 L min−1.

Model D involved an ideal borderless design. Improved industrial sealing techniques were applied to further reduce the borders of the sieve diaphragm for increasing the passageway area and reducing pressure drops. Furthermore, the Model D subsieve diaphragm was modified to the honeycomb type, and the external configuration of the entrance and exit flow locations were adjusted to mitigate flow obstruction, reducing Model D’s overall pressure drop by 30.36% (at 30 L min−1) and 34.98% (at 85 L min−1) compared with Model A. A comparison of Models C and E, which possessed distinct adsorption layer thicknesses but identical internal passageway patterns, revealed an overall pressure drop of 470.13 and 381.15 Pa (both at 85 L min−1), respectively. Model E exhibited an 18.93% pressure drop compared with Model C, and this drop was attributed to its thinner adsorption layer. When the adsorption layer thickness decreased by 33%, the pressure drop in Models E and F further decreased by 42.12% and 46.48% (both at 85 L min−1), respectively, compared with Model A.
The aerodynamic effects of the subsieve diaphragms and modified canister exteriors for the various models were analyzed. First, Models E and F, exhibiting identical main honeycomb sieve diaphragms and adsorption layer thicknesses, were compared. The subsieve diaphragm of Model F was modified by fitting it with the honeycomb type, and the canister exit location was not retracted. The simulation results indicated pressure drop reductions of 381.15 and 352.45 Pa (both at 85 L min−1) for Models E and F, respectively; compared with Model E, the pressure drop in Model F reduced by 7.53%. In summary, the main sieve diaphragm’s honeycomb design primarily influenced the canister pressure drops because it increased the rectification and passageway area, reducing the pressure drops by 28.6%. Locally modifying the subsieve diaphragm and canister configuration further reduced the pressure drops by several percentage points. The overall pressure drops and resistance (R) in Models A–F were compared (Figures 6 and 7). Under inlet conditions of 15–135 L min−1, the P–Q plot for all models showed the quadratic effects of all models, and the R–Q plot demonstrated linearity. As the flow increased, the difference in pressure drops in Model A became more apparent compared with the other models. The R–Q plots for Models A–D (i.e. models having identical adsorption layer thicknesses) revealed that the resistance increased with the slope because the canisters’ aerodynamics deteriorated. Among Models A–D, Model D exhibited superior aerodynamic characteristics. Moreover, Model F was superior to Model E, despite them possessing identical thicknesses.
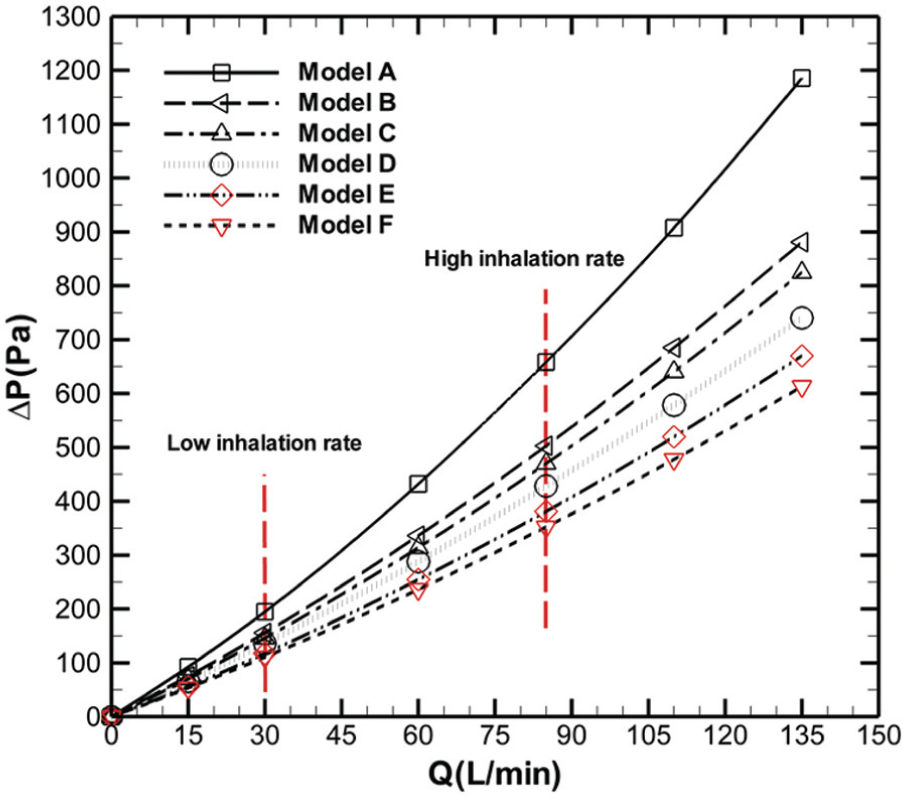
P–Q plots of Models A–F.

R–Q plots of Models A–F.
An optimal aerodynamic design for gas mask canisters must reduce the inertial effects in the adsorption layer at high inhalation rates. Indices suitable for measuring the optimization degree include the reduction of pressure drops, resistance, and Re′. Modifying the main sieve and subsieve diaphragms by incorporating a honeycomb design can substantially reduce the pressure drops in canisters. Moreover, the adsorption layer thicknesses in Models E and F further reduced the pressure drop level. This study subsequently investigated whether the adsorption layer thicknesses of the proposed models could maintain the original adsorption times.
Simulations and flow visualization
Flow visualization was conducted using the streakline technique for analyzing the empty canister flow characteristics of the honeycomb main sieve diaphragms. The results of the transparent honeycomb main sieve diaphragm model (Model C) indicated that compared with the original circular hole passageway design, the honeycomb passageway design demonstrated superior uniform flow distribution, fewer recirculation regions and, when used with the high momentum-loss adsorption layer, reduced preferential flow and dead zones at 30 L min−1 (Figure 8(a)). The empty canister visualization and CFD simulations returned highly similar results (Figure 8(b)–(e)). To prevent the detachment of the adsorption layer particulates, the borders on the sides of the Model C honeycomb main sieve diaphragm were widened slightly. The experimental results indicated that air was less likely to flow through this area, confirming that the materials in the adsorption layer would not be used, thereby creating dead zones. Thus, improving sealing techniques to reduce the diaphragm border widths can further facilitate achieving reduced dead zones and increased flow areas. Li 30 presents related experimental details.

(a) Flow visualization model (Model C), (b) experimental images of Model C, (c) simulation images of Model C, (d) experimental images of Model A, and (e) simulation images of Model A.
Main sieve diaphragm compression tests
Honeycomb designs enable achieving increased space through less material, equalized stress at all sides, and dissipated stress. Under similar stress conditions, components that adopt the structural principles of a hexagonal honeycomb design can be far lighter than those using other designs. Compression tests were conducted on two main sieve types, namely, sieves with a circular passageway design and those with a honeycomb passageway design. Both sieve types were manufactured using nylon and were tested using an MTS810 Material Test Machine. During the tests, stress was exerted on the sieves until an axial deformation or 1-mm displacement occurred, which rendered the sieves obsolete. The sieve involving the circular passageway design exhibited a bearing load of approximately 28.28 kN (Figure 9). By contrast, the sieve with the honeycomb passageway design demonstrated a bearing load of 74.77 kN. These results confirmed that the honeycomb passageway design increased the passageway size, minimized the material usage, and improved the bearing load.

Compression test of main sieves.
Aerosol penetration and gas breakthrough test
The aerodynamic design of the proposed canisters complied with aerosol and poisonous gas filtration standards and facilitated achieving reduced pressure drops. The NIOSH CBRN APR test standard indicates that canisters must be equipped with a P100 filter that filters aerosol sizes greater than 0.3 μm, demonstrates a 0.03% penetration rate (30 L min−1), and yields 99.97% filtration efficiency. Furthermore, gas breakthrough tests typically entail assessing the time consumed (i.e. breakthrough time) for a gas breakthrough at 0.5% concentrations (30 L min−1).
The polyalphaolefin (PAO) penetration and HCN breakthrough were tested to verify whether the proposed honeycomb passageway design of the main sieve diaphragm could pass the aerosol penetration and gas breakthrough tests. Model A (i.e. the original model canister) and Model E were used to verify whether the reduced adsorption layer thickness and aerodynamic behaviors of a honeycomb passageway design complied with the NIOSH standards. Model E was used because of its simple encapsulation process; only the model length and main sieve diaphragm required modification, exempting additional costs when producing a new shape. If the filtration ability of Model E complies with the standards, then Models D and F, which demonstrated comparatively superior aerodynamic behaviors, can also pass the penetration and breakthrough tests.
In the aerosol penetration test, PAO oil aerosols measuring 0.2 μm were adopted, and an automated filter tester (Model 8127; TSI, St Paul, MN) was employed. Table 4 shows the test results. At an intake of 30 L min−1, three aerosols were introduced to Models A and E, yielding a 0% penetration rate for both models. Subsequently, both the models demonstrated a 0.001% penetration rate at an intake of 85-L min−1, yielding a 99.999% filtration efficiency. Therefore, both models were P100 grade and complied with the 99.97% aerosol filtration standard, satisfying HEPA standards.
PAO aerosol penetration test results (Models A and E).

PAO: polyalphaolefin.
The gas breakthrough test is another key index for measuring the performance of CBRN canisters. In this study, the flame ionization method was executed using a flame ionization detector and HCN as the test gas. According to the 940-ppm HCN concentration standard, the breakthrough concentration was measured at 4.7 ppm or 0.5% concentration. The test period was segmented into 15-min increments. The breakthrough times for Models A and E were approximately 60.1 and 60.3 min, respectively, indicating that both models complied with the test standards within a 60-min timeframe. Figure 10 illustrates the breakthrough curves.

HCN breakthrough test results (Models A and E).
The breakthrough curve for Model A revealed that the gas concentration increased rapidly, whereas that for Model E showed that the gas concentration densified gradually because the main sieve passageway design in Model A facilitated preferential flow formation, consequently facilitating the gas breakthrough. The honeycomb passageway design uniformly distributed the flow, enabling the gas breakthrough concentrations to increase gradually. The breakthrough tests revealed that the breakthrough times for Models A and E were consistent with the air age results shown in Figure 5. According to the aerosol penetration and breakthrough test results, the proposed canister exhibited a highly effective internal passageway design, in which the aerodynamic characteristics of the design reduced the pressure drops, conserved the adsorption layer material, and maintained the performance of the original canister.
Conclusion
This article analyzes fluid dynamics in homogeneous porous media. The aerodynamic characteristics of several industrial-grade CBRN gas mask canister designs were determined using CFD, pressure drop tests, and streakline flow visualizations. Verification procedures comprised compression, aerosol penetration, and gas breakthrough tests. The objective was to reduce the inhalation pressure drop and weight of gas mask canisters without replacing the original porous media or compromising the performance of devices based on those designs.
In conclusion, the Forchheimer equation analysis revealed that reducing the fluid superficial velocity Vs entering the adsorption layer and adsorption layer thickness was crucial in reducing inhalation pressure drops. Other factors requiring consideration include the main sieve diaphragm strength and adsorption layer adsorption time. The findings of this study indicated that the passageway design of the main sieve diaphragm primarily influenced the inhalation pressure drop. The determined passageway design of the main sieve diaphragm subsequently dominated the flow structure in the porous media. Compared with the conventional circular passageway design, the honeycomb passageway design accommodated larger passageways and induced a more uniform flow profile. This prevented preferential flow and dead zones from occurring and simultaneously reduced the velocity and increased the adsorption layer flow-through area (absorbent utilization). The compression test confirmed that compared with the other design, the honeycomb passageway design exhibited a larger passageway size and stronger and more uniform bearing load in addition to conserving more material.
An increase in inhalation from 15 to 135 L min−1 is equivalent to the change in a human’s inhalation rate when shifting from rest to vigorous exercise states. This study’s analytical results indicated that a superior passageway design should not influence the absorbent utilization. At an inhalation rate of 85 L min−1, Model F demonstrated a 352.45-Pa intake pressure resistance, a 46.48% reduction from that of the original design (658.48 Pa). Several subsequent tests confirmed the presence of the flow rectification effect in the honeycomb passageway design flow structure. Furthermore, the breakthrough tests confirmed that the honeycomb passageway design performance reached specific test standards (i.e. 99.97% filtration efficiency, 60-min breakthrough time). The proposed analytical methodology can serve as a reference for research and development and facilitate reducing the cost and improving the performance of extant industrial-grade gas mask canisters.
Footnotes
Appendix 1
Academic Editor: TH New
Declaration of conflicting interests
The author(s) declared no potential conflicts of interest with respect to the research, authorship, and/or publication of this article.
Funding
This research was financially supported by the Ministry of Science and Technology under grant no. NSC 96-2221-E-606-020-MY2.