
Abstract
Leading-edge protuberances on airfoils or hydrofoils have been considered as a viable passive method for flow separation control recently. In this article, the hydrodynamic performance of a NACA 634-021 (baseline) foil and two modified foils with leading-edge protuberances was numerically investigated using the Spalart–Allmaras turbulence model. It was found that modified foils performed worse than the baseline foil at pre-stall angles, while the lift coefficients at high angles of attack of the modified foils were increased. Both the deterioration of pre-stall and the improvement of post-stall performance were enhanced with larger amplitude of protuberance. Near-wall flow visualizations showed that the leading-edge protuberances worked in pairs at high angles of attack, producing different forms of streamwise vortices. An attached flow along some valley sections was observed, leading to a higher local lift coefficient at post-stall angles. The leading-edge protuberances were considered as sharing a similar mechanism as delta wings, increasing nonlinear lift at large angles of attack. The specific stall characteristics of this leading-edge modification could provide some guidelines for the design of some special hydrofoils or airfoils.
Introduction
In recent years, leading-edge protuberance modifications on airfoils or wings have attracted extensive attentions as a new passive control technique.1–3 The idea was originally motivated by the physiological structures of humpback whales, 1 which are extremely agile and maneuverable especially when hunting prey despite their large sizes and rigid bodies. It was suggested by Bushnell and Moore 4 and further verified by Fish and Battle 5 that the agility of the whales is partially attributed to their pectoral flippers with leading-edge protuberances. It was also found that the mean cross section of the flippers has a profile similar to a NACA 634-021 airfoil, and the leading-edge profile along the spanwise direction can be approximated as a sinusoidal-wave shape. 5
The hydrodynamic performance of the humpback whale flipper models was experimentally tested by Miklosovic et al. 6 An increase in the maximum lift and the stall angle was found with protuberances at Re≈ 5.0 × 10⁵. The effects of the leading-edge protuberances on full-span foil performance have gained a lot of attentions since then. Johari et al. 7 carried out experiments on NACA 634-021 (baseline) and a series of modified hydrofoils with various protuberance amplitudes and wavelengths at Re = 1.83 × 10⁵. Better post-stall characteristics than the baseline foil have been discovered. However, the lift coefficients were lower in the pre-stall region and the drag coefficients were increased. According to Johari, the wavelength of protuberances and the leading-edge radius played minor roles in the force coefficients. On the other hand, the protuberance amplitude had a much more significant effect. Few flow details were provided due to the limitation of experimental measurements. Custodio 8 performed tuft and dye visualizations, finding that the spanwise flow between protuberances caused interactions between neighboring protuberances and generated a bi-periodic flow pattern, that is, the near-wall flow of every two protuberances forms a periodicity. A pair of counter-rotating vortices stemming from the leading edge was considered to help keeping the flow attached to the suction surface, similar to the effect of a delta wing. In a more recent technical report by Johari, 9 the effect of Reynolds number on a baseline and leading-edge modified NACA 634-021 was investigated. It was found that the stall angle, the angle of maximum lift, and the maximum lift coefficient of the baseline foil increased with Reynolds number up to 3.6 × 10⁵. By contrast, Reynolds number played only a minor role in establishing the lift and drag characteristics of the leading-edge modified foil. Zhang et al.10,11 measured the lift and drag forces of Johari et al.’s 7 8L airfoil within a wider range of angles of attack at Re = 5.0 × 10⁴ and 2.0 × 10⁵, finding significant improvement of aerodynamics performance when the angle of attack 16° < α < 70°. Particle image velocimetry (PIV) results revealed that the trough sections of protuberances played a primary role in the flow control. However, the bi-periodic flow patterns were not discovered or mentioned in Zhang et al.10,11 Full-span NACA 0021 and NACA 65-021 with leading-edge protuberances were tested by Hansen et al. 12 at Re = 1.2 × 10⁵. Similar lift and drag performances as in Johari et al. 7 were observed.
Numerical studies have also been carried out on the effects of leading-edge protuberances.13–17 The performances of the whale flipper models with and without protuberances at Re = 5.0 × 10⁵ were simulated by Pedro and Kobayashi 13 using detached eddy simulation (DES) method. It was found that the streamwise vortices induced by the scalloped leading edge could not only carry momentum into the boundary layer, delaying the trailing-edge separation, but also confine the leading-edge separation within the tip region. The Spalart–Allmaras turbulence model was applied by Weber et al. 14 to simulate the same objects, and acceptable accuracy was achieved. Flow field and aerodynamic forces of a two-dimensional (2D) airfoil with sinusoidal leading-edge protuberances were computed by Dropkin et al. 15 using the Spalart–Allmaras model at Re = 1.8 × 10⁵. Low-pressure pockets in the troughs were found persisting to high angles of attack, resulting in the continued increase in lift. The dynamic stall characteristics of airfoils with sinusoidal pitching motion were investigated by Cai et al. 16 The results indicated that the stability of force coefficients was enhanced with leading-edge protuberance at Re = 2.0 × 10⁵. However, few of the previous researches mentioned about the bi-periodic flow pattern experimentally shown by Custodio. 8 It is also important to note that in Cai et al. 16 and Gross and Fasel, 17 only one protuberance wavelength of spanwise domain length was considered during the simulations to save computing resources, which may not be appropriate if the bi-periodic pattern occurred.
Most previous research works on the effect of leading-edge protuberances on full-span foils have been focused on flows at relatively low Reynolds numbers (Re = 5.0 × 10⁴–5.0 × 10⁵). The influence of the protuberances on the lift and drag performances is basically similar, that is, improving the post-stall performance while sacrificing some pre-stall performance, for different baseline foils with different section geometries, thickness ratios, and leading-edge radii. Even so, there are still a lot of unknown problems about the effect of protuberances at low Reynolds numbers. Apart from whether the bi-periodic condition exists, the explanations for the performance variation have not reached a consensus and still need verification. The mechanism of the leading-edge protuberances has been compared to other devices such as vortices generators,6,10,12 delta wing,8,14,18 and wing fence. 13 In order to guide the application of the technique in the future, more quantitative investigations are necessary.
In this article, the Spalart–Allmaras model, which has shown pleasant results in relevant numerical researches,14,15,19 was applied to investigate the influence of leading-edge protuberance on the hydrodynamic performance of full-span hydrofoils at a low Reynolds number Re = 1.83 × 10⁵. Longer spanwise domain length than the previous research by the authors 16 was set, attempting to verify the bi-periodic flow pattern shown by Custodio. 8 On this basis, the flow details as well as their influences on the local and total foil performance were explored, and the mechanism of the leading-edge protuberances on flow control was discussed.
Numerical method
The baseline NACA 634-021 and the modified 4S and 4L foils from Johari et al.’s experiment 7 were chosen as the research objects. The three hydrofoils, shown in Figure 1, have a mean chord length c = 100 mm and a span of s = 200 mm. The modified foils have a sinusoidal leading-edge profile along the spanwise direction with the same wavelength λ = 0.5 c. Amplitudes A are equal to 0.025 c and 0.12 c for the two modified foils, respectively. The planform area of the modified foils equals the smooth leading-edge baseline foil. A 0.1-mm-radius fillet was placed at the trailing edge, following Weber et al. 14 For convenience, the three hydrofoils are named Baseline, Modified-S, and Modified-L, respectively.

Computational objects: (a) Baseline, (b) Modified-S, and (c) Modified-L.
The directions of inflow, foil lift, and spanwise were, respectively, defined as x, y, and z directions, as shown in Figure 1(a). The origin of coordinates is defined at the maximum thickness position of the hydrofoils (34%c from the baseline leading edge, see Figure 2). The width of the computational domain was equal to the foil span. Translational periodic conditions were applied along the z-axis direction, which means nominally 2D foil performance was investigated in this article without consideration of the effects of tip vortices. Figure 2 also shows the grid system near the Modified-S foil. The height of the first boundary layer around the foil was 0.02 mm, making the maximum y+ values below 5. The foil profile included 300 nodes, and the mesh around the leading and trailing edge was refined.
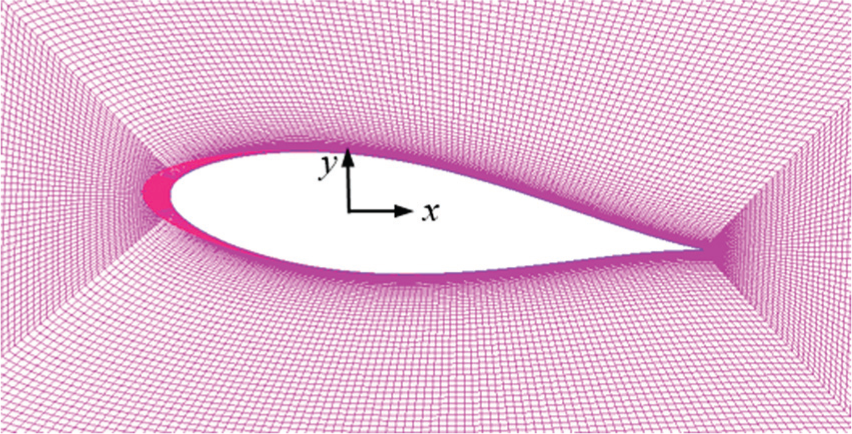
Mesh around the Modified-S foil at 6° angle of attack.
The mesh scheme was confirmed by a preliminary test of the mesh independence (Figure 3), including the Modified-S foil at 6° angle of attack and the Modified-L at 24°. The lift and drag coefficients are defined as follows

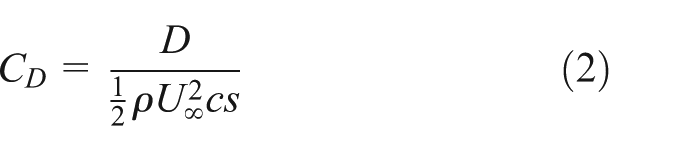
where

Force coefficient variation with mesh number. The solid points are the chosen computation mesh.
The computations were carried out in the software FLUENT. The governing equations were the Reynolds-averaged Navier–Stokes (RANS) equations with the Spalart–Allmaras turbulence model. The Spalart–Allmaras model is effectively a low Reynolds number model in its original form, requiring the viscosity-affected region of the boundary layer to be properly resolved (y +∼1). However, in this simulation, the Spalart–Allmaras model has been extended with insensitive wall treatment, 20 covering intermediate y+ values in the buffer layer (1 < y + < 30), which makes the current mesh suitable. The fluid was water and Re = 1.83 × 10⁵, following the experimental conditions. 7 The pressure–velocity coupling method was set as SIMPLEC scheme, and a second-order upwind scheme was applied in the spatial discretization. Velocity inlet and pressure outlet boundary conditions were specified.
Results and discussions
The calculated force coefficients of the three hydrofoils were compared with the experiments carried out by Johari and colleagues7,15 (see Figures 4–6). The foil span of Experiment 1 was 203 mm with four protuberances while for Experiment 2 was 305 mm with six protuberances. All the experimental subjects were located between the tunnel ceiling and a fence, thus making a nominally 2D condition.
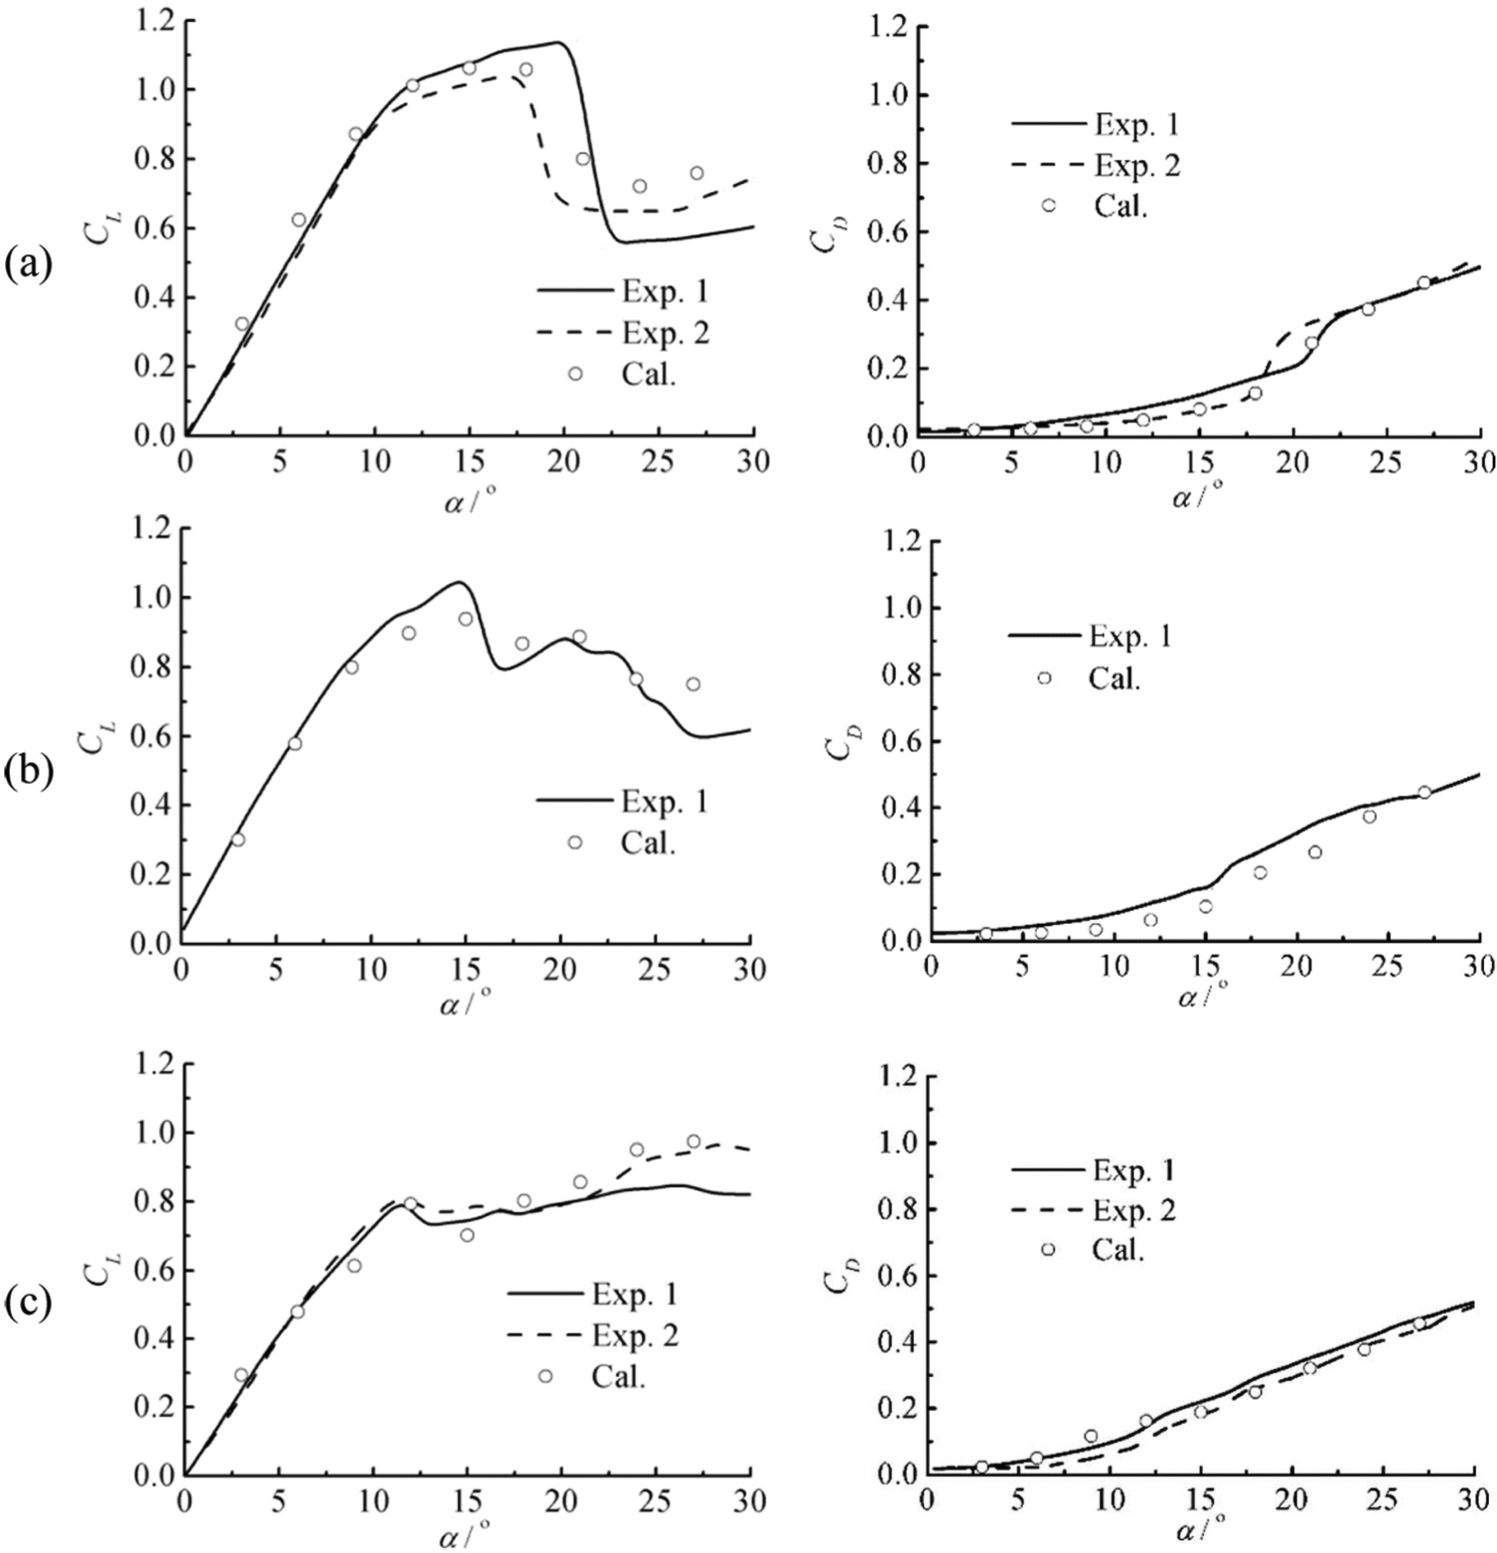
Force coefficient curves of (a) Baseline, (b) Modified-S, and (c) Modified-L foils. Left: lift coefficient; right: drag coefficient.
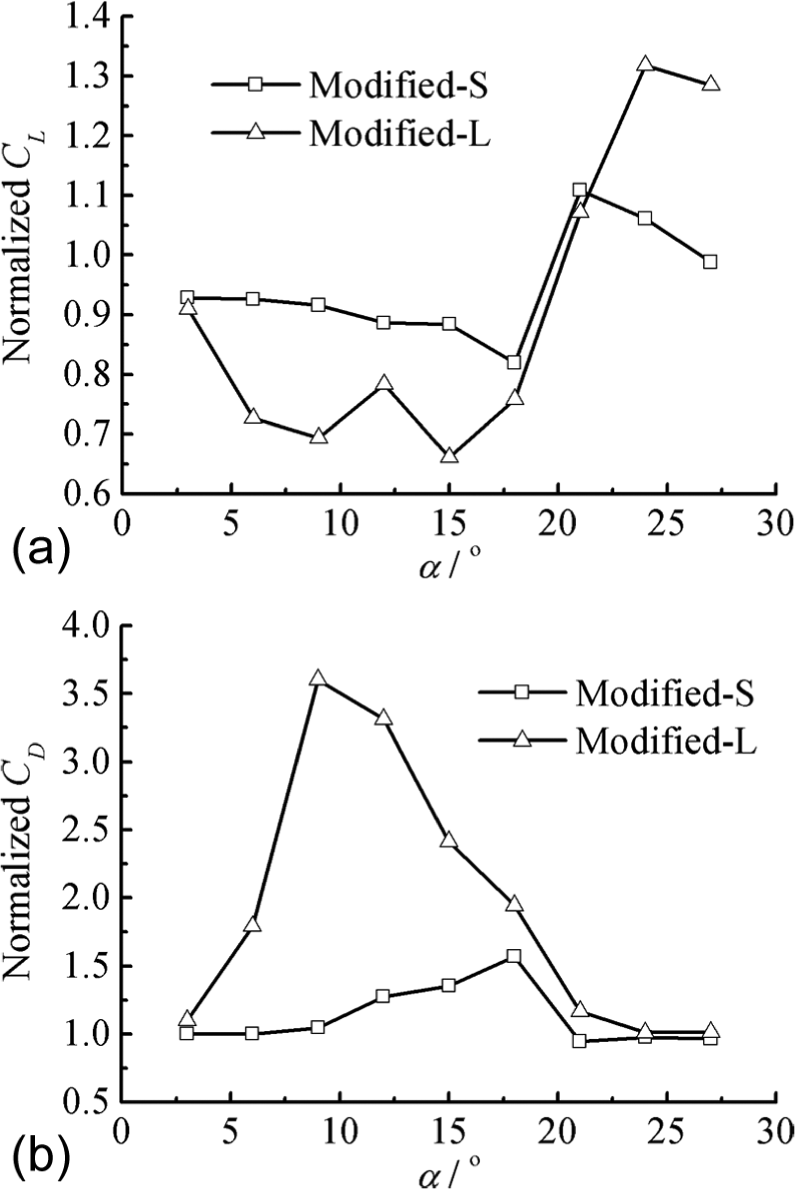
Force coefficients normalized by the corresponding baseline values: (a) lift and (b) drag.

Friction lines with pressure coefficient contour on the suction surface at (a) 6°, (b) 15°, and (c) 24°. Left: Modified-S foil; right: Modified-L foil.
Figure 4 shows the lift and drag coefficients of the three foils. For the Baseline foil (Figure 4(a)), the lift coefficient increases linearly from 0° to 12°, and the growth slows down from 12° to 20°. Stall occurs at around 20°, with a catastrophic loss in lift and large increases in drag. The numerical results fit well with the experiments, especially at the pre-stall region. The stall angle of attack and decline in lift have been well captured. However, the calculated lift coefficient at post-stall angles is a bit higher than the experiment. The reason may be the limitation of RANS method for the largely separated flow. 21 For the Modified-S foil (Figure 4(b)), the decline in lift coefficient occurs earlier at around 15°, but the tendency is much gentler. The drag coefficients are close to those of the baseline except for the stall-in-advance region (15°–21°). The numerical results also show a consistent trend with the experiment, while the lift in deep-stall region is also higher, as in the case of the Baseline foil. The performance of the Modified-L foil turns out differently (see Figure 4(c)). The lift coefficient increases with a smaller slope from 0° to 12° before a slight decline. And it keeps increasing within the range of calculation, showing a better post-stall performance. The drag coefficient keeps increasing nearly linearly.
Except for the different conditions of the two experiments, the difference of the lift coefficient at large incidences may also be due to the difficulty of the performance investigation at deep-stall condition. On a whole, the simulation results are closer to Experiment 2 with longer span, which may approximate 2D foil performance better.
In Figure 5, the calculated lift and drag of the modified hydrofoils normalized by those of the Baseline foil are plotted against the angle of attack. It can be clearly seen that the lift coefficient of the Modified-S foil is about 10% lower than the Baseline foil at pre-stall angles, but 10% higher past the stall angle. The drag is higher between 10° and 20° and almost the same in other regions. This modification changes the sharp stall characteristics into a mild one without much loss in pre-stall performance. Considering the Reynolds number in this investigation, it may be instructive for applications in fluid machinery such as small-scale wind turbines requiring insensitive stall characteristics, while active control system may be too complicated and expensive.
For the Modified-L foil, the pre-stall performance suffers a greater loss, with a 20%−30% decline in lift and increase in drag at the rate of several folds. However, the post-stall lift is increased by 30% while the drag varies little. The performance improvement at post-stall angles is inspiring, while the performance decline at pre-stall angles makes the current modification somewhat unpractical. The current modification would need further improvement if working as a passive control method. An idea of an active system has been proposed by Johari et al., 7 which can add the additional protuberances to the leading edge of a baseline foil only at post-stall conditions. The active control method can take advantage of the benefits and avoid the shortcomings of the large leading-edge protuberances.
The flow details of the Baseline foil have been discussed in preliminary work by the authors. 16 This article will focus more on the two modified hydrofoils. The flow feature of 6°, 15°, and 24° angles of attack was extracted, representing small angles, mild stall, and deep-stall region, respectively. Figure 6 shows the pressure contours on the suction surface along with the friction lines, which are considered as an important feature of three-dimensional (3D) flow separation. 22
At 6° (Figure 6(a)), a low-pressure pocket locates at each trough of the protuberance, leading to a higher adverse pressure gradient along the trough section. As a result, larger separation region can be observed than at the peak sections. The near-wall flow along the peak sections is attached and straight until approaching the trailing edge and then split to two sides. A couple of counter-rotating separation cells are formed on the suction surface of each protuberance. The pressure around the leading edge of the Modified-L foil is lower than the Modified-S, and larger separation on the suction surface can be observed.
At 15° (Figure 6(b)), different from 6°, the flow structures turn out to be bi-periodic spanwise for both foils. For the Modified-S foil, largest attached flow can be found on the valleys at the spanwise center and ends, with low-pressure pockets locating around the leading edge and friction lines converging from the neighboring peaks. Neighboring valleys reveal the opposite trend; largest separation is observed as a result of the near-wall flow moving away from the valleys and toward neighboring peaks. The Modified-L foil has early separation around all the valleys. However, friction lines extending from the neighboring peaks concentrate to an attached flow along the back of the valley section in the center of the hydrofoil. For the neighboring valley sections, the flows are totally separated, which lead to earlier deep stall for the local foil section. As a result, the overall lift coefficient of the Modified-L foil is much lower than the other two hydrofoils at 15°.
At 24° (Figure 6(c)), where the Baseline foil is in deep-stall condition, the near-wall flows of the Modified-L foil remain nearly the same as at 15°. The attached flows originated from the peaks converge on the valleys at the spanwise center and ends. The lift coefficient is enhanced through the preserved flow feature. The Modified-S foil, by contrast, is in deep-stall condition since the flow over the suction surface is almost completely separated. As a result, the lift coefficient is as low as the Baseline foil. Influenced by the complicated 3D separation flow, the friction line topology does not have spanwise periodicity as in the other cases.
In Custodio, 8 flow visualizations using tufts and dye were performed to examine the near-surface flow patterns surrounding the hydrofoils. Their results of the Modified-L foil at 24° (Figures 28 and 33 in Custodio 8 ) also exhibited bi-periodic flow patterns, and high similarity can be found with our current calculation shown in Figure 6(c). The flow is totally separated at some valley sections, indicated by the undulation in the tufts and diffusion of dye. At the neighboring peak section, the flow is attached with deflection toward Section III, leading to a converging tendency of tufts or dye stream at the other neighboring valley. The consistency with experimental visualization certifies the accuracy of our calculation again.
Figure 7 shows the 2D streamlines at 24° around the feature sections defined in Figure 6(c). The midsection of the Baseline foil is also demonstrated for contrast. The suction surface of the Baseline foil is in separated condition, with the main vortex attached to the vast majority of the suction side and a counter-rotating secondary vortex behind. Around Section I of the Modified-L foil, larger scope of separation can be observed. The center of the main vortex raises up and secondary vortex locates closer to the trailing edge. For Section II, the attached flow covers half the suction surface, forming counter-rotating vortex structures behind. The flow around Section III is quite different. Separation also occurs just past the leading edge. However, the divergence of flow from neighboring troughs leads to an attached flow along the rear of the suction surface.

Two-dimensional streamlines in different x–y planes at 24°: (a) midsection of the Baseline foil and (b–d) Sections I–III of the Modified-L foil.
In order to reveal the relationship between the local flow structure and the foil performance, the surface of each modified hydrofoils is divided into 40 slices along the span. Then, local lift and drag coefficients are, respectively, defined as


where

Local lift and drag coefficient distribution along the span at (a) 6°, (b) 15°, and (c) 24°. Left: Modified-S foil; right: Modified-L foil.
At 6° (Figure 8(a)), four periods of force coefficient can be observed along the span, which is defined as single-periodicity. A higher lift and a lower drag occur on the valley section, where low-pressure pockets locate, with larger separation region. The spanwise flow decreases the local lift according to the Kutta–Joukowski theorem. As a result, loss of lift can be observed for both modified airfoils, and more severely for the Modified-L foil.
At 15° (Figure 8(b)), except for the drag of the modified hydrofoil, the force coefficients show bi-periodic variations. The valleys near the center and side of the span show the best performance, while the neighboring valleys show the worst. It is interesting that each protuberance of the Modified-S foil shares a same drag distribution. It can be inferred that it is the pressure distribution around the leading edge but not the flow pattern on the suction surface that plays a primary role in the drag in this case. A remarkable loss of lift can be observed for the Modified-L foil, even for the region with highest lift. Therefore, the reason for the decline in hydrofoil performance may contain two parts. One is the stronger spanwise flow crossing a whole protuberance, leading to a total decline in lift. The other is the enlarged separation regions which give rise to local stall in advance, making the local performance poor.
At 24° (Figure 8(c)), the highest lift of the Modified-S foil appears at the center of the span, where attachment can be observed near the valley in Figure 6. The local lift at other positions is close to the Baseline foil, thus making the overall lift of the Modified-S foil only slightly higher than the Baseline foil. Neither single-periodicity nor bi-periodicity can be observed. Every four protuberances may form a full periodicity, which may be influenced by the number of protuberances configured for computation or experiment. A longer computational span would be helpful for further confirming the periodicity pattern. As to the Modified-L foil, the distribution regulation of local lift coefficient is very similar to 15° and the values are increased relatively. Most part of the span shows a better performance than the Baseline foil, which is in deep-stall condition.
In order to identify the periodicity of the lift distributions along the span, fast Fourier transform (FFT) analyses of the local lift coefficients against span position were performed. Data were periodically padded in size to meet the requirement of FFT. Figure 9 shows the results at two angles of attack. At 6°, the highest amplitude occurs at the spatial frequency 0.02 mm−1, which means one wavelength of the protuberance plays a dominant role in the lift distribution. Several higher order characteristic frequencies can be observed for the Modified-L foil, which may be due to larger difference between the 2D foil sections along the span. At 15°, the dominant spatial frequency changes to 0.01 mm−1, with larger maximum amplitudes compared to those at 6°. The dominant frequency implies that the lift distribution is mainly influenced by twice the wavelength of the protuberance, which corresponds to a bi-periodicity. The number of other characteristic frequencies increases especially for the Modified-L foil. The reason may be ascribed to local stall region and complicated spanwise interaction, leading to different mixing modes. As to the Modified-S foil at 24°, a smaller spatial frequency may be dominant, which will be verified through setting a longer computational span in further work.

FFT analysis of local lift coefficients distribution along the span at (a) 6° and (b) 15°.
Figure 10 shows the 3D vortex structure demonstrated by Q vortex identification criterion, 23 defined as
where


Iso-surface Q = 5 colored by streamwise vorticity of (a) Modified-S and (b) Modified-L. Left to right: 6°, 15°, and 24°. The arrows indicate the downwash or upwash velocity components induced by the streamwise vortices.
The vortex structure past the hydrofoils shown in Figure 10 primarily consists of two parts at 6° and 15°. One includes the separation vortices on the suction surface, and the other includes couples of counter-rotating streamwise vortices in the wake demonstrated by streamwise vorticity. At 6°, a couple of streamwise vortices exist behind each protuberance, which is consistent with the dominant frequency 0.02 mm−1 shown in Figure 10. At 15°, only two couples occur with larger region and higher streamwise vorticity, also corresponding to the dominant frequency 0.01 mm−1. At 24°, the separation vortices show a much more important role; thus, no wake vortex structure can be observed through the visualization criterion. At higher angles, the flow from neighboring protuberance has an interaction with each other and the raised separation vortices, leading to different forms of streamwise vortex couples in the wake.
The control mechanism of the leading-edge protuberances has been compared to vortices generators by researchers.6,10,12 However, it was pointed out by Van Nierop et al. 24 that the wavelength and amplitude of the protuberances are much larger than the scale of vortex generators. It was proposed that the pressure distribution on the wing is altered by the protuberances such that separation is delayed behind protuberance. Their result and mechanism were based on an aerodynamic theoretical model developed from the Prandtl lifting line theory, 25 which is also applied to estimate the foil performance with leading-edge protuberance by Rostamzadeh et al. 26 Here, the Prandtl lifting line theory is applied to explain the relationship between the flow structure and local hydrofoil performance gained through our simulation. An assumption is made that each 2D foil section at different span positions shares a similar lift performance as the Baseline foil: increasing linearly at small angles, decelerating at higher angles, and decreasing sharply at the local stall angle. The vortex pattern in the wake in Figure 10 indicates the presence of downwash and upwash. At 6°, a localized downwash component occurred at all the valley sections, according to the streamwise vorticity direction shown in Figure 10, leading to the decline in effective angle. Thus, the local lift coefficient is lower and drag is higher for the addition of induced drag. Analogously, an upwash component occurred at the valley sections, increasing the effective angle. As a result, the local lift coefficient is increased relatively and drag is lowered, adding the negative-induced drag. When the angle of attack is 15°, the streamwise vortices, which show a bi-periodic pattern, lead to an upwash component at the second and forth valleys. The effective angle is increased, which may go beyond the local stall angle, leading to an earlier stall and a lowest lift coefficient. Meanwhile, the effective angle of the valley at the spanwise center and side is decreased to keep away from the local stall angle; thus, a high lift and a low drag are shown.
Figure 11 shows the 3D streamlines around the protuberance of the Modified-L foil at 24°. Streamwise vortices can be observed on the left shoulder of the protuberance. The fluid with high momentum from the protuberance peak is attached and deflects toward the foil center, which help to increase the local lift (Figure 8(c)). The flow structures show a large similarity with the leading-edge vortex and axial flow inboard appeared on a delta wing, which is supported by other researchers’ opinions.8,14,18 It has been theoretically established that the lift slope of a delta wing is smaller than a rectangular wing, while the lift continues to increase to large values of angle of attack. The lift characteristic as well as the increased drag is very close to the modified hydrofoils with leading-edge protuberances. Therefore, it is believed by the authors that they share a similar mechanism, that is, increasing nonlinear lift at large angles of attack. However, as shown in Figure 11, the flows past the leading-edge protuberance are asymmetric, with large-scale separation vortices on the right shoulder of the protuberance. The axisymmetry breaking phenomenon may also occur on the leading-edge vortex of delta wings at large angles of attack, 27 which would lead to the decline in lift. Considering the similar near-wall flow structure of the Modified-L foil at 15° and 24°, the appearance of axisymmetry breaking may be responsible for the lift decline at pre-stall angles.

Three-dimensional streamlines around a leading-edge protuberance of the Modified-L foil at 24°. 1, streamwise vortices; 2, attached flow from the protuberance center; 3, large-scale separation vortices.
Concluding remarks
In this study, the hydrodynamic characteristics of two modified hydrofoils with leading-edge protuberances were numerically investigated and compared to the baseline foil. Although the lift coefficient of the modified hydrofoil is lower at pre-stall region, the stall performance is improved in different ways. The Modified-S foil with small amplitude of protuberances has an insensitive stall performance, while stall does not occur in the Modified-L foil until the angle of attack is up to 30°. However, the lift decline and drag increase at pre-stall angles of attack make the current modifications not practical. It may be instructive for the applications in fluid machinery such as small-scale wind turbines requiring insensitive stall characteristics, or an active control system, adding the additional protuberances to the leading edge of a baseline foil only at post-stall conditions, can be considered.
The flow visualization verified the bi-periodic near-wall structures above the suction surface within a range of angles of attack. The convergence of near-surface streamlines from neighboring peaks forms an attached flow along some valley sections, leading to a comparatively better local foil performance at post-stall angles. The streamwise vortices, which are similar to those induced by a delta wing, are considered as creating nonlinear lift, thus improving the post-stall performance. The Prandtl lifting line theory was proposed to explain the relationship between the local foil performance and the downwash or upwash component induced by the streamwise vortices. The results also implied that a big enough spanwise width is needed to gain a better description of the flow patterns around the leading-edge protuberance.
It should be noticed that our current simulation failed to capture the laminar separation bubbles at such a low Reynolds number and the complicated vortex shedding behavior. In order to investigate more deeply the mechanism influenced by the leading-edge protuberances, more advanced computational fluid dynamics (CFD) methods, such as DES or large eddy simulation (LES), need to be employed. However, the Spalart–Allmaras model, as is evaluated in this study, was proven effective for fast and qualitative analysis of the hydrofoil performance.
Footnotes
Academic Editor: Professor Gongnan Xie
Declaration of conflicting interests
The authors declare that there is no conflict of interest.
Funding
The authors would like to thank Beijing Key Laboratory of Carbon Dioxide Resource Utilization and Emission Reduction Technology for its financial supports on this research.