
Abstract
In order to improve the hydraulic efficiency, modern automatic transmissions tend to apply electric oil pump in their hydraulic system. The electric oil pump can support the mechanical oil pump for cooling, lubrication, and maintaining the line pressure at low engine speeds. In addition, the start–stop function can be realized by means of the electric oil pump; thus, the fuel consumption can be further reduced. This article proposes a method of applying two-pump system (one electric oil pump and one mechanical oil pump) in automatic transmissions based on the forward driving simulation. A mathematical model for calculating the transmission power loss is developed. The power loss transfers to heat which requires oil flow for cooling and lubrication. A leakage model is developed to calculate the leakage of the hydraulic system. In order to satisfy the flow requirement, a flow-based control strategy for the electric oil pump is developed. Simulation results of different driving cycles show that there is a best combination of the size of electric oil pump and the size of mechanical oil pump with respect to the optimal energy conservation. Besides, the two-pump system can also satisfy the requirement of the start–stop function. This research is extremely valuable for the forward design of a two-pump system in automatic transmissions with respect to energy conservation and start–stop function.
Keywords
Introduction
Conventional automatic transmissions have bigger power loss than manual transmissions. Manufactures of automatic transmissions have been trying to solve this problem using high-efficiency components or new structure design with less drag torque.1–6 One big part of power loss comes from the mechanical oil pump (MOP). In order to ensure that the mechanical system has sufficient lubrication and cooling at low engine speeds, the displacement volume of MOP is usually designed big. However, it causes excessive oil flow and big power loss at high engine speeds. Therefore, modern automatic transmissions tend to reduce the size of MOP and use an electric oil pump (EOP). The oil flow of EOP can be controlled to improve the pump efficiency. In addition, EOP can help to realize the start–stop function which can further improve the vehicle fuel economy.
In recent years, many new automatic transmissions start applying EOP in their hydraulic system.7–10 The EOP is designed for the start–stop function. Meanwhile, it is used to support the line pressure and supplement the oil flow for lubrication and cooling at low engine speeds. A two-pump system with two EOPs is designed to improve the efficiency and performance of a six-speed automatic transmission. 11 Some control algorithms are developed for the EOP control of a two-pump system.12–14 They try to reduce the energy consumption of the two-pump system. High-efficiency EOP and MOP have also been developed and applied in automatic transmissions.15,16 Ahlawat et al. 17 analyzed the effect of different pumps on fuel economy of a dual-clutch transmission vehicle. Through modeling and simulation, it is suggested to apply a two-pump system (one EOP and one MOP) in this dual-clutch transmission.
Some of the above studies integrate the EOP into the existing transmission structure. Some try to reduce the energy consumption by optimizing the control algorithms or the design of the pumps. However, these studies do not involve the way to determine the size of EOP and MOP for optimal energy conservation. The best combination of the size of EOP and the size of MOP with respect to energy conservation is usually difficult for engineers to figure out.
This article develops a method to deal with this issue using an eight-speed automatic transmission in mass production as studying object.18,19Figure 1 shows its two-dimensional structure. A detailed mathematical model is developed to calculate the power loss of the transmission. A leakage model is developed to calculate the leakage of the hydraulic system. The flow requirement can be calculated by these two models for the two-pump system in the forward driving simulation. A flow-based control strategy for the EOP is developed. Different combinations of MOP and EOP result in different energy consumptions. They are investigated through the simulation of various driving cycles. Results show that there is a best combination for the two-pump system with respect to energy conservation. The start–stop function also has a requirement for the two-pump system. Finally, the prototype is tested on the vehicle. It is proved that the developed two-pump system and the flow-based control strategy can satisfy the flow requirement of the eight-speed automatic transmission.

Two-dimensional structure of an eight-speed automatic transmission.
Power loss model
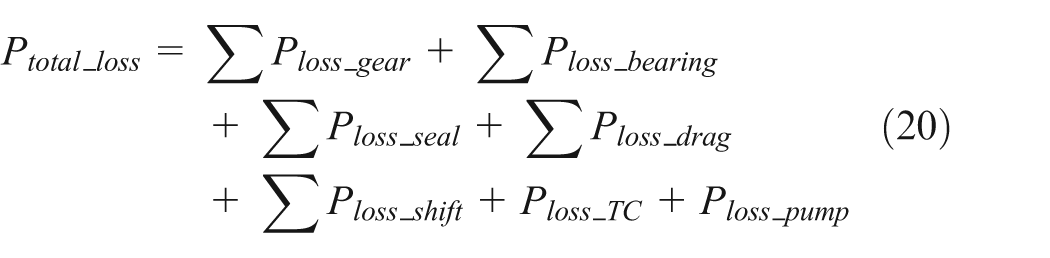
The power loss of an automatic transmission includes mechanical loss (gear, bearing, seal, shifting loss, and drag torque loss of the open shifting elements), hydraulic loss (torque converter and MOP), and electric loss (electric power demand for the solenoids, sensors, transmission control unit, and EOP). The power loss transfers to heat which must be dissipated by the transmission housing and the oil. The necessary oil flow for cooling is at the expense of the hydraulic loss (from MOP and EOP) and the electric loss (from EOP). In this section, the power loss of the eight-speed automatic transmission is calculated. Then, the necessary oil flow for cooling can be known based on the calculated power loss.
Gear meshing loss
As shown in Figure 1, this eight-speed automatic transmission has three planetary gear sets and four transfer gear sets. The mechanical power transferred by a planetary gear set can be divided into two parts. 20 One part is known as “coupling power” which has no losses because there is no conversion of torque and speed. The other part is called “rolling power” which is a result of relative speed between the central gears (sun gear and ring gear) and the carrier. This power generates losses in the rolling teeth and the planetary bearing. The calculation of rolling power for each part of a planetary gear set is expressed by equations (1)–(3)


The sum of these three powers is just the loss of a planetary gear set (4)

where TS, TR, and TC are the torques of the sun gear, ring gear, and carrier, respectively; ωS, ωR, and ωC are the angular speeds of the sun gear, ring gear, and carrier, respectively; and PRS, PRR, and PRC are the rolling powers of the sun gear, ring gear, and carrier, respectively. Equations (1)–(3) also apply to a transfer gear set. TS and TR can be replaced by the torques of the pinion and the wheel. The carrier can be assumed to be the housing with its angular speed ωC being 0. The loss of the planetary gear set is mainly a torque loss. It can be calculated based on the kinetics of the planetary gear set (5)

where i0 is the standard gear ratio, η0 is the efficiency factor of a planetary gear set with motionless carrier, and w defines the direction of the power flow. The efficiency factor η0 includes two parts according to equation (6)
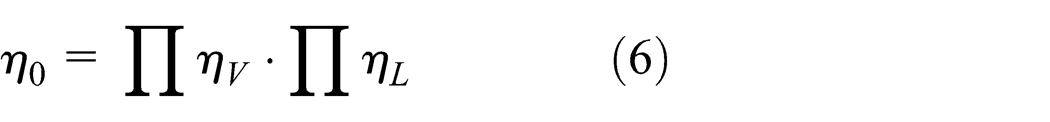
where ηV is the gear meshing efficiency and ηL is the planetary bearing efficiency. For a transfer gear set, there is no need to take planetary bearing efficiency into consideration. According to VDI Richtlinie 2157, 20 the gear meshing efficiency is assumed to be 99.0% for an external gear pair and 99.5% for an internal gear pair. The planetary bearing efficiency is assumed to be 99.5%.
Bearing loss
There are three types of bearings in this eight-speed automatic transmission: ball bearings, tapered roller bearings, and needle roller bearings. The friction torque of a bearing includes two parts. 21 One part is a function of speed as shown in equation (7). The other part is a function of load as shown in equation (8)
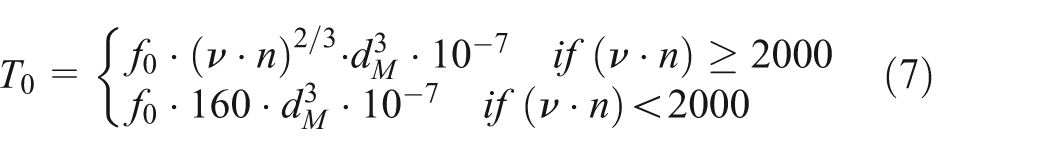
where T0 is the friction torque as a function of speed, f0 is the bearing factor for friction torque as a function of speed, ν is the kinematic viscosity of the oil at a specific operating temperature, n is the operating speed, and dM is the mean bearing diameter

where T1 is the friction torque as a function of load, f1 is the bearing factor for friction torque as a function of load, P1 is the decisive load for friction torque, and F is the load for bearings. The total power loss of a bearing is calculated according to equation (9)

Seal loss
The seals of this eight-speed automatic transmission include the radial shaft seal rings and the o-rings in the shifting elements. For the o-rings, there is an axial friction force when the clutch piston moves in the axial direction besides the friction force in the circumferential direction. However, this axial friction force only exists in the filling phase of the shifting process. It is ignored in the power loss calculation because of the short action time of the piston. The calculation of seal loss is expressed by equation (10) 22

where dsh is the shaft diameter.
Drag torque loss of the open shifting elements
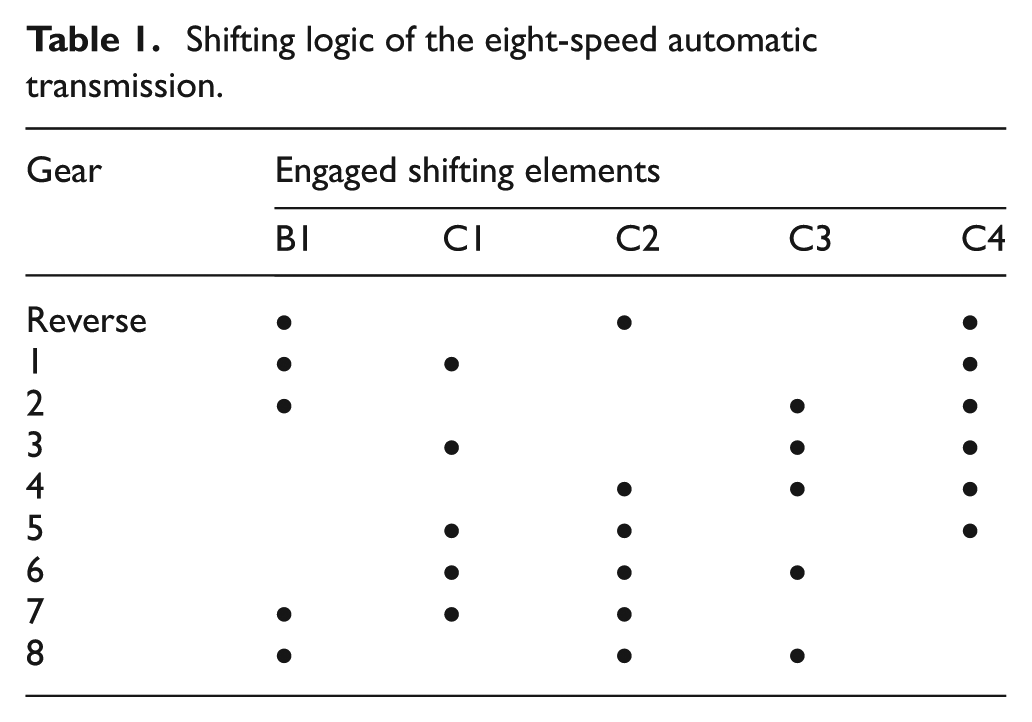
Table 1 shows the shifting logic of the eight-speed automatic transmission. This eight-speed automatic transmission has five shifting elements which are all multi-plate clutches or brakes. In each gear, three shifting elements are locked. Only two open shifting elements create drag torque losses due to the relative motion between the inner and outer plates.
Shifting logic of the eight-speed automatic transmission.
As shown in Figure 2, the drag torque loss depends on the relative speed between the two halves of the shifting element.
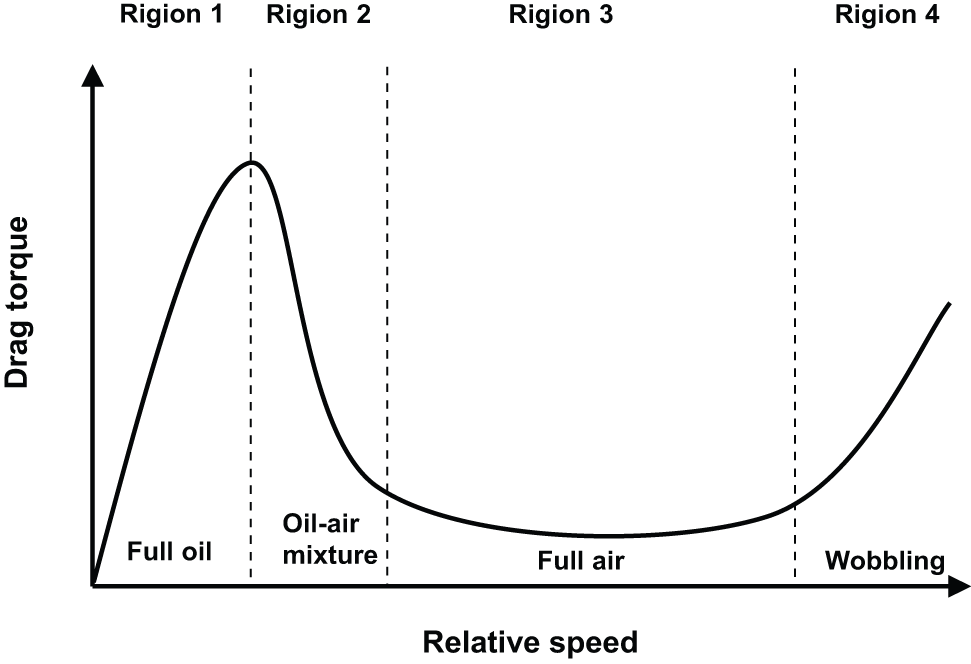
Drag torque profile of the open multi-plate shifting element.
In region 1, the drag torque increases linearly with the relative speed. It is caused by the laminar shear of the oil in the gap between the plates. Assuming that the oil is Newtonian and the laminar velocity is in the circumferential direction, the drag torque in this region then can be expressed by equation (11) 23

where N is the number of friction facings, τ is the viscous torque per unit area, A is the friction area, r is the friction radius, ro is the outer radius of the friction plate, ri is the inner radius of the friction plate, μ is the oil dynamic viscosity, νθ is the oil angular shear velocity, ω is the relative angular speed difference, h is the oil film thickness, and z is the unit interval of the plate gap.
Owing to the increasing relative speed, the centrifugal force overcomes the shear force and begins to drain the oil from the gap in region 2. The laminar flow breaks up, and the air is mixed in the gap. Therefore, the drag torque begins to descend. In region 3, the oil is completely drained by the increasing centrifugal force, and the drag torque drops to a negligible level. When the relative speed continues increasing and enters into region 4, the wobbling of the plates will cause the mechanical contact; thus, the drag torque loss increases again. However, region 4 is avoided in the design of the eight-speed automatic transmission. The drag torque is always calculated based on equation (11) even in region 2 and region 3. This can provide a safety factor for the calculation of the oil flow requirement. The power loss of the open shifting element is, thus, calculated according to equation (12)

Torque converter loss
In the control strategy of the torque converter, the lock-up clutch is always open in the first gear and the reverse gear. In other gears, the pump and the turbine are mechanically connected. A big hydraulic loss appears when the torque converter works under the hydraulic condition. This power loss is also considered in the power loss model and is calculated based on equation (13)
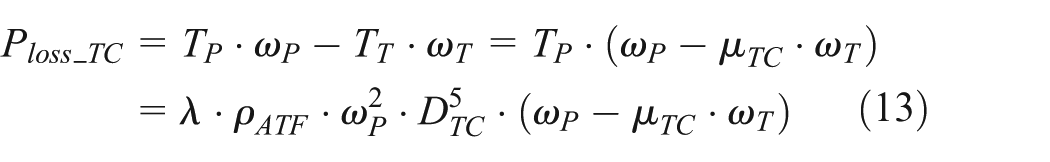
where TP is the pump torque, TT is the turbine torque, ωP is the pump angular speed, ωT is the turbine angular speed, μTC is the torque ratio coefficient, λ is the performance coefficient, ρATF is the oil density, and DTC is the profile diameter of torque converter.
Pump loss
The pump provides the circulated oil flow for the automatic transmission. It also consumes the engine power and generates the heat loss. This loss is calculated by equation (14)

where pline is the hydraulic line pressure, qpump is the oil flow provided by the pump, and ηpump is the pump efficiency. For the MOP, this efficiency includes the volumetric efficiency and the mechanical efficiency. For the EOP, this efficiency also includes the electric efficiency.
All the above losses are torque or speed dependent. The sum of them of different gears at 90 °C is shown in Figure 3. It can be seen that there exists big power loss at the first gear and the reverse gear because the torque converter works under the hydraulic condition. The normal operating temperature of the automatic transmission fluid (ATF) is from 80 °C to 120 °C. When the temperature drops, the loss will increase because the viscosity of the ATF becomes bigger. However, there is still one big loss not shown in Figure 3. This loss occurs not in a specific gear but in the shifting process. It is the shifting loss which is caused by the friction slip of the shifting elements.
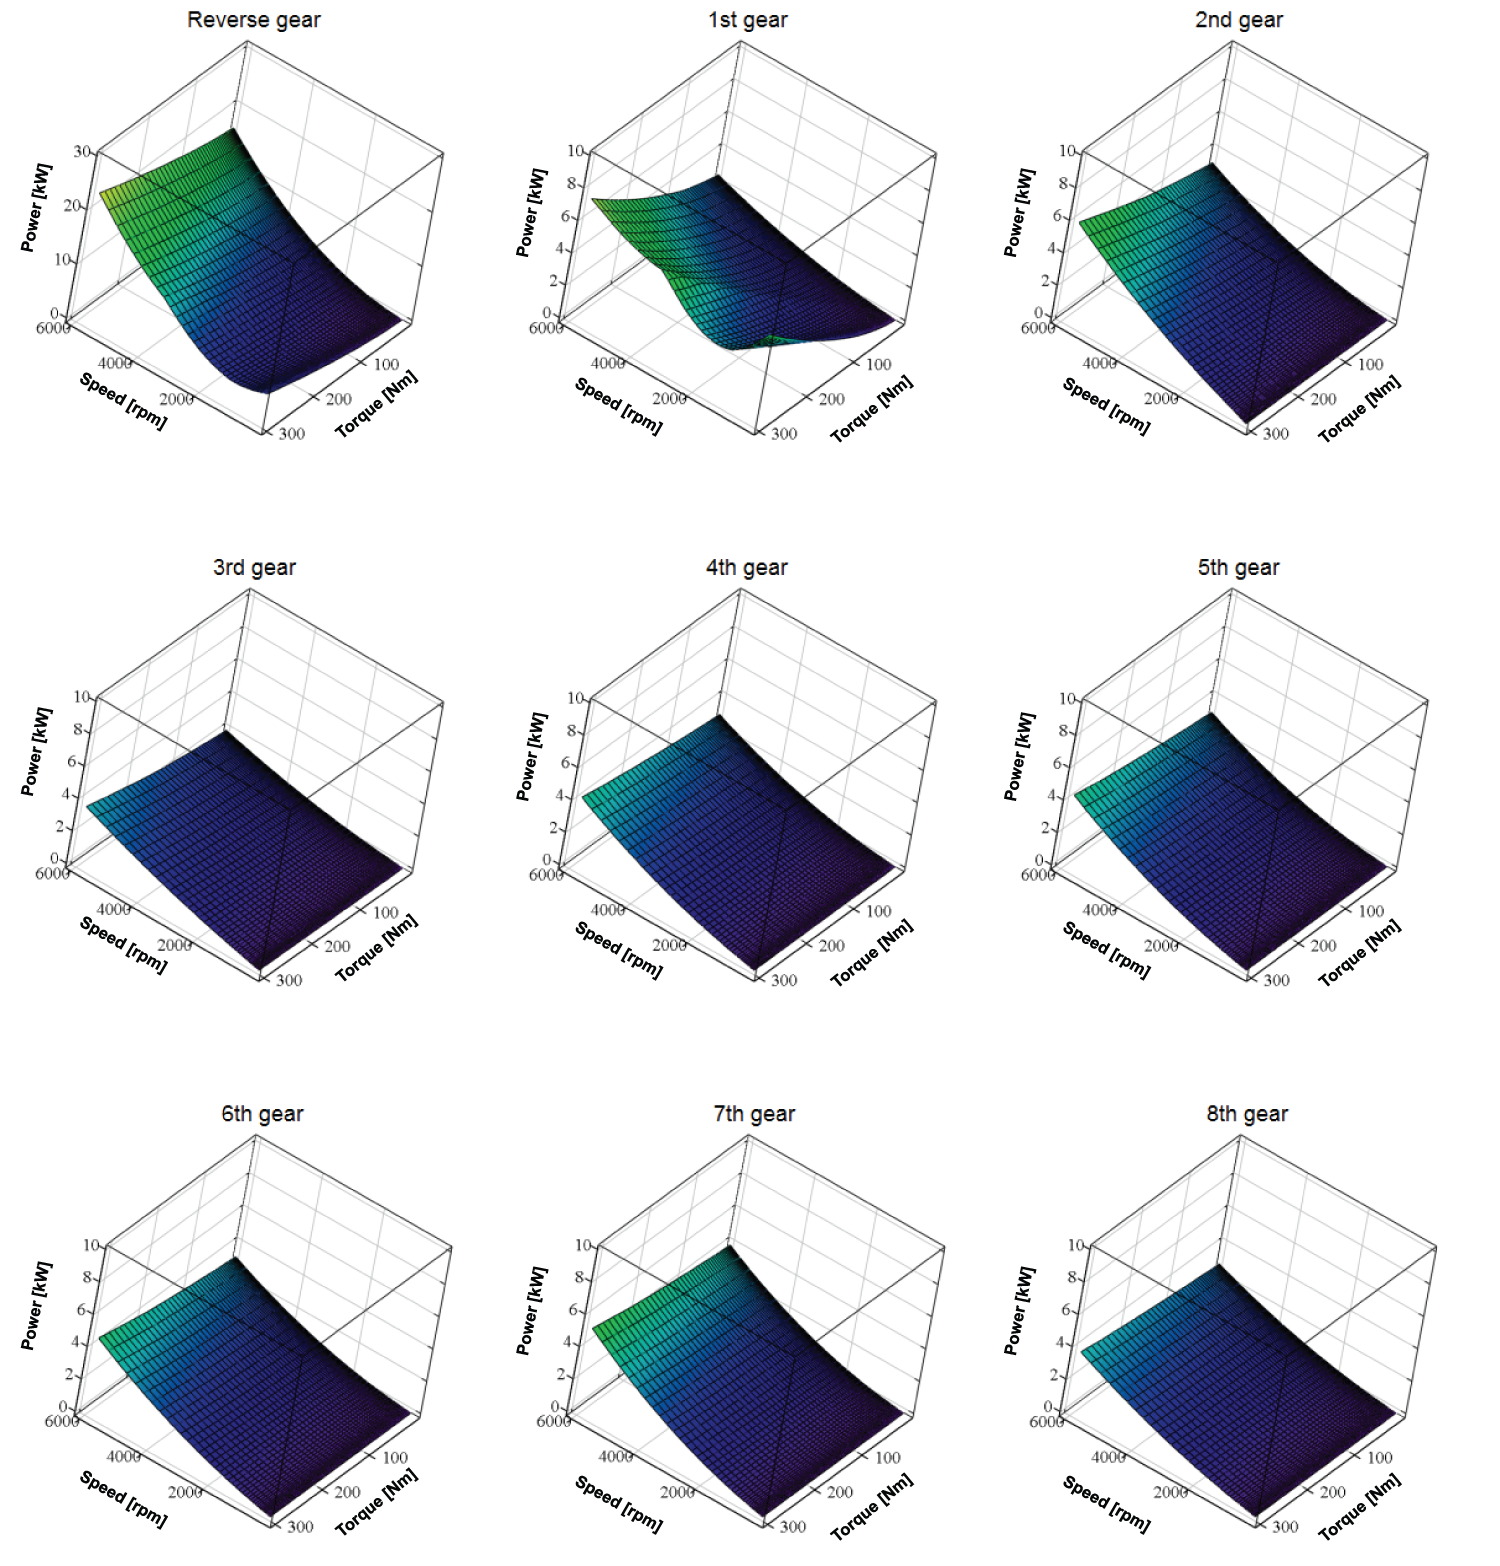
Power loss of the eight-speed automatic transmission in different gears at 90 °C.
Shifting loss
All shifts of this eight-speed automatic transmission are clutch-to-clutch shifts. For the engaging and disengaging shifting elements, there is a pressure-controlled slipping process during the gear shifting. There are four basic shifting types in automatic transmissions, namely power-on upshift, power-on downshift, power-off upshift, and power-off downshift. Their differences and control logic are explained in detail in Dong et al. 24 In the shifting process of power-on upshift and power-off downshift, most of the power loss occurs at the on-coming shifting element. On the other hand, in the shifting process of power-on downshift and power-off upshift, most of the power loss occurs at the off-going shifting element. The power loss of the actuated shifting element is calculated by equation (15)

where μd is the dynamic friction coefficient, pSE is the pressure of the shifting element, pkiss is the kiss-point pressure which compensates for the return spring and seal friction force, and Δω is the angular speed difference. The shifting loss can be taken into account for each shift in the forward driving simulation. It is usually greater than other power losses. The heat occurs in such a short time and cannot be dissipated by the oil within a short period of time. The friction materials should be able to bear such a high temperature. There are slots on the plate surface to let the oil go through when the shifting element is locked. Figure 4 shows one part of the New European Driving Cycle (NEDC) and its calculated power loss in the forward driving simulation. It can be seen that the peak points of the power loss curve are just caused by the gear shifting at a certain driving pedal position.

Simulation results of the NEDC.
Leakage model
Figure 5 shows the hydraulic schematic diagram of the eight-speed automatic transmission. The detailed description of its functionality is introduced in Wang et al. 25 In this hydraulic system, all the valves (proportional solenoid valves and slide valves) have leakages. The leakage oil flow must be compensated by the two-pump system. There are two kinds of leakage in the hydraulic system. One considers the leakage of the eccentric ring gap, as shown in Figure 6(a). The leakage between the spool and the bore in the slide valve is just like this form. The other is called the orifice leakage, as shown in Figure 6(b). The leakage of the proportional solenoid valve is considered in this form.

Hydraulic schematic diagram of the eight-speed automatic transmission.

Two types of leakage in the hydraulic system (a) Leakage of the eccentric ring gap and (b) leakage of the orifice.
The calculation of the leakage in an eccentric ring gap is expressed by equation (16) 26

where d1 is the inner diameter of the bore, d2 is the outer diameter of the spool, l is the overlap length between bore and spool, Δp is the pressure difference, and e is the eccentric ring gap. The orifice leakage in the proportional solenoid valve is calculated by equation (17) 26

where αD is the flow coefficient and A0 is the cross-sectional area of the orifice.
It is known from equation (16) that the leakage of an eccentric ring gap is much influenced by the temperature. With the temperature rising, the kinematic viscosity of the oil ν will decrease; thus, the leakage will increase. However, the temperature has a small impact on the orifice leakage. In different transmissions, the leakage is different owing to different tolerances. The calculation here assumes that the transmission has the biggest tolerance; thus, the eccentric e has the biggest value equivalent to (d1− d2)/2. The leakage also varies with the line pressure and the control pressure of the hydraulic system. When the pressure difference Δp becomes greater, the ring gap leakage and the orifice leakage will increase. The line pressure is controlled according to the engine torque in the actual driving. But in the leakage calculation, it is always assumed to be the maximum value to ensure that the calculated oil flow requirement is sufficient.
In summary, the total flow requirement for the leakage is calculated by equation (18)

Flow-based control strategy for the EOP
In order to replace the big MOP with a two-pump system (one EOP and one MOP), a flow-based control strategy is developed. This flow-based control strategy just makes use of the information of the calculated flow requirement. No more additional energy is required for the EOP on the condition that the flow from MOP is sufficient for the transmission. Hence, this control strategy can reduce the load of the EOP to a maximum extent. First, based on the power loss model, the required oil flow for the cooling and lubrication is calculated by equation (19)

where Ptotal_loss is the total heat loss generated, Phousing is the heat dissipated through the housing, cATF is the heat capacity of the ATF, and ΔT is the permissible temperature increase in the ATF. In equation (19), the total heat loss generated is defined as
The heat dissipated through the housing is calculated by equation (21)

where k is the heat coefficient which includes the internal heat transfer between oil and housing, the heat conduction through the housing wall, and the external heat that dissipates to the environment. The calculation of this coefficient is described detailedly in ISO/TR 14179-2:2001. 22 Aca is the area of the housing, Toil is the temperature of the ATF, and T∞ is the ambient temperature.
The maximum oil flow for the lubrication and cooling system is limited to 25 L/min by an oil flow control valve (OF_CV) in Figure 5. The reason is that the oil flow increases along with the engine speed. The pressure and the oil flow will become very large at high engine speed without this limitation. Therefore, the flow requirement for the necessary cooling oil is limited to maximum 25 L/min by the OF_CV valve.
The total flow requirement should also consider the leakage mentioned in section “Leakage model.” Hence, the total flow calculation is expressed by equation (22)

where QTC is the minimum flow requirement of the hydraulic torque converter and Qline is the minimum flow demand for maintaining the hydraulic line pressure. Since the MOP is connected to the pump of the torque converter, the oil flow provided by the MOP depends on the engine speed. The necessary flow required from EOP is obtained by subtracting this oil flow from the total flow requirement. Then, the speed of the EOP can be controlled according to equation (23)

where QEOP and QMOP are the oil flows from the EOP and MOP, respectively; VEOP and VMOP are the displacement volumes of the EOP and MOP, respectively; ηEOP_vol and ηMOP_vol are the volumetric efficiencies of the EOP and MOP, respectively; and ηpump is the rotation speed of the MOP.
This flow-based control strategy is verified through the forward driving simulation. For a given displacement of the MOP, Figure 7 shows the simulation results of the total flow requirement, the oil flow provided by the MOP, and the necessary flow from the EOP in a driving simulation. It can be seen that the EOP provides necessary oil flow when the MOP cannot satisfy the total flow requirement. When the MOP can satisfy the system flow requirement alone, the EOP is switched off.
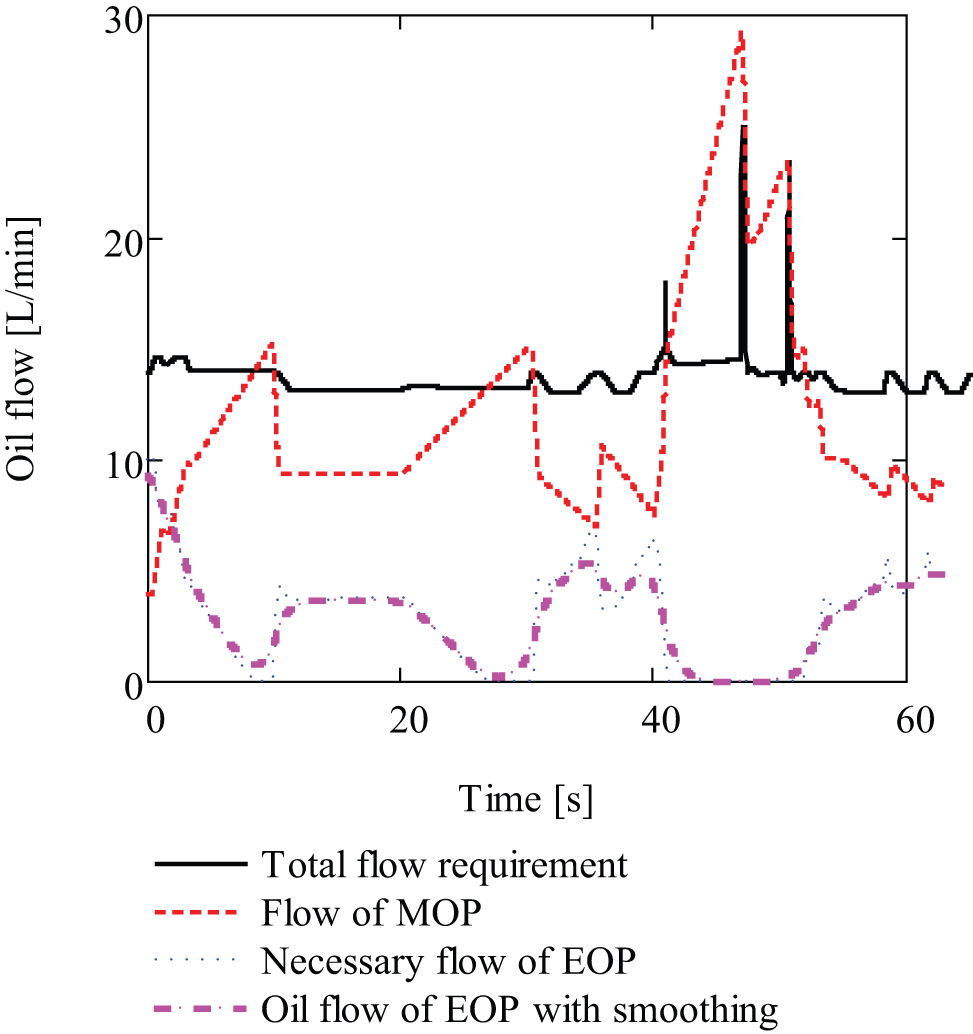
Simulation results of the oil flow in a simple driving cycle.
However, the fluctuation of the EOP flow requirement will make the target control speed of the EOP oscillate when applying this control strategy in the actual vehicle driving. Especially when shift occurs, the oil flow requirement will increase dramatically. The rotation speed of EOP cannot react quickly enough to follow the system flow requirement. In reality, the heat generated in such a short time is dissipated gradually. Hence a first-order time delay function is applied here to make the EOP speed change steadily. As shown in Figure 7, this function helps to smooth the peak points of the oil flow in actual application.
This flow-based control strategy can help us to select the most economical combination of MOP and EOP through the forward driving simulation. For a two-pump system, when a small size of MOP is selected, the energy loss of the MOP especially at high engine speed will be reduced. However, for the compensation for the oil flow at low engine speed, a big EOP must be selected. Besides, the EOP needs to work for a long time which increases the electric load of the vehicle. The total energy consumption thus will not be improved. On the contrary, a big MOP can reduce the electric load of the EOP, but it consumes a lot of energy with the engine speed increasing. Therefore, a best combination of EOP and MOP needs to be investigated with respect to the reduction in the total energy consumption.
The total energy consumption of EOP and MOP is expressed by equation (24)

where PEOP and PMOP are the power demands of EOP and MOP, respectively, and ηEOP and ηMOP are the total efficiency of EOP and MOP, respectively.
First, different sizes of MOP are selected in the simulation. According to the flow-based control strategy, the insufficient oil flow will be supplied by the EOP; thus, its power depends on the displacement of the selected MOP. Figure 8 shows the simulation results of energy consumption with different combinations of EOP and MOP in different driving cycles. Because each driving cycle has a different driving distance and speed-time profile, the total energy consumption for a specific displacement of MOP varies in different driving cycles. However, there is a minimum energy consumption point in each curve. It can be seen in the US race cycle that the minimum point appears at the 4-mL displacement of MOP. In other cycles, the minimum energy consumption point locates at the 7-mL displacement of MOP. The reason is that compared with other cycles, the US race cycle has a higher acceleration and driving speed. The engine normally runs in the high speed range. A big size of MOP will consume much energy. Therefore, the US race cycle tends to have a smaller MOP with respect to energy conservation.

Energy consumption with different combinations of MOP and EOP in different driving cycles.
In all driving cycles, only one big MOP in current transmission has the biggest energy loss. Although applying only one EOP can reduce this energy loss, it is not the best choice as shown in Figure 8. In most of the driving cycles, especially when driving in cities, the simulation results show that a 7-mL displacement of MOP contributes most to the energy conservation. Even in the US highway cycle, a 7-mL displacement of MOP is also the best choice for the eight-speed automatic transmission. Therefore, a 7-mL displacement of MOP is selected in the new designed two-pump system. Compared with only one MOP in the current design, Figure 9 shows the percentage of the energy consumption in each driving cycle when applying only one EOP or a two-pump system with a 7-mL displacement of MOP.

Comparison of energy consumption in different driving cycles.
The power demand of the EOP PEOP corresponding to a certain displacement of MOP is also calculated in the forward driving simulation. It can give us a reference for the selection of the EOP power rating. For example, Figure 10 shows the power demand of the EOP in the NEDC corresponding to the selected 7-mL displacement of MOP. In this driving cycle, the maximum power demand of EOP is 330 W.
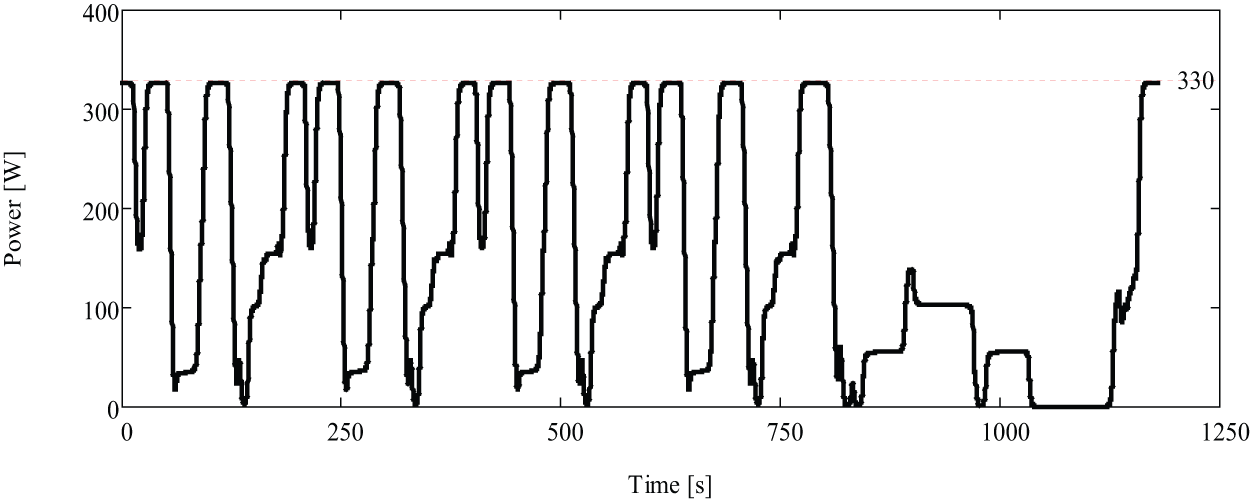
Power demand of the EOP in the NEDC.
Table 2 depicts the maximum power demand of EOP in some driving cycles for the selected 7-mL displacement of MOP. In order to satisfy the demand of all the driving conditions, a peak power of 600 W EOP is selected in the design. However, the EOP will not run at the operating points of peak power in most situations.
Maximum power demand of EOP.
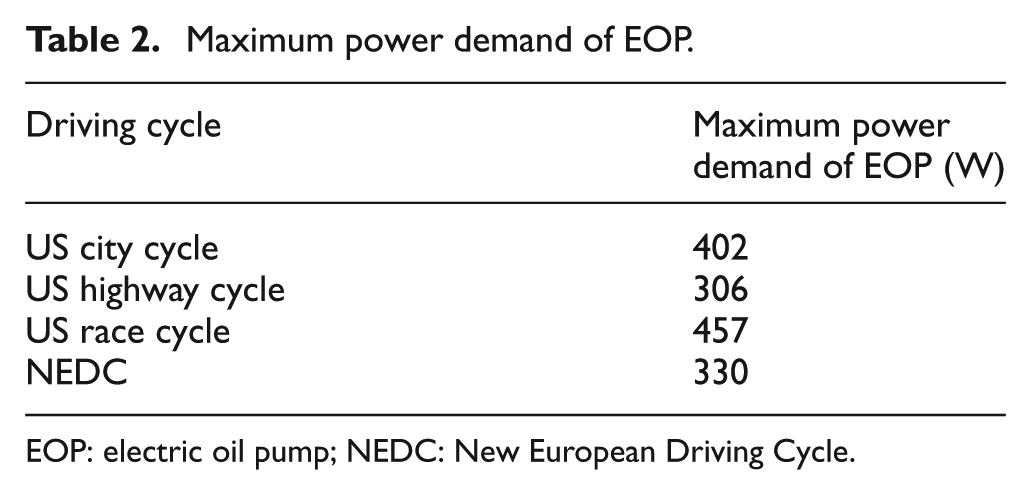
EOP: electric oil pump; NEDC: New European Driving Cycle.
Test verification
Driving simulation results give us an optimal combination of EOP and MOP with respect to energy conservation. Based on it, the new two-pump system is designed and applied in the eight-speed automatic transmission. Figure 11 shows the prototype with the novel two-pump system. The EOP is mounted outside the transmission housing. The downsized MOP is located in the original position behind the torque converter.

Prototype of the eight-speed automatic transmission with the novel two-pump system.
The developed flow-based control strategy for EOP and the novel two-pump system are tested on the vehicle. Figure 12 shows the test vehicle equipped with the prototype. The test data are timely read by the computer through the calibration software CANape.

Test vehicle.
Figure 13 depicts the measured oil temperature in the NEDC. The ATF temperature rises because of high accelerations and frequent shifts. However, the two-pump system supplies sufficient oil flow for cooling and lubrication under the flow-based control strategy. The oil temperature can be maintained at a normal level between 80 °C and 90 °C during driving. In addition, the durability test on the test rig (Figure 14) has also proved that no parts fail due to the heat stress. This two-pump system and the flow-based control strategy can satisfy the oil flow requirement.
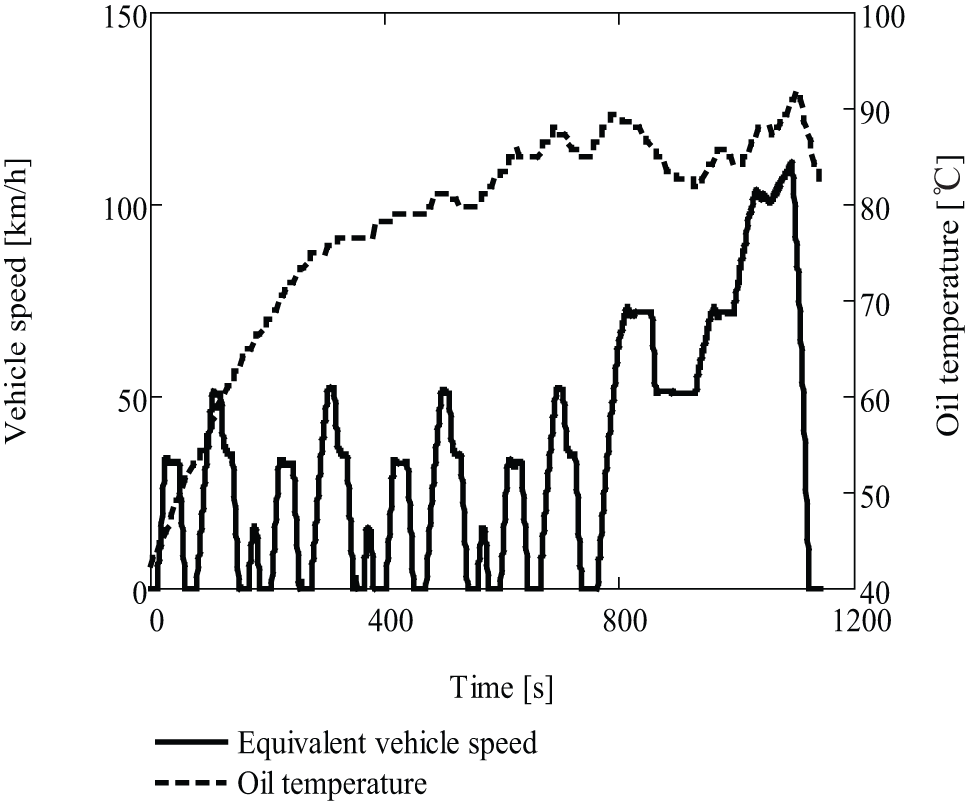
Oil temperature in the test of the NEDC.

Test rig.
Conclusion
A power loss model of an eight-speed automatic transmission is developed to calculate all power losses depending on the engine torque and speed. Based on the power loss model, the required oil flow for cooling and lubrication is timely calculated in the driving simulation. Together with the compensation of the oil flow for leakage, the total flow requirement for the two-pump system is determined. A flow-based control strategy is applied for the EOP control. The driving simulation results show that a two-pump system is better than only one EOP or only one MOP with respect to energy conservation. A best combination for the size of MOP and EOP can be found through the driving simulation. This best combination can not only reduce the energy loss but also satisfy the power demand of the start–stop function. Test results verified that the two-pump system can supply enough oil flow for the eight-speed automatic transmission. This method can be applied for the forward design of a two-pump system in automatic transmissions. It proves that a good combination of MOP and EOP can also improve the energy conservation of automatic transmissions, and this combination can be found through the developed method.
Footnotes
Academic Editor: Anand Thite
Declaration of conflicting interests
The authors declare that there is no conflict of interests regarding the publication of this article.
Funding
This work was supported by the National Science Foundation of China (grant no. 51105017) and the National Science and Technology Support Program of China (grant no. 2011BAG11B00).