
Abstract
A droplet breakup model is developed for a single droplet introduced into transcritical and strong convective environments. The numerical model takes into account variable thermophysical properties, gas solubility in the liquid phase, and vapor–liquid interfacial thermodynamics. The influences of ambient conditions on droplet breakup characteristics are investigated. The results indicate that (1) the drag acceleration decreases slowly at first and then increases drastically with the initial droplet temperature increasing, but always increases at a constant rate with ambient pressure; (2) the pressure and the drop temperature have similar effects on the Kelvin–Helmholtz and Rayleigh–Taylor wave growth at high pressures (reduced pressure higher than 1.2) and high temperatures (reduced temperature higher than 0.7), but the impact of pressure on the wave growth is relatively stronger than that of droplet temperature at relatively low pressures (reduced pressure lower than 0.8) and low temperatures (reduced temperature lower than 0.63); (3) the temperature significantly affects the surface instability growth at high drop temperatures (reduced temperature higher than 0.7), but has no effect on the instability growth at low temperatures (reduced temperature lower than 0.63).
Introduction
The problem of transcritical mixing attracts significant attention since numerous practical applications exist where the ambient pressure and temperature can reach near-critical or supercritical state (i.e. transcritical conditions) of one of the fluid components.1,2 During the transcritical mixing process of the power systems, such as aircraft jet engines, diesel engines, and direct injection gasoline (GDI) engines, the liquid fuel is injected into the combustion chamber as a spray of droplets and then undergoes a sequence of physical processes including instability, breakup, evaporation, mixing, and so on. The drop breakup in transcritical mixing process leads to reduced droplet size and increased surface area, which affects the droplet evaporation and the ignitable mixture formation obviously. Therefore, it is significant to study deeply the breakup, instabilities, and dynamics of a single droplet in transcritical and high-speed airflow. 3
Several investigations on the entire spray and air–fuel mixing processes regarding transcritical conditions have been presented in the published literatures. Many phenomena coexist near the critical point, for example, strengthened dissolution of gas phase in liquid phase and rapid decrease in evaporation enthalpy. Near the critical point, the thermophysical properties of both vapor and liquid phases usually exhibit anomalous variations and are extremely sensitive to pressure and temperature, leading to a phenomenon commonly referred to near-critical enhancement. Tavlarides and Anitescu 4 suggested that injecting fuels near the critical region into the engine cylinders is one way to increase engine efficiency and to decrease emissions. Segal and Polikhov 5 found that the fluid has gas-like thermal properties and liquid-like densities. It was concluded that the liquid inertia and the surface tension have the dominant effect on the jet instability and breakup at subcritical conditions; however, only the reduced surface tension affects the jet surface behavior significantly at supercritical conditions. Polikhov and Segal 6 found that the jet surface becomes more unstable for supercritical injection temperatures, but the jet surface is nearly straight with the strong density stratification, which suppresses the instability wave growth, for subcritical injection temperatures. 7 Rachedi et al. 8 showed that the jet behaviors of a hydrocarbon and a CO2 supercritical fluids are similar in most aspects: the jet swirl number has a significant effect on cone angle, while the density ratio has a minor influence on it. Kim et al. 9 conducted computational analysis of four cryogen nitrogen jets at near-critical and supercritical pressures, using their computational fluid dynamics (CFD) code incorporated with two real-fluid equations of state and dense-fluid correction schemes.
However, all the above studies on the transcritical spray were conducted from the macroscopic view. Down to the level of the fundamental element of spray (i.e. an isolated droplet), most of the existing research works regarding transcritical conditions concentrate on the drop evaporation,10–12 and little work has been done on the droplet breakup, instabilities, and dynamics. Several models are proposed and adopted for droplet instability and breakup in high-velocity airstream, such as the Kelvin–Helmholtz (KH) model, the Rayleigh–Taylor (RT) model, the linearized instability sheet atomization (LISA) model, and the Taylor analogy breakup (TAB) model.13–15 Among them, the KH model and the RT model are widely used to describe the secondary breakup and the surface instability in the case of low Weber numbers (higher than 45) and high Weber numbers (higher than 1000), respectively,16–18 but are still only applicable for pressure and temperature conditions far below the critical points of the fuels. These models fail to consider the nonideal fluid behavior under transcritical conditions. Therefore, the KH model and the RT model were improved as part of the new model in this work to predict the breakup, instability, and so on of a high-speed droplet under transcritical conditions.
The objective of this work is to develop a numerical model for the breakup, instabilities, and dynamics of a single droplet introduced into transcritical and strong convective environments and to gain a further understanding of the droplet breakup, instability, and dynamic physics under extreme conditions. This model takes into account real-fluid properties, high-pressure effects, and gas solubility in the liquid phase. Variable thermophysical properties are adopted as functions of pressure, composition, and temperature. It also considers the surface tension disappearance at the critical mixing point as well as the spatial and temporal distribution of thermophysical properties. The influences of ambient conditions on droplet breakup, instability, and drag characteristics are investigated with the developed model.
Model development
The developed instability and breakup model for a high-speed droplet under transcritical and forced convective conditions includes the droplet evaporation sub-model and the KH/RT breakup sub-model, which are described schematically in Figure 1. rs stands for droplet radius, urel stands for the relative velocity between droplet and surrounding gas, m is the droplet mass, and t represents the time. a represents the acceleration, and Λ KH and Λ RT are the wavelengths of KH and RT waves, respectively.
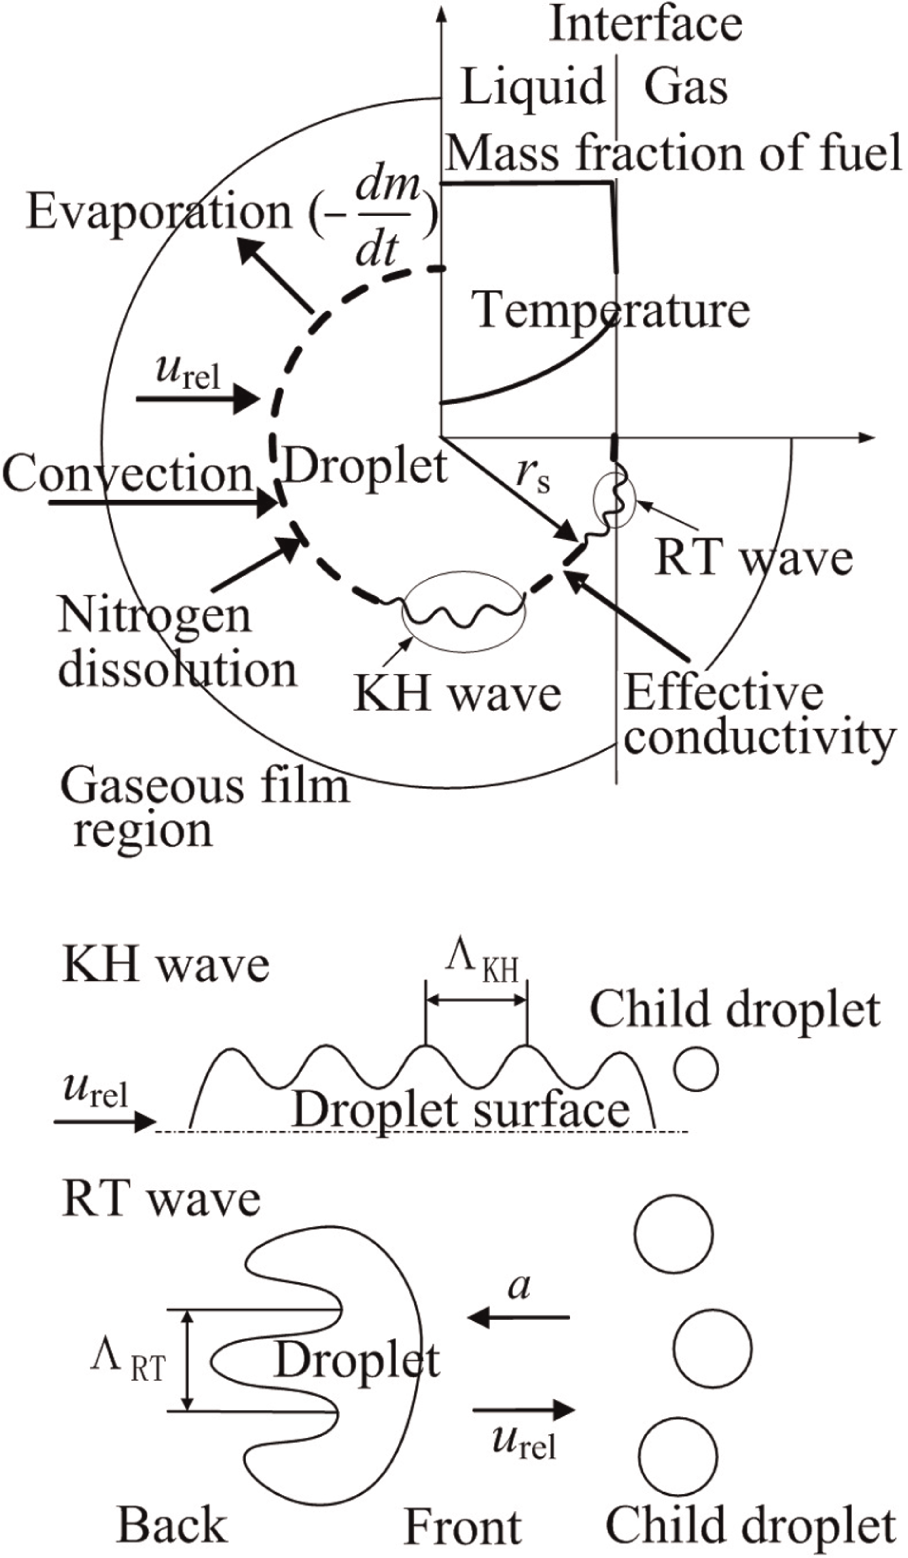
Modeling of heat and mass transfer and KH and RT instabilities under transcritical conditions.
Regarding the evaporation calculation, it considers the strong convective heat transfer and mass diffusion, the liquid phase internal circulation, and so on. The droplet is assumed to be spherically symmetric for the evaporation calculation, but its deformation is taken into account for breakup calculation. As regards the instability and breakup calculation, the KH–RT competition mechanism is adopted. The KH instability and breakup are based on the shear flow instability growth induced by aerodynamic forces, which result from the relative velocity between liquid and gas. The KH surface wave with the highest growth rate will finally be sheared off the parent drop and form new droplets. The RT model is based on the instability of the interface between two liquids of different densities. RT instabilities can develop if the fluid acceleration has an opposite direction to the density gradient.
The physical problem described here considers the surface instability and breakup of an isolated evaporating droplet, which is suddenly introduced into a high-speed gas flow with its thermodynamic state approaching the critical point. The gas atmosphere is nitrogen, and the fuel is n-heptane, which has a critical pressure Pc of 2.74 MPa and a critical temperature Tc of 540 K.
Governing equations
The developed model considers high-pressure effects, solubility of inert species into liquid phase, real-fluid behavior of both liquid and gas phases, and the spatial distribution and temporal variation of thermophysical properties. Ambient gas is assumed to be dissolved only in a very thin layer of the gas–liquid interface, and thus the gas diffusion into the liquid interior is ignored. Considering the forced convective heat transfer and mass diffusion in the gaseous boundary layer around the droplet, an effective conductivity is adopted based on an effective film method, which also takes account of the liquid phase internal circulation. 19 The radiation heat transfer is negligible and pressure is constant considering small flow velocity in comparison with the acoustic speed.
Energy conservation inside the droplet

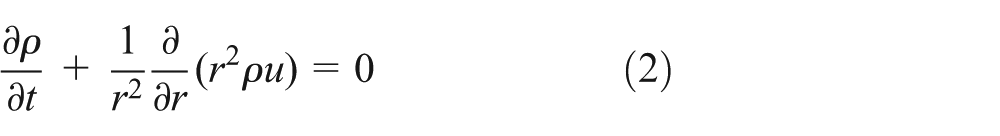
Continuity equation for liquid phase
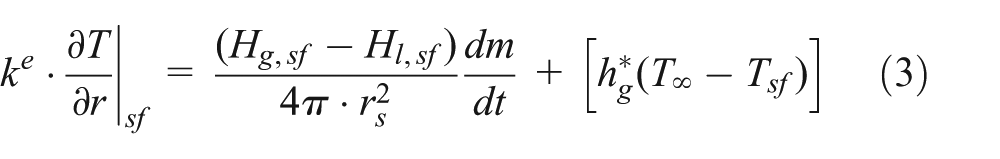
Liquid–gas phase energy balance
Species conservation

In the above equations, r is the radial distance relative to droplet center, u represents the radial velocity inside the droplet, T is the temperature, ρ stands for density, λ represents the thermal conductivity, and Cp indicates the constant pressure heat capacity. ke
is the effective thermal conductivity; H is the enthalpy;
Nitrogen dissolution in the liquid phase is neglected in the droplet mass calculation. At the droplet surface, the mass rate of ambient gas divided by the total mass rate of the liquid component is calculated by

where Vs is the droplet volume, and V stands for volume. The corrected mass and heat transfer coefficients in equations (3) and (4) and the effective thermal conductivity ke can be obtained from Jin and Borman. 19
Mass conservation of droplet

Momentum conservation
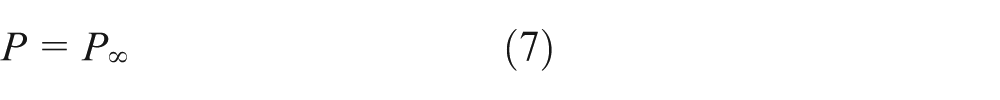
where P and
Droplet breakup, instability, and drag acceleration
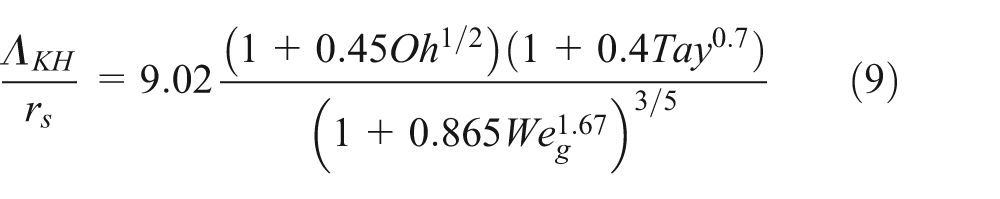
In the KH model theory, the coordinate system is cylindrical and fixed with respect to the liquid; thus, the case of fuel injection is considered as a high-velocity gas moving over a stationary liquid blob. 20 The mechanical relations are combined with the linearized hydrodynamical equations to form a complete description of the motion of the liquid and the gas. The solution can be found by transforming the motion equations into stream and potential functions. The obtained dispersion relationship was fitted numerically to obtain the wavelength and the frequency for the fastest growing wave on the surface. 21 The curve fits obtained by this analysis for the growth rate Ω KH of the fastest growing and the corresponding wavelength Λ KH are 22

The KH breakup time tbu,KH and the critical radius rKH are

and

where
The RT model theory is based on the original Taylor model 23 which assumes that acceleration normal to the interface between two fluids of different densities can cause instabilities, with the assumption of linearized disturbance growth rates. 24 The problem of disturbance growth is solved in two dimensions with the acceleration of the fluids normal to the interface between them. The RT breakup results from the strong drag-deceleration when the relative velocity between drop and gas is very high.
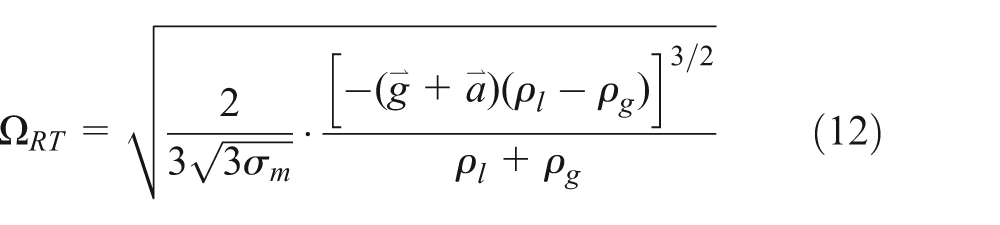
The growth rate Ω RT and the wavelength Λ RT corresponding to the fastest growing wave are obtained from 25

where C
3 is the model constant;
The RT breakup time is

The density and the surface tension of single component fluids are replaced with that of the fuel–gas binary mixture. Furthermore, the developed breakup and instability model also considers variable thermophysical properties and the real-fluid behavior under transcritical conditions. Similarly, the acceleration of the droplet was obtained by dividing the drag force by the mass of the droplet 25

Thermophysical properties
For a binary mixture, the critical mixing point can be written as 26


where
The mixture surface tension can be determined by

where Tc ,mix represents the mixture temperature at the critical mixing point, and the constant K is estimated by fitting the calculation results to the experimental data. 27
In order to take into account real-fluid behavior, vapor–liquid phase equilibria, and high-pressure effects, the Peng–Robinson equation of state (EOS) is utilized for the gas and liquid mixture and can be used to calculate fugacity coefficients, specific enthalpy, constant pressure heat capacity, and so on.
Considering high density and pressure effects, the gas and liquid thermal conductivities and the liquid viscosity are calculated from the corrected method of Chung et al. 28 The mass diffusion for the binary system is obtained from the Wilke and Lee method, which utilizes the Takahashi method for pressure corrections. 29 Thermodynamic properties in the gaseous boundary layer are estimated with 1/3 rule 30 based on the average temperature and the average concentration.
Boundary conditions
The temperature gradient is assumed to be 0 at the drop center, and all the variables remain at their initial values at the infinite boundary. The boundary conditions at the droplet surface are expressed by requiring the existence of thermodynamic phase equilibrium. The droplet diameter is 40 μm in the simulations.
Non-dimensional variables
Solution procedure
An efficient numerical algorism based on iterative method is adopted to solve the governing equations. A central difference scheme is utilized for the numerical calculation of liquid phase energy conservation, and a fully implicit scheme is adopted for transient solution. A second-order one-sided difference is employed with a non-uniform grid system at the liquid–gas interface in order to consider extremely high gradients of thermophysical properties near the droplet surface.
Figure 2 is a flow chart describing the procedure of KH/RT breakup and instability calculation. The RT and KH instable waves are only allowed to form on the droplet when the droplet diameter is larger than Λ RT and 2rKH , respectively. When the disturbances have grown for enough time to exceed the elapsed breakup time, the droplet breakup is completed.

Flow chart for solving the governing equations.
In this article, the numerical solution method includes the following: (1) calculation of heat transfer and mass diffusion in the droplet evaporation process and (2) calculation of breakup and instability in the same time step. A non-dimensional time step of 1 × 10⁻⁶ ensures the convergence of the numerical method.
Experimental procedure
In order to verify the effectiveness of the breakup and instability model for an isolated liquid droplet proposed in this article, droplet breakup experiments were carried out at room pressure and high-temperature environments. The predicted and measured breakup times are compared under different operating conditions.
The high-speed imaging system for droplet breakup is shown schematically in Figure 3. At the right side, a gas nozzle with an inner diameter of 40 mm is included and enables continuous horizontal flows of nitrogen gas through the constant volume chamber. The gas velocity at the nozzle hole exit is determined from the airflow rate, which is monitored by a rotameter. A vertically mounted droplet generator is used to repeatedly produce monodisperse droplets with the diameter of about 1 mm. When the horizontal distance between the injecting drop and the nozzle exit is decreased, the shear layer thickness at the point of entry of the drops into the jet will be reduced, which also decreases the boundary layer effects. Thus, the tip of the droplet generator is located, as close as possible to the gas nozzle outlet, at a horizontal distance of approximately 3 mm from the gas nozzle. The gas velocity at the gas nozzle outlet is considered to be equal to that of the airflow surrounding the droplet, due to such a short distance between the droplet and the gas nozzle outlet. In addition, the 60-mm-long air nozzle passage is used to reduce the airflow divergence. The working fluid is taken to be n-heptane, and the chamber is purged by injecting nitrogen gas, which replaces air inside the chamber in order to avoid combustion and oxidation processes. A cone-shaped ventline mounted at the left side of the chamber is utilized to eliminate the radial diffusion of the jet stream to some degree. Several T-type thermocouples are installed inside the chamber, the gas nozzle, and the droplet generator in order to measure their internal fluid temperatures in real time. The droplet temperature and the ambient temperature are controlled independently in the test. Droplet temperature is controlled by an electric furnace considering low liquid flow rate and convenient operation, but ambient temperature is controlled by a high-power resistance heater which can heat the high-speed airflow within a short time. In order to reduce the temperature gradient around the droplet, the droplet generator tip is located as close as possible to the horizontal airflow in the vertical direction. The pressure inside the vessel is maintained at atmospheric pressure level by a pressure regulator.

Schematic diagram of droplet breakup experiments: (a) front view and (b) top view.
A FASTCAM SA1.1 high-speed camera equipped with a 100-mm focal length macro lens, providing a 1024 × 1024 pixel resolution and a capture frame rate of 5400 frames per second, was used to image the backside illuminated droplets. Two quartz glass windows are installed oppositely on the chamber for optical accessibility. The whole drop breakup process is photographed through the high-speed camera. The resulting frames are recorded on data storage and then are analyzed to calculate the breakup time, droplet velocity, and so on. The fuel collector is used to collect the falling droplets.
Results and discussion
Model validation
The drop diameter and the ambient pressure are 1.0 mm and 0.1 MPa in the experiments, respectively. The chamber temperature Tam is varied between 380 and 800 K (which corresponds to the reduced temperature Tam /Tc of 1.5). The initial droplet temperature T is set at 293 and 350 K (which corresponds to the reduced temperature T/Tc of 0.65), respectively. The critical properties of n-heptane are taken as a reference.
Figure 4 displays the consecutive images of droplets injected into the high-speed gas flow under two different conditions: (1) the initial droplet temperature T = 335 K, the chamber temperature Tam = 485 K, and the relative velocity urel = 30 m/s and (2) the initial droplet temperature T = 350 K, the chamber temperature Tam = 650 K, and the relative velocity urel = 45 m/s.

Consecutive images of droplets injected into the high-speed gas flow.
Figure 5 shows the comparisons between the predicted breakup time tbu,num and the measured breakup time tbu,exp under different operating conditions. In order to measure the breakup time experimentally, the time when the droplet just enters the edge of the laminar flow is defined as origin of time. Figure 5(a) shows the variations of breakup time with ambient temperature Tam/Tc and relative velocity urel , when the initial droplet temperature T/Tc = 0.54. Figure 5(b) shows the variations of breakup time with ambient temperature Tam /Tc and relative velocity urel , when the initial droplet temperature T/Tc = 0.65. The simulation results are in good agreement with the experimental results, which validates the effectiveness of the numerical model proposed in this article.

Comparisons of predicted and measured breakup times under different conditions: (a) initial droplet temperature T/Tc = 0.54 and (b) initial droplet temperature T/Tc = 0.65.
Effects of ambient pressure and initial droplet temperature on drop drag acceleration
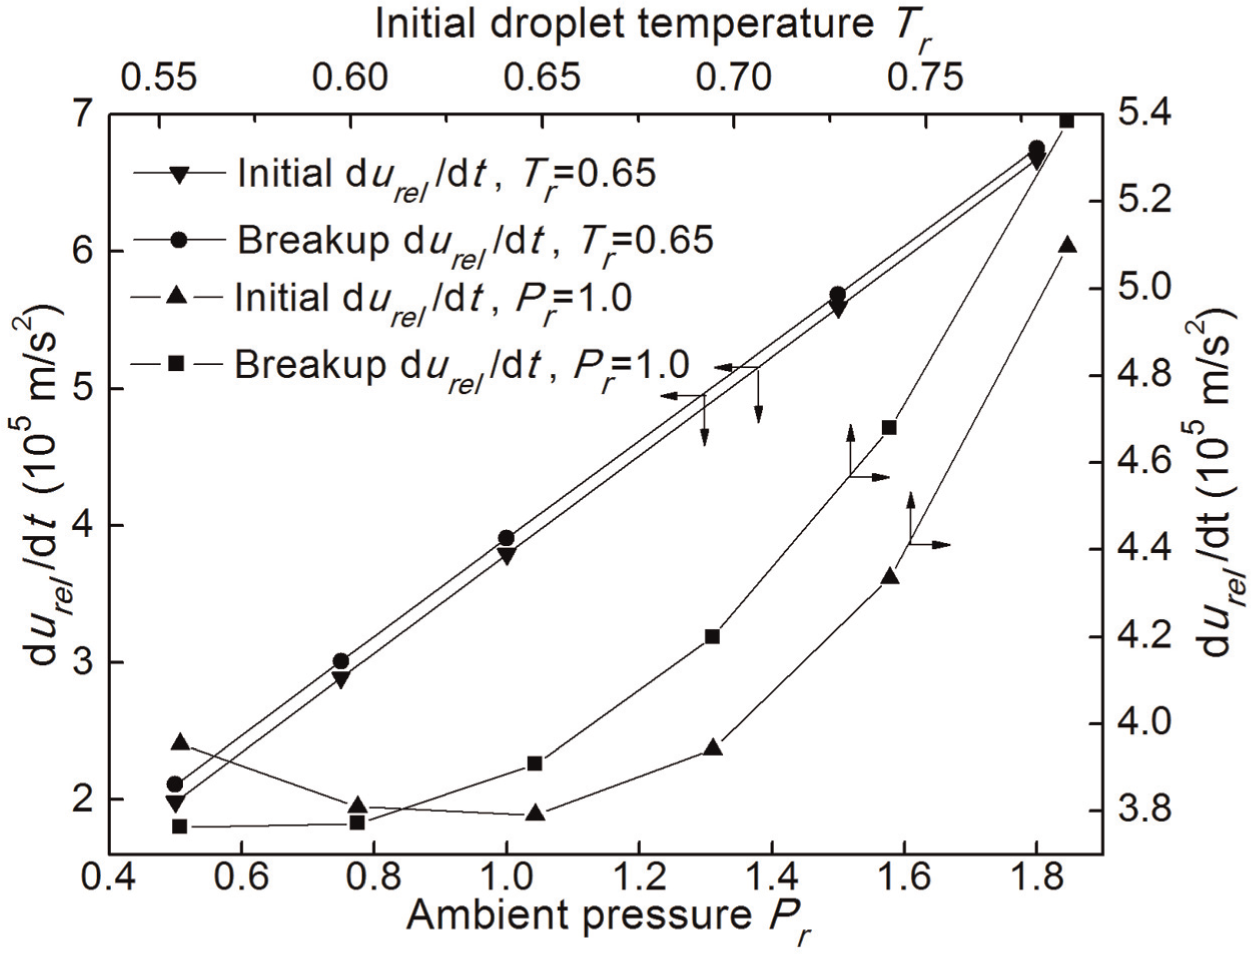
The drag acceleration durel /dt significantly affects the RT instability growing on the surface and the droplet trajectory. The latter determines the spray penetration and cone angle. Figures 6 and 7 show the effects of the initial droplet temperature T/Tc (Tr ) and the ambient pressure P/Pc (Pr ) on the drag acceleration. The Tam /Tc is 1.0, where Tam is the chamber temperature. The urel is equal to 40 m/s in Figure 6 and 80 m/s in Figure 7, respectively. The initial durel /dt is defined as the drag value when the droplet is just introduced into the convective transcritical environment, and the final durel /dt is the value when the droplet breakup is just completed. It can be seen from Figures 6 and 7 that the drag acceleration decreases slowly in the beginning and then increases drastically with the initial droplet temperature, but always increases at a constant rate with the ambient pressure. The final droplet drag is smaller than the initial droplet drag when the initial droplet temperature T/Tc is lower than 0.62, but is always larger than the initial droplet drag when the initial droplet temperature T/Tc is higher than 0.62 at the same pressure (Pr = 1.0). The results indicate that increasing ambient pressure can significantly increase the running resistance of droplets, but increasing droplet temperature has a relatively complex influence on the droplet drag. For low droplet temperatures, increasing droplet temperature can reduce the droplet drag, but for high droplet temperatures, it shows the opposite effect. With the same initial droplet temperature, the final droplet drag is always larger than the initial drag at any pressures as shown in Figure 6. This should be explained by the changes in thermophysical properties due to the heat transfer from the ambient gas. The droplet temperature rise leads to an increase in droplet drag. Compared with Figure 6, Figure 7 shows that there is little difference between the final value of the droplet drag and its initial value (when urel = 80 m/s). This is because the breakup time is very short for high levels of urel .
Variations of drag acceleration with ambient pressure and initial droplet temperature at urel of 40 m/s.

Variations of drag acceleration with ambient pressure and initial droplet temperature at urel of 80 m/s.
Effects of ambient pressure and initial droplet temperature on the density difference between liquid and gas
Figure 8 presents the variations of the liquid–gas density difference ρr,l − ρr,g at different initial droplet temperatures and ambient pressures. The initial ρr,l − ρr,g is the value when the droplet is just introduced into the transcritical environment, and the final ρr,l − ρr,g is the value when the breakup completes. The ambient temperature Tam /Tc is equal to 1.0, and urel is 80 m/s. ρr,l − ρr,g reflects the inertial force on the gas–liquid interface, which causes normal stress at the liquid surface and RT wave growth. As can be seen from Figure 8, ρr,l − ρr,g decreases with the ambient pressure and the initial droplet temperature. The results indicate that the gas phase density increases more rapidly than the liquid phase density when the ambient pressure increases, but decreases more slowly than the liquid phase density when the initial droplet temperature increases. In other words, the impact of increasing ambient pressure on the gas density change is stronger than that on the liquid density change, while the effect of increasing initial droplet temperature on the gas density change is weaker than that on the liquid density change. Figure 8 also shows that the final ρr,l − ρr,g is smaller than its initial value due to the droplet temperature rise during the evaporation process. In addition, the change in ρr,l − ρr,g with the initial droplet temperature is faster than the change in that with ambient pressure as shown in Figure 8, indicating that the droplet drag is more sensitive to droplet temperature.
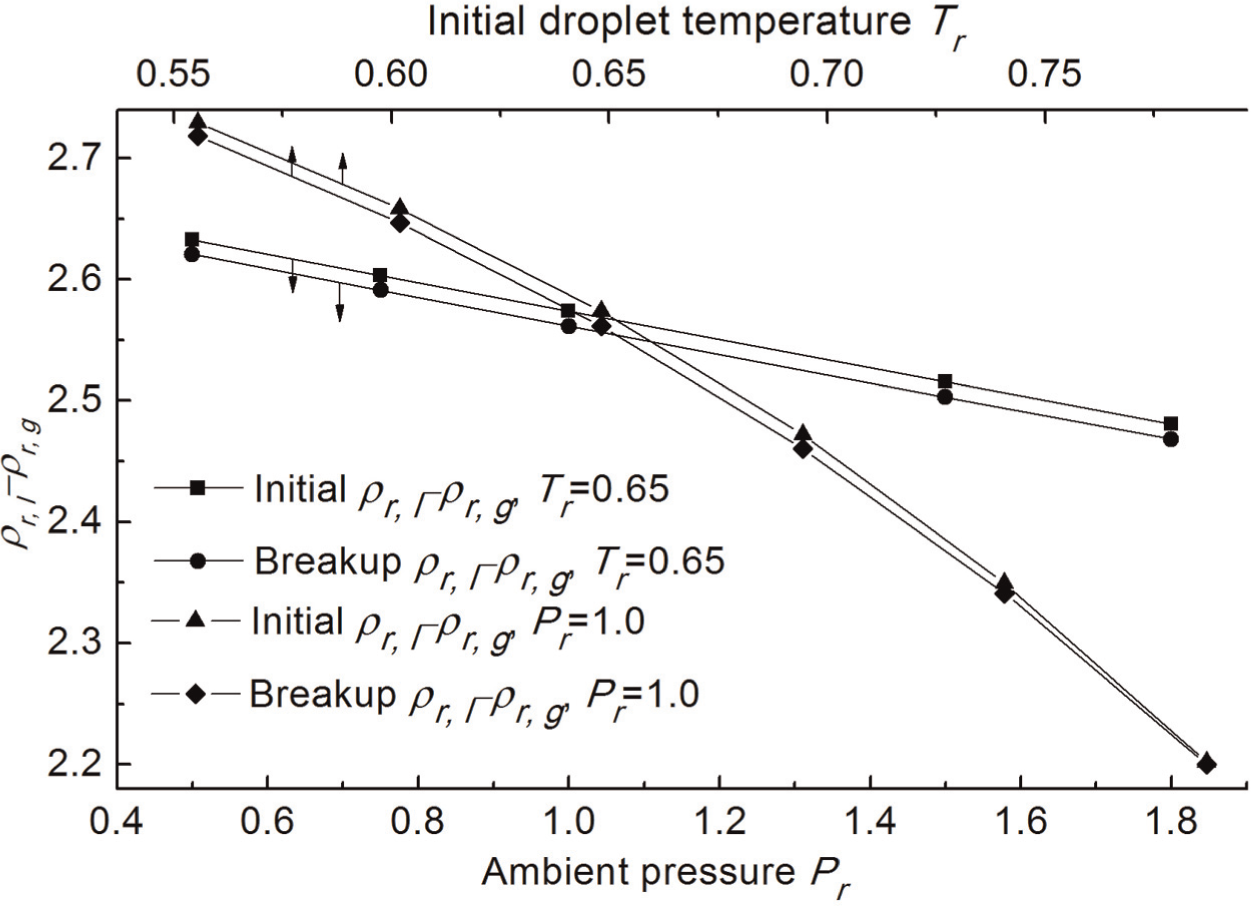
Variations of ρr,l − ρr,g at various ambient pressures and initial droplet temperatures.
Effects of ambient pressure, initial droplet temperature, and urel on KH and RT wave growth
Figure 9 presents the variations of the maximum growth rate Ω KH of KH wave and the KH breakup time τbu,KH at different initial droplet temperatures and ambient pressures. The initial Ω KH is the Ω KH value when the droplet is just introduced into the environment, and the final Ω KH is the value when the breakup completes. The ambient temperature Tam /Tc is 1.0, and urel is 40 m/s. Both the ambient pressure and the initial droplet temperature affect Ω KH and τbu,KH obviously. Ω KH increases at an almost constant rate with increasing ambient pressure, but the increasing rate of Ω KH is increased gradually when the initial droplet temperature increases. This should be explained by that both the ambient pressure and the droplet temperature have significant impacts on thermophysical and transport properties of gas and liquid phases, especially under transcritical conditions, which have obvious effects on the droplet surface instability driven by aerodynamic forces. Furthermore, it can be concluded that the impact of increasing droplet temperature on fluid properties and surface instabilities is stronger than that of increasing ambient pressure on fluid properties and surface instabilities. As shown in Figure 9, the rate of τbu,KH reduction decreases constantly with ambient pressure because Ω KH rises sharply and leads to a high breakup rate of droplets. The figure also shows that τbu,KH changes very slowly with the droplet temperature in the initial stage, indicating that the temperature has little effect on the instability growth in the tangential direction at low temperatures (Tr < 0.63). The predictions also show that the final Ω KH is larger than the initial Ω KH . It indicates that the variations of thermophysical properties during droplet evaporation can promote the growth rate of the KH instability.

Variations of τbu,KH and Ω KH at various ambient pressures and initial droplet temperatures.
Figure 10 gives the variations of the maximum growth rate Ω RT of RT wave and the breakup time τbu,RT at different initial droplet temperatures and ambient pressures. The initial Ω RT is the value when the droplet is just introduced into the environment, and the final Ω RT is the value when the breakup completes. The ambient temperature Tam /Tc is 1.0, and urel is 80 m/s. The comparisons between Figures 9 and 10 show that the variation curves of Ω RT and τbu,RT with the droplet temperature and/or pressure are approximately coincident with that of Ω KH and τbu,KH . It means that the effects of pressure and temperature on the RT instability growth are similar to that on the KH instability growth. As can be seen from Figures 9 and 10, both the pressure and the drop temperature have similar effects on the KH and RT wave growth at high pressures (Pr > 1.2) and high temperatures (Tr > 0.7), but the impact of increasing pressure on the wave growth is relatively stronger than that of increasing droplet temperature at relatively low pressures (Pr < 0.8) and low temperatures (Tr < 0.63). In addition, the final Ω RT is almost coincident with the initial Ω RT , which should be explained by that the RT breakup occurs in a very short time period and is almost not affected by the mass and heat transfer. Figure 10 also shows that the variation curve of τbu,RT with the droplet temperature is almost horizontal initially. It means that at low temperatures (Tr < 0.63), the temperature variation has no effect on the inertial forces, which is caused by the notable liquid–gas density difference and induces the RT instability growth on the gas–liquid interface in the normal direction. It can also be seen in the figure that when the pressure increases, τbu,RT decreases rapidly in the initial stage and then slowly. This means that the breakup time decreases with the ambient pressure, but this effect becomes less inefficient at high pressures (Pr > 1.2).

Variations of τbu,RT and Ω RT at various ambient pressures and initial droplet temperatures.
Figure 11 depicts the effects of urel on the maximum growth rate Ω KH of KH wave and the KH breakup time τbu,KH . Figure 12 depicts the effects of urel on the maximum growth rate Ω RT of KT wave and the RT breakup time τbu,RT . The initial droplet temperature T/Tc is 0.65, and both Tam /Tc and P/Pc are 1.0. The rising rate of Ω KH increases with liquid–gas relative velocity urel as shown in Figure 11, but Ω RT increases at an almost constant rate with urel as shown in Figure 12. It indicates that with regard to the KH wave, the influence of velocity difference and momentum exchange on aerodynamic forces becomes much stronger with urel increasing. However, with regard to the growth of RT instability, increasing urel has less influence on the inertial force induced by liquid–gas density difference. Figure 11 also shows that Ω KH continues to increase as time progresses, especially obvious at high relative velocities. This is due to the fact that strong convection enhances the heat transfer from gas phase to liquid phase and the mass diffusion, which leads to a significant change in thermophysical properties and promotes the wave instability growth on the droplet surface in the tangential direction. As shown in Figures 11 and 12, the falling rates of both τbu,KH and τbu,RT decrease continuously with urel . This is because the enhanced instability growth leads to increased breakup rates and shortened breakup times when urel increases; meanwhile, more droplets are stripped from the parent droplet resulting in an increased breakup duration. Due to the comprehensive effect, the breakup time varies more slowly with urel . Since τbu,RT is very small, there is no significant change in thermophysical properties, and thus the final Ω RT is almost coincident with the initial Ω RT as shown in Figure 12.

Variations of τbu,KH and Ω KH with urel .

Variations of τbu,RT and Ω RT with urel .
Figure 13 depicts the minimum ambient pressure required for RT breakup, which is also the maximum ambient pressure required for KH breakup, as a function of initial droplet temperature. Figure 13 presents the boundary between KH breakup and RT breakup, in terms of initial droplet temperature and ambient pressure. Since the breakup time is very short, the ambient temperature has a relatively muted impact on droplet breakup, and thus the ambient temperature Tam /Tc is set at 1.0, and urel is 40, 70, and 100 m/s, respectively. Any point above the curve indicates that the RT breakup will occur during the droplet lifetime. Otherwise, any point below the curve indicates that only the KH breakup can occur. The minimum ambient pressure required for RT breakup, which is also the pressure boundary between KH breakup and RT breakup, decreases with the initial droplet temperature. The RT breakup is more likely to occur if the droplet evaporates in a strongly convective and transcritical environment.

Minimum ambient pressure required for RT breakup at various droplet temperatures and urel .
Conclusion
Immediately after leaving the nozzle hole, the jet starts to break up and forms a spray composed of large droplets. The KH model theory and the RT model theory are used to simulate the second breakup characteristics of these droplets at high and low velocities, respectively. Thus, studies of the KH and RT instabilities and breakup are important to obtain boundary conditions for droplet breakup and breakup times, which directly affect the local droplet sizes and local droplet evaporation rates in the spray field and fuel–air mixing rates. In addition, drag acceleration affects droplets trajectories and velocities, which directly determine the spray penetration.
Therefore, a numerical model describing droplet breakup, instability, and drag suitable for transcritical conditions are developed in this article. The developed model and the results are very important for the more accurate numerical simulation and the optimization of mixture formation (i.e. spray and air mixing process) and combustion. The conclusions of this article are as follows:
The drag acceleration decreases initially and then increases significantly with the initial droplet temperature increasing, but always increases at a constant rate with ambient pressure.
The influence of pressure and temperature on the RT instability growth is similar to the influence of those on the KH instability growth.
The pressure and the drop temperature have similar influence on the KH and RT wave growth at high pressures (Pr > 1.2) and high temperatures (Tr > 0.7), but the pressure affects the instability growth more strongly at relatively low pressures (Pr < 0.8) and low temperatures (Tr < 0.63) than the droplet temperature.
The temperature affects the surface instability growth significantly at high levels of drop temperatures (Tr > 0.7), but has no effect on the instability growth at low temperatures (Tr < 0.63).
The breakup time decreases with the ambient pressure, but this effect is less inefficient at high pressures (Pr > 1.2).
The RT breakup is more likely to occur when the droplet evaporates in a strongly convective and transcritical environment.
Footnotes
Appendix 1
Academic Editor: Mohammad Reza Salimpour
Declaration of conflicting interests
The authors declare that there is no conflict of interest.
Funding
This study was funded by the National Natural Science Foundation of China (grant number 50606014) and the Natural Science Foundation of Beijing Municipality (grant number 3132021).