
Abstract
The semi-solid compressive deformation behavior of Ti–Cu alloys was investigated by Gleeble-3500 hot simulator at the deformation temperatures ranging from 1273 to 1473 K with strain rates ranging from 5×10⁻³ to 5×10⁻¹ s−1. The relationship between Cu concentration and flow stress was analyzed, and the deformation apparent activation energy was also calculated. The results show that Cu concentration has significant influence on the flows’ behavior of Ti–Cu alloys, especially at high semi-solid deformation temperatures. The Ti–14Cu exhibits the highest flow stress at 1273 and 1373 K, Ti–2.5Cu alloy exhibits the highest flow stress at 1473 K, and Ti–7Cu alloy shows the lowest flow stress at all tested temperatures, which corresponds to liquid fraction caused by varied Cu concentration and the deformation temperature. The difference in microstructure suggests that the shape and distribution of Ti2Cu precipitates are significantly affected by Cu concentration. The increase in Cu concentration leads to the growth and precipitation of acicular Ti2Cu along grain boundaries at high semi-solid deformation temperatures. The deformation apparent activation energy of Ti–14Cu alloy significantly decreases from solid deformation to semi-solid deformation owing to the change in main deformation mechanism from plastic deformation of solid particles to solid particles’ slippage and rotation of grain boundaries.
Introduction
Semi-solid metal forming (SSF) was first explored by Flemings 1 at Massachusetts Institute of Technology (MIT) in the early 1970s. Different from the conventional metal forming, alloys implemented to forming process need to be heated to solid and liquid phases’ coexisting temperatures. This technology offers several conceivable advantages over the conventional casting, forging, and rolling, such as low deformation resistance, excellent mechanical properties, and near net-shaped forming.2,3 A number of researches on SSF have been carried out by many research institutes all over the world. Until now, SSF technique has been mainly used to produce low melting point alloys including Al alloys,4,5 Mg alloys,6,7 and steel. 8 However, the SSF of titanium and its alloys that are considered to be important structure metal materials is not extensively studied because of the high melting point. The SSF technique for titanium and its alloy has great differences from that of the low melting point alloys, for example, (1) the coexistent region of solid–liquid phases for many titanium alloys is smaller, (2) the temperature of the coexistent region is higher, and (3) the control precision of semi-solid temperature and liquid fraction is difficult to ensure.9,10 Because of the foregoing reasons, less progress has been made on semi-solid deformation and processing of titanium alloys. Until recently, Zhao et al.11,12 and Chen et al.13,14 in our research group reported that the semi-solid oxidation and deformation of α+Ti2Cu alloy were quite different from the conventional one. However, no further work on the exact effect of Cu concentration on semi-solid deformation behavior of Ti–Cu alloy has been carried out, since the Cu composition plays an important role during the deformation.15–17 In order to lucubrate the knowledge of semi-solid compressive deformation characteristics of titanium alloys, a comprehensive study was carried out to focus on the influence of Cu concentration on compressive deformation of Ti–Cu alloys (Cu = 2.5, 7.0, and 14.0 wt%) in this article, which would provide bases for the applications of semi-solid processing technology for titanium and its alloys.
Experimental procedure
Ti–Cu alloy with three different concentrations of copper (2.5, 7.0, and 14.0 wt%) used in this article is a α+Ti2Cu-type titanium alloy; the microstructure of the Ti–Cu alloys is shown in Figure 1 and the chemical composition of the experimental alloys is presented in Table 1. The melting point of Ti2Cu is 1263 K. If the deformation or testing temperature rises above 1263 K, Ti–Cu alloys will change to the semi-solid state.

The microstructure of casting Ti–Cu alloys: (a) Ti–2.5Cu, (b) Ti–7Cu, and (c) Ti–14Cu alloy.
Chemical compositions of Ti–Cu titanium alloy.
The quenching experiment and image analysis were used to evaluate the solid fraction of the alloy. In order to obtain the representative results, at least three quenching experiments were carried out at the same condition. The optical microscope (OM) images from the quenched microstructures were observed at low magnification (×50) to minimize the error from the inhomogeneous distribution of phases. Three cross sections were examined for every specimen and at least five images of each cross section were analyzed and identified by the image analyzer in order to obtain a statistical accuracy. The quenching condition is the same as the deformation condition, including temperature, held time, heating rate, and cooling medium. Then, the solid fraction with temperature was evaluated based on quantitative metallography using SISC IAS V8.0 Image Analyzing System and is presented in Table 2.
Solid fraction and as a function of temperature (onset of melting temperature is 1263 K).

The cylindrical specimens with 12 mm in height and 8 mm in diameter were prepared and machined by electron discharge machining and parallel to the billet before semi-solid compression tests. And then the specimens were performed on a thermal–mechanical simulator (Gleeble-3500) under isothermal compression at strain rates of 0.005, 0.05, 0.5, and 5 s−1 and at temperatures of 1223, 1273, 1373, and 1473 K. The temperature was recorded by a transient recorder and regulated in the range of ±1 K. The specimens were heated to processing temperatures at a rate of 30 K s−1 and then held for 2 min before deformation to achieve temperature homogeneity. The specimens were compressed in a vacuum environment with a compression ratio of 50%. Finally, the specimens were quenched in water to retain the deformed microstructure. In order to reduce friction and maintain uniform deformation, two pieces of thin tantalum sheets were placed between the specimen and die.
The specimens were selected from central regions of the specimens and then etched by Keller’s reagent (10 mL HF+25 mL HNO3+15 mL HCl+500 mLH2O). The microstructure of the deformed alloys was conducted by OM (Olympus/GX71).
Results and discussion
Semi-solid deformation of Ti–Cu alloy at different temperatures
The relationship between the flow stress–strain of Ti–Cu alloys and the deformation temperatures is shown in Figure 2. The stress–strain curves exhibit a similar isothermal compressive characteristic of the Ti–Cu alloys; the flow stress decreases with the increase in strain after peak flow stress and reaches to a steady flow stress at the end of deformation. The increase in flow stress is associated with work-hardening effect, which leads to the increase in dislocation density and results in a rapid increase in flow stress. The decrease in flow stress is related to the dynamic softening effect which consumes dislocations and results in low flow stress. 18 Furthermore, it can be seen that the deformation temperature has a significant influence on flow stress at the same strain rate. The flow stress decreases with the increase in the deformation temperature at a given strain rate. It is found from Table 2 that more liquid precipitates at higher temperature; this leads to a lubricant effect during deformation and causes the decrease in flow stress.

Stress–strain curves of Ti–Cu alloy with different temperatures at strain rates of 0.05 s−1: (a) Ti–2.5Cu, (b) Ti–7Cu, and (c) Ti–14Cu alloy.
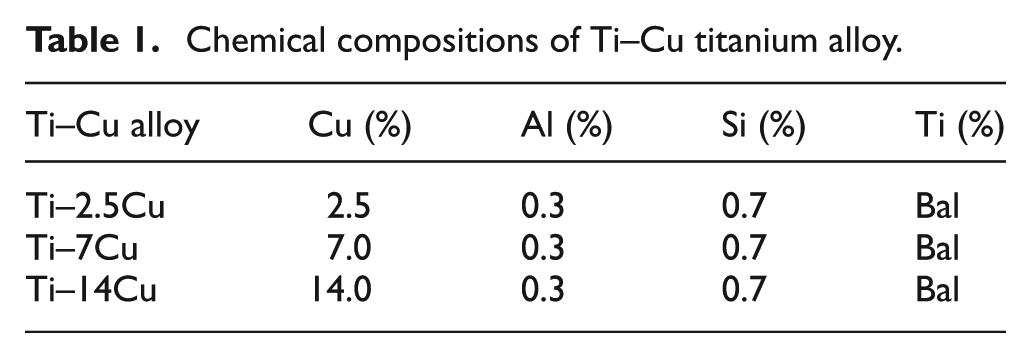
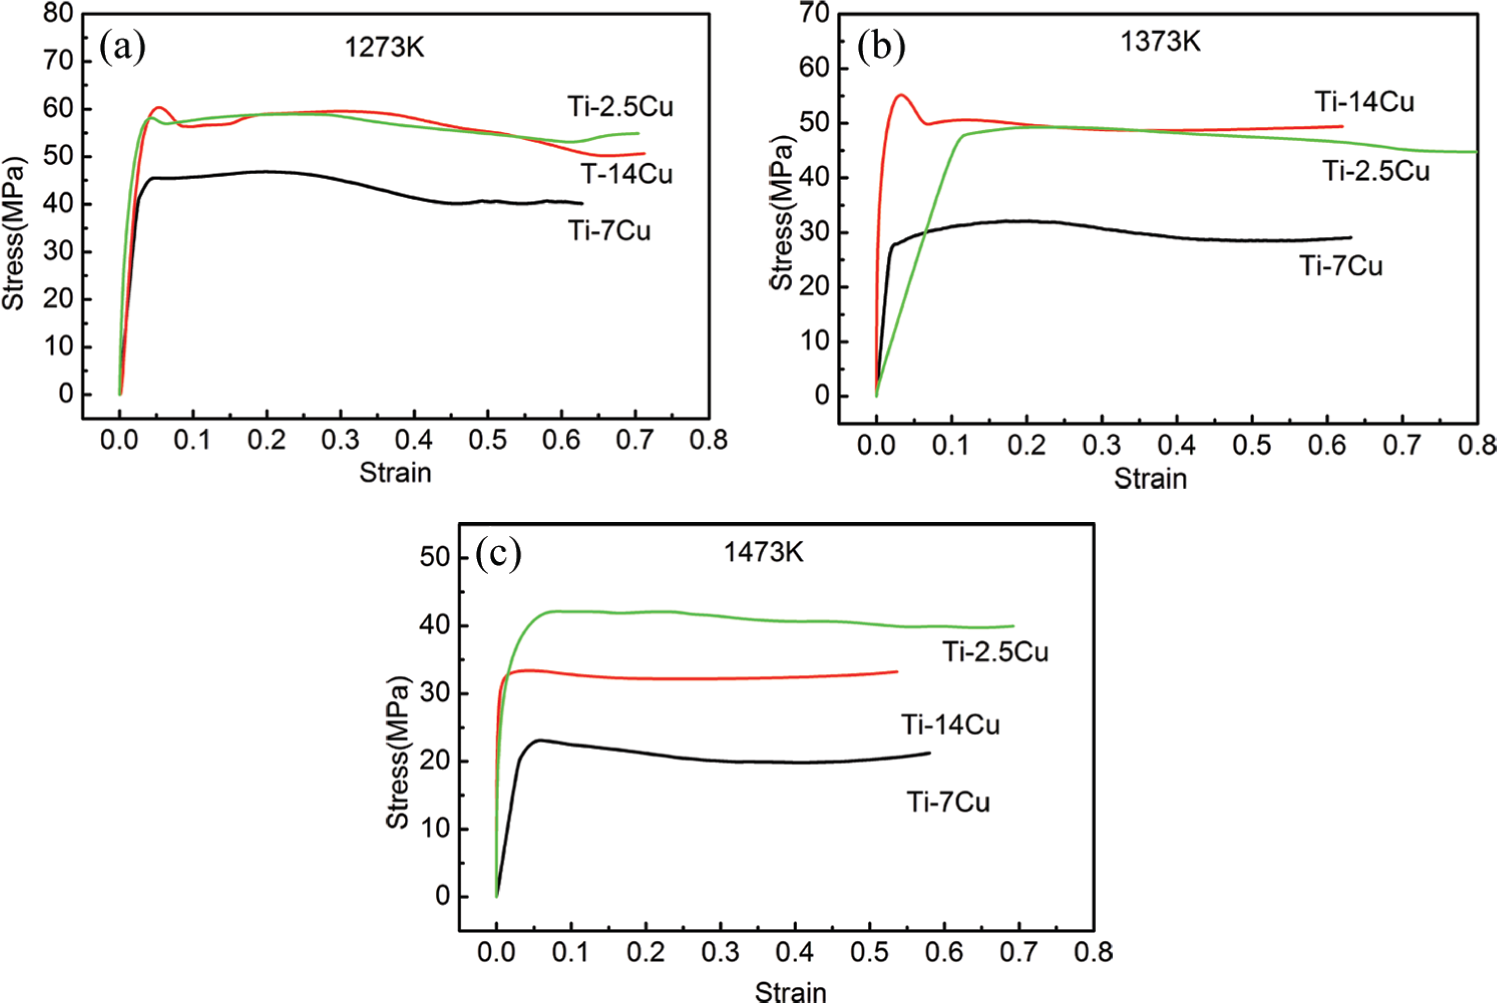
Figures 3 and 4 show flow stress–strain curves and peak/steady stress with different Cu concentrations at different semi-solid temperatures. It can be observed from Figure 3 that Ti–14Cu alloy exhibits the highest flow stress at 1273 and 1373 K, and Ti–2.5Cu alloy has the highest flow stress at 1473 K. Ti–7Cu alloy exhibits the lowest flow stress in all tested samples especially at high temperatures. The peak flow stress and steady flow stress exhibit a distinct difference at various Cu concentrations, which indicates that the softening rates after peak flow stress are different due to the different softening mechanisms.
Stress–strain curves of Ti–Cu alloy at strain rates of 0.05 s−1: (a) 1273 K, (b) 1373 K, and (c) 1473 K.
Peak stress and steady stress of Ti–Cu alloy at strain rates of 0.5 s−1: (a) peak stress and (b) steady stress.
Semi-solid deformation of Ti–Cu alloy at different strain rates
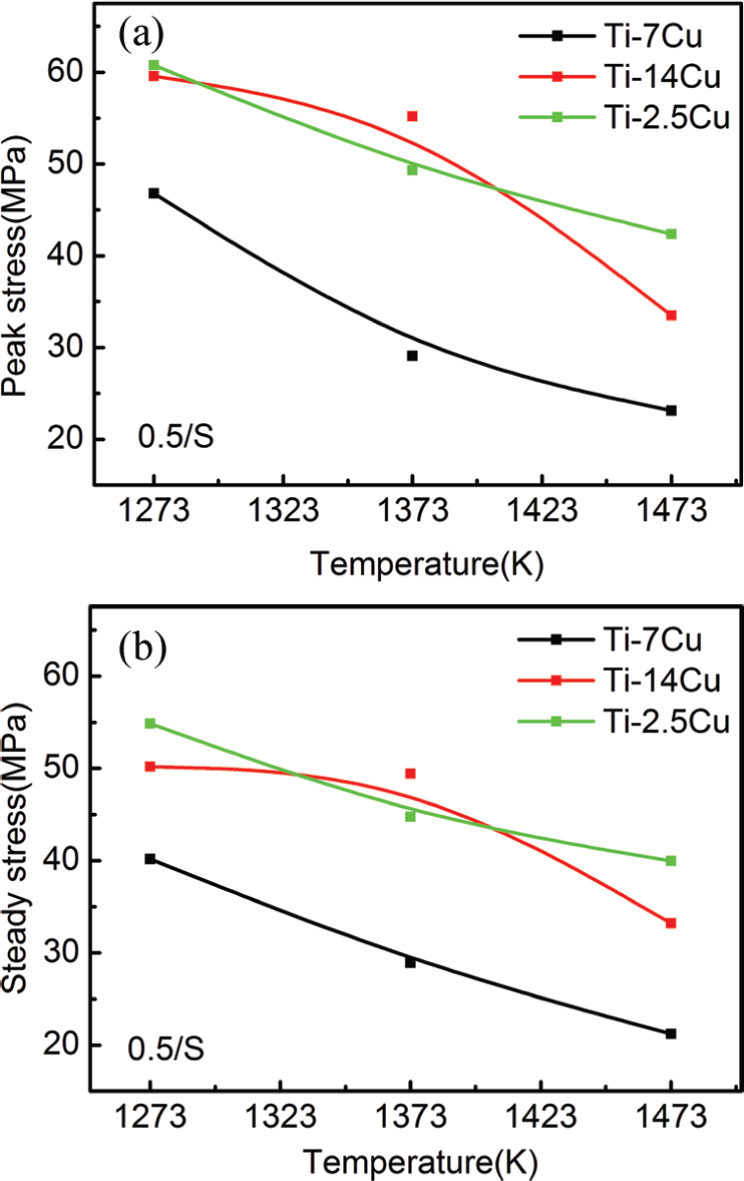
The true stress–strain curves of Ti–Cu alloys after isothermally compressed at strain rates ranging from 0.005 to 5 s−1 are illustrated in Figure 5. As can be seen, the flow stress increases with the increase in strain and then becomes smooth after reaching the maximum value. 19 The flow stresses of Ti–2.5Cu alloy at 0.05 and 0.5 s−1 and Ti–14Cu alloy at 0.05 and 0.005 s−1 are almost equal at 1373 K, which is associated with the different solid fraction and the response time during deformation. An unobvious lubricant effect in Ti–2.5Cu alloy is obtained under strain rates of 0.05 and 0.5 s−1 at 1373 K due to the low liquid fraction. For Ti–14Cu alloy, more liquid exists in grain and grain boundaries compared with that of Ti–2.5Cu alloy at 1373 K, and the low strain rate (0.05 and 0.005 s−1) provides enough response time and lower liquid flow rate to achieve the deformation, which, in turn, creates the similar lower stress to resist further deformation.
Stress–strain curves of Ti–Cu alloy with different strain rates at 1373 K: (a) Ti–2.5Cu, (b) Ti–7Cu, and (c) Ti–14Cu alloy.
Through the analysis of the flow curves and peak stress under different Cu concentrations (as shown in Figures 6 and 7), it can be concluded that Cu concentration has a significant influence on the flow stress. Ti–14Cu alloy exhibits the highest peak stress and steady stress at low strain rate (0.005 s−1) and high strain rate (5 s−1) compared with the other tested specimens, similar to that of Ti–2.5Cu alloy. The Ti–7Cu alloy shows the lowest peak stress and steady stress among all the tested samples at strain rates from 0.005 to 0.5 s−1, which is the same as Ti–2.5Cu alloy at the strain rate of 5 s−1. This is considered to be associated with the different solid fraction and the variation in deformation mechanisms.

Stress–strain curves of Ti–Cu alloy at 1373 K: (a) 0.005 s−1, (b) 0.05 s−1, and (c) 0.5 s−1.

Peak stress and stability stress of Ti–Cu alloy at 1373 K: (a) peak stress and (b) steady stress.
Correlation of microstructure with Cu concentration
X-ray diffraction (XRD) patterns corresponding to samples with different Cu concentrations and semi-solid deformation conditions are shown in Figure 8. Only α-Ti and Ti2Cu precipitate phases are found after semi-solid deformation and no β phase is observed, in accordance with the research 15 on casting of Ti–Cu alloy which mentions that the eutectoid reaction of this alloy is rapid and no β phase will be formed.

XRD traces of Ti–Cu alloys with different deformation temperatures: (a) Ti–2.5Cu, (b) Ti–7Cu, and (c) Ti–14Cu.
The effects of Cu concentration and semi-solid deformation temperature on the microstructural features can be observed clearly from the optical micrographs, as shown in Figure 9. Compared with the casted Ti–Cu alloys (Figure 1), the Ti2Cu precipitates both in grains and along grain boundaries in all semi-solid deformed specimens. And more acicular Ti2Cu tends to precipitate along grain boundaries at higher semi-solid temperature and/or higher Cu concentration, which accelerates the formation of precipitated zones along grain boundaries and finally forms net structures in Ti–14Cu alloy after deformation at 1473 K. Generally, the results suggest that the morphology and distribution of the Ti2Cu precipitates are significantly affected by Cu concentration, especially at high deformation temperatures. The increase in Cu concentration will lead to the growth and precipitation of acicular Ti2Cu along grain boundaries at high deformation temperatures and results in net structures.

Micrographs of the Ti–Cu alloy during semi-solid compression with different conditions: (a) different temperatures and (b) different strain rates.
Besides semi-solid deformation temperature, strain rate also significantly affects the microstructure of the semi-solid deformed Ti–Cu alloys. As shown in Figure 9(b), it is difficult for Ti2Cu to precipitate along the grain boundaries at high strain rates, whereas less precipitated zones are observed at a high strain rate, especially at low Cu concentrations. The precipitation of acicular Ti2Cu along grain boundaries is prone to occur probably because of the segregation of liquid. 20 Under higher strain rates and lower Cu concentrations, less liquid segregate to grain boundaries resulting in less precipitation of acicular Ti2Cu along grain boundaries.
Apparent activation energy for semi-solid deformation of Ti–Cu alloy
The deformation apparent activation energy represents the energy barrier for atomic transition between crystal lattices and reflects the difficult degree of thermal deformation. The relationship between deformation apparent activation energy (Q) and deformation parameters can be represented by the Arrhenius equation 21

where A, α, and n are constants; R is the gas constant; Q is the deformation apparent activation energy; ε is the strain rate; and T is the deformation temperature. Taking logarithm of equation (1), the deformation apparent activation energy (Q) can be expressed as follows

The stress exponent (n) can be given as follows

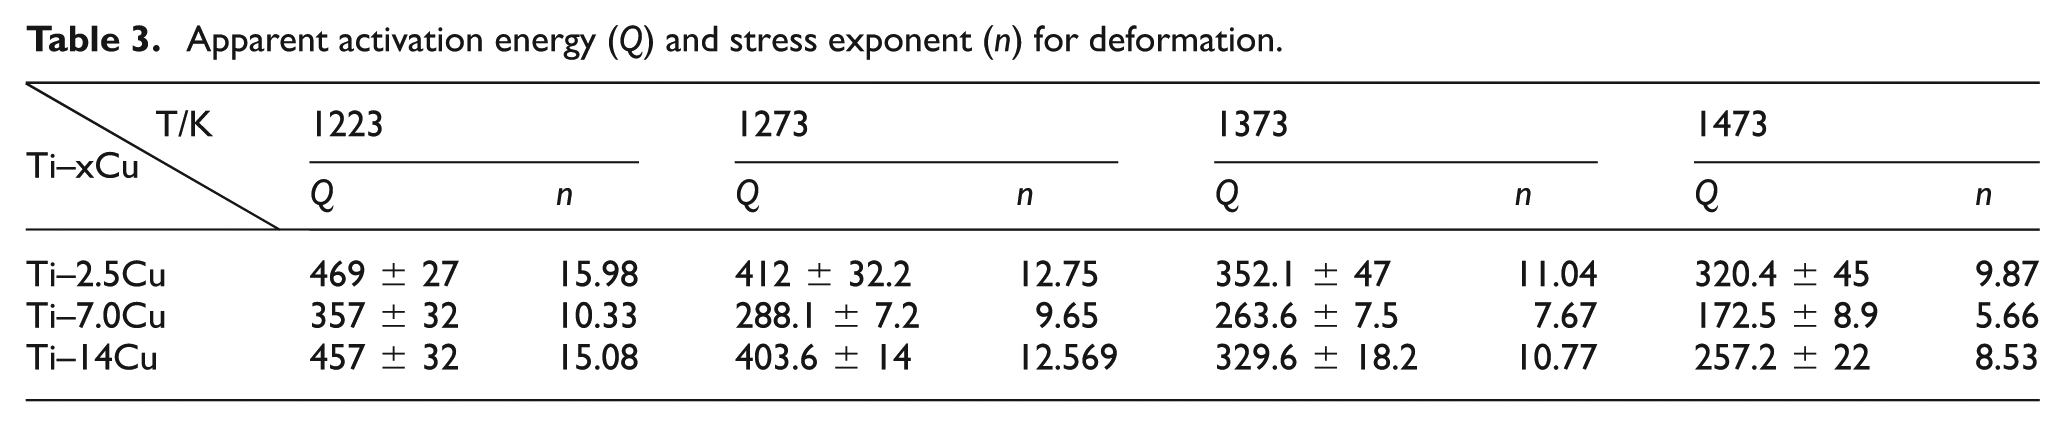
Based on the results of semi-solid flow behavior of Ti–Cu alloys, the variation in the deformation apparent activation energy (Q) and stress exponent (n) against temperature and Cu concentration is illustrated in Table 3. It can be seen from Table 3 that Ti–2.5Cu and Ti–7Cu alloy exhibited the highest and the lowest deformation apparent activation energy, respectively, among all isothermally compressed Ti–Cu alloys, especially at high temperature (1473 K, Ti–2.5Cu, 320.4 ± 45 kJ mol−1; Ti–7Cu, 172.5 ± 8.9 kJ mol−1). The deformation apparent activation energy of Ti–2.5Cu alloy deformed in solid state (1223 K) and semi-solid state (1473 K) decreases from 469 ± 27 to 320.4 ± 45 kJ mol−1, and Ti–14Cu alloy decreases from 457 ± 32 to 257 ± 22 kJ mol−1 in the same condition. The difference in deformation apparent activation energy is contributed to change in deformation mechanisms.
Apparent activation energy (Q) and stress exponent (n) for deformation.
Deformation mechanism of Ti–Cu alloy during semi-solid deformation
During the semi-solid deformation, due to the existence of liquid phase, the main deformation mechanisms are proposed as the flow of liquid incorporating solid particles (FLS) mechanism and sliding between solid particles (SS) mechanism. 9 On one hand, liquid phase can relax the stress concentration of grain boundaries. On the other hand, liquid atoms penetrate into holes by diffusion during semi-solid deformation and hinder the holes to cluster. Accordingly, the deformation capacity of Ti–Cu alloys increases. The external force that the liquid phase needs is smaller than that of solid phase, which is considered to be the main reason for the lower deformation apparent activation energy (Q) in semi-solid deformation.
The Ti–7Cu, Ti–14Cu, and Ti–2.5Cu alloys exhibit different flow stress because of the difference in solid fraction. As seen in Table 2 and Figure 9, Ti–14Cu alloy contains more liquid than the other alloys at the same temperature, and the liquid disperses continuously along grain boundaries at 1373–1473 K. The main deformation is considered to be solid particles’ slippage and rotation of grain boundaries (SSR) (Figure 10), which corresponds to a decrease in deformation apparent activation energy (Q) and stress exponent (n). Oppositely, high solid fraction in Ti–2.5Cu alloy is found at 1273 and 1373 K during deformation, and the microstructure exhibits plastic deformation of solid particles (PDS) because of the less liquid phase, which corresponds to higher flow stress, apparent activation energy (Q), and stress exponent (n) than the other two alloys. The Ti–7Cu alloy shows the lowest flow stress, apparent activation energy (Q), and stress exponent (n) among all tested alloys for its eutectoid microstructure and liquid phase. Moreover, the Ti–7Cu alloy contains less volume fraction of α phase than the other two alloys, and α phase transforms into β matrix above the β+L temperature during semi-solid deformation. Therefore, it can be concluded that the flow stress of Ti–7Cu alloy decreases with the decrease in volume fraction of α phase at certain strain rate.

Solid particles’ slippage and rotation of grain boundaries (SSR) during semi-solid deformation.
Meanwhile, it can also be observed from Figures 6 and 7 that the flow stress increases with the increase in strain rate at a certain deformation temperature for all tested samples. It can be estimated that the dislocation density increases along with the increase in strain rate, and the tangled dislocation structure prevents the movement of dislocation and results in the high flow stress accordingly.
Conclusion
The semi-solid compression of Ti–Cu alloy is conducted at deformation temperatures ranging from 1273 to 1473 K with strain rates ranging from 5×10⁻³ to 5×10⁻¹ s−1. According to the analysis on the flow behavior, deformation apparent activation energy, and microstructure, the conclusions can be summarized as follows:
The Cu concentration has significant effects on the flows’ behavior of Ti–Cu alloys. Ti–2.5Cu and Ti–7Cu exhibit the highest and the lowest flow stress among all tested samples, respectively, especially at high temperatures, which correspond to an increase in liquid phase caused by different Cu concentrations.
The difference in microstructure under different Cu concentrations and deformation conditions suggests that the morphology and distribution of Ti2Cu precipitates are significantly affected by the Cu concentrations, especially at high semi-solid deformation temperatures. The increase in Cu concentration accelerates the precipitation of acicular Ti2Cu along grain boundaries at high semi-solid deformation temperatures, resulting in the net structures.
The deformation apparent activation energy of Ti–Cu alloys in semi-solid state is higher than that in solid state. The deformation apparent activation energy for Ti–14Cu alloy decreases from 457 ± 32 kJ mol−1 (solid deformation at 1223 K) to 257 ± 22 kJ mol−1 (semi-solid deformation at 1473 K) owing to the change in main deformation mechanism from PDS mechanism to SSR mechanism.
Footnotes
Academic Editor: Liyuan Sheng
Declaration of conflicting interests
The authors declare that there is no conflict of interest.
Funding
The authors acknowledge financial supports of the Project of 973 Program (grant no. 2007CB613807), Natural Science Basic Research Plan of China (grant no. 0520119), and Special Fund for advanced technology Research of Central Colleges (0009-2014G2310019).