
Abstract
To understand the effects of liquid morphology on the apparent transfer properties of porous media formed by stacked particles, the authors investigate the particles’ aggregation state, apparent volume, thermal conductivity, and electrical conductivity of wet stacked glass beads. It shows that the liquid mainly exists as liquid bridges when the liquid content is low and connects each other when high. The transformation of liquid morphology and distribution influences the liquid effects on particles, thus changing the aggregation state of the particles and the apparent properties of the porous media in turn. A model is developed for predicting the critical liquid content at which the liquid morphology shifts from the state of liquid bridges into the state of interconnectedness. The prediction from the model is in good agreement with the experiment.
Introduction
Heat transfer performance of porous media plays an important role in fields such as energy, environment, agriculture, and metallurgy.1,2 Researches on heat transfer of porous media show that the thermal conductivity depends on solid component, porosity, and material structure. 3 However, the researches on transfer process of porous media are mostly based on macro-averaging method while ignoring the details inside the media at pore scale. 4 Studies on thermal conductivity of soil, rock, or other similar porous media indicate that the influence of particle size, liquid morphology, porosity, pore size, and moisture content should be taken into consideration.1,5,6 But many researches on the thermal conductivity of porous media focus more on the pore scale and moisture content and less on the influence of liquid morphology and distribution.7–9 Usowicz et al. 10 found that the morphology and distribution of liquid in wet porous media greatly influence its macro-transfer properties; hence, the pore-scale phenomena should be taken into account when studying the influence of liquid on macro-transfer performance. For example, the moisture on the skeleton surface and in the pore can be divided into bound and unbound water, and bound water is one of the important factors that affect the rheological properties of media such as soft clay.11,12 According to the differences of the connective forms of water, unbound water can be further divided into liquid bridge and interconnected water. 13 The connective mode between liquid and solid matrix mainly depends on the liquid saturation degree. 14 The existence form of liquid within porous media relates to the surface interaction between the solid matrix and liquid. For example, liquid bridges depend on the liquid content and the interacting force between liquid and skeleton.15,16 The liquid bridge force between liquid bridge and skeleton exerts an obvious influence on the particles’ accumulation state of packing porous medium. 14 However, the particles’ aggregation state affects the porous medium’s apparent volume and macro-transfer characteristics.17,18 To reveal the influence mechanism of liquid morphologies inside the porous medium on the macro-transfer characteristics of porous media, some researchers study not only the physical properties of liquid bridge but also the effects of surface tension and contact angle on micro-hydraulic characteristic. 19 Studies show that the particles’ wettability and the liquid bridge force between particles are related to the contact angle.20,21
Present studies focus more on the liquid morphology and liquid bridge force but less on the liquid morphology evolution and distribution in accordance with the change in the liquid content. To make a further study on heat and moisture transfer performance and process in particles’ stacked porous media, this article is going to research the influence mechanism of contact angle on liquid morphology and its influence on particles’ aggregation state, apparent volume, thermal conductivity, and electrical conductivity.
Experiments
Glass beads with a diameter of 0.45–0.9 mm were used as particles’ stacked porous medium, and the porosity of the sample is 39.4% in the natural packing state. Water, 0.01 mol/L NaCl solution, and 0.02 mol/L KCl solution were added into the stacked glass beads to produce samples with different liquid contents. Hypsometry method was used to measure the contact angle between water or solution and a plate glass by a contact angle meter (JGW-360B). The samples’ apparent volumes at different moisture contents were measured by a graduated cylinder. Thermal conductivity was obtained by a thermal constant analyzer (TPS 2500S). Two-electrode method was used to determine the electrical conductivity. Particles’ aggregation state was observed by a charge-coupled device (CCD; Mintron MTV-1802CB) combined with a stereo microscope (OLYMPUS SZ61TR).
Experimental results and analysis
Apparent volume and thermal conductivity
Figure 1 shows that the apparent volume and thermal conductivity at different liquid contents show similar variation tendency for the three kinds of samples. With the change in the liquid content, the apparent volume presents a trend which first increases sharply and then decreases monotonically to its original value when the samples attain saturation, while the thermal conductivity shows an undulatory increasing trend. Taking the sample mixed with water as the example, the apparent volume and thermal conductivity increase rapidly when the moisture content changes from 5% to 15% and then the apparent volume decreases, while the thermal conductivity still increases when the moisture content changes from 15% to 20%. After that, the apparent volume and thermal conductivity increase when the moisture content changes from 20% to 25%. When the moisture content varies from 25% to 30%, the apparent volume still increases while the thermal conductivity decreases slightly. The apparent volume decreases while the thermal conductivity increases rapidly when the moisture content increases from 30% to 40%. After that, the apparent volume increases while the thermal conductivity also increases slightly when the moisture content increases from 40% to 45%. Then, the apparent volume decreases rapidly while the thermal conductivity increases rapidly when the moisture content increases further.

Apparent volume and thermal conductivity versus liquid content: (a) liquid is water, (b) liquid is NaCl solution, and (c) liquid is KCl solution.
Electrical conductivity
Figure 2 shows that for the three kinds of samples, the electrical conductivity varies similarly as the liquid content increases. When the liquid content increases, the electrical conductivity increases slowly at first and then increases rapidly when the liquid content exceeds the critical point. For samples with water, NaCl solution, and KCl solution, the liquid contents that separate these two stages are 40%, 30%, and 35%, respectively.
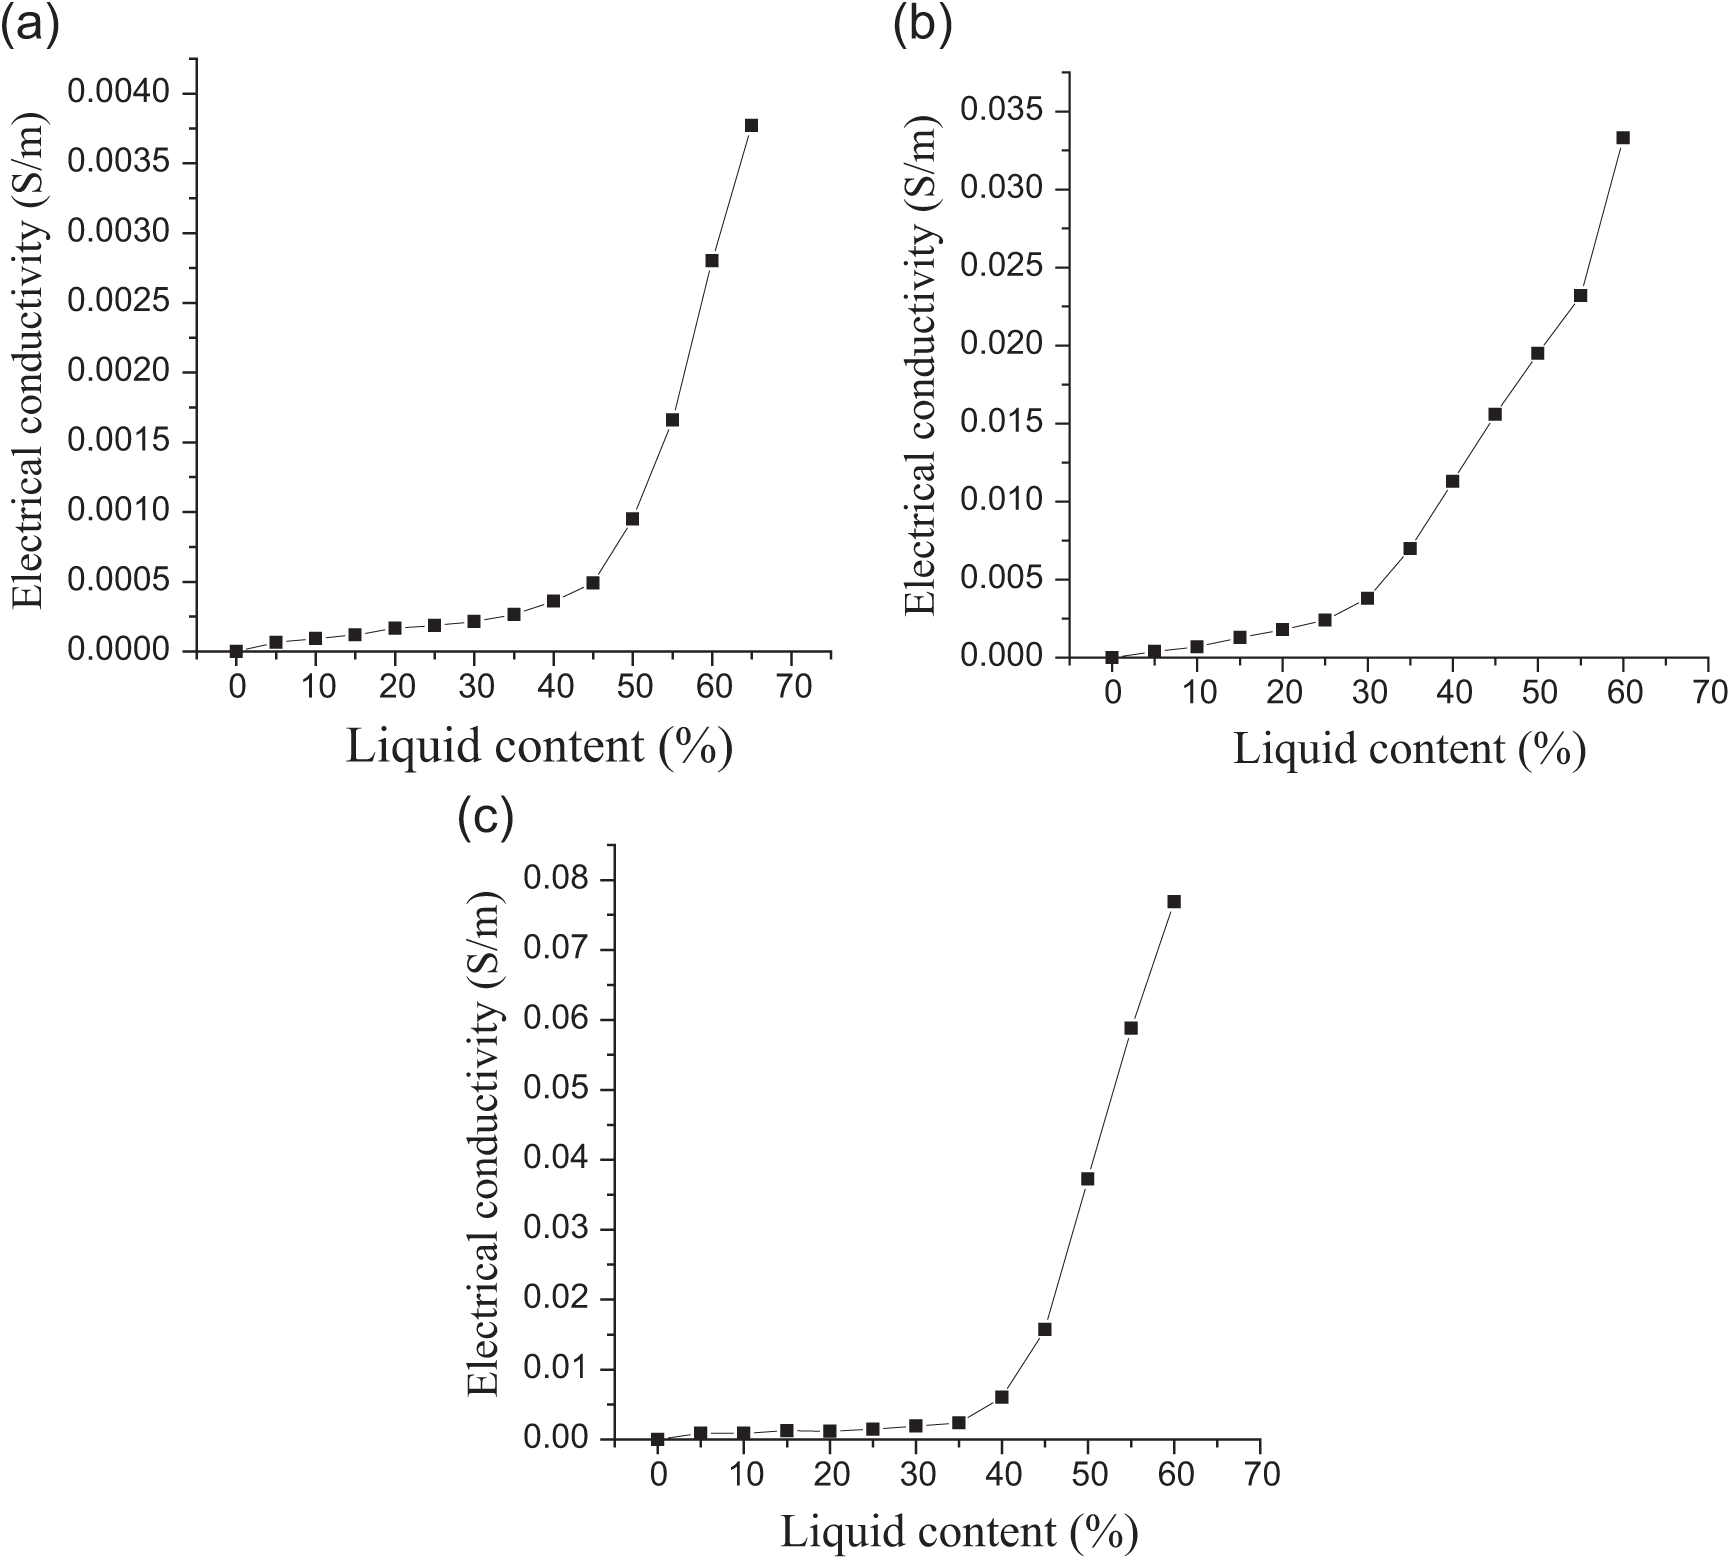
Electrical conductivity versus liquid content: (a) liquid is water, (b) liquid is NaCl solution, and (c) liquid is KCl solution.
Liquid morphology and particles’ aggregation state
As shown in Figures 1 and 2, the sample properties such as the thermal and electrical transfer characteristics and the volumes are not constant when the liquid content changes. This may be caused by the evolution of liquid morphology and distribution inside the samples with different liquid contents, so liquid morphology and distribution evolution at pore scale will be probed.
Figure 3 presents the water morphology, distribution, and particles’ aggregation state at different moisture contents. The dry sample packs loosely with no particle aggregation (Figure 3(a)). After adding water, some particles cohere together and form clusters here and there, and liquid bridges can be found between particles. When the moisture content is low (<40%), the water morphology inside the samples mainly exists as isolated liquid bridges, which become more and larger when the moisture content increases (Figure 3(b)–(e)). Some water masses other than liquid bridges appear when the moisture content is 40%, in other words, water in different pores connects each other and forms interconnected water (Figure 3(f)). Particle clusters begin to collapse when the moisture content reaches 45%; as a result, the amount of large clusters reduces and that of small clusters increases. As the moisture content increases further, more and more particle clusters collapse till they restore to the state similar to that of the dry sample when the moisture content reaches 100% (Figure 3(h)). For cases of the liquid phase being NaCl and KCl solutions, the evolution of liquid morphology and distribution inside the samples’ and particles’ aggregation state are similar to that of the liquid being water. From the experiments, it can be found that when the main existing liquid morphology changes from liquid bridge into interconnected water, the critical liquid content is about 30% and 35% when the liquid is NaCl or KCl solution, respectively. Since the pictures of samples with NaCl and KCl solutions are similar to Figure 3, they are no longer provided here.
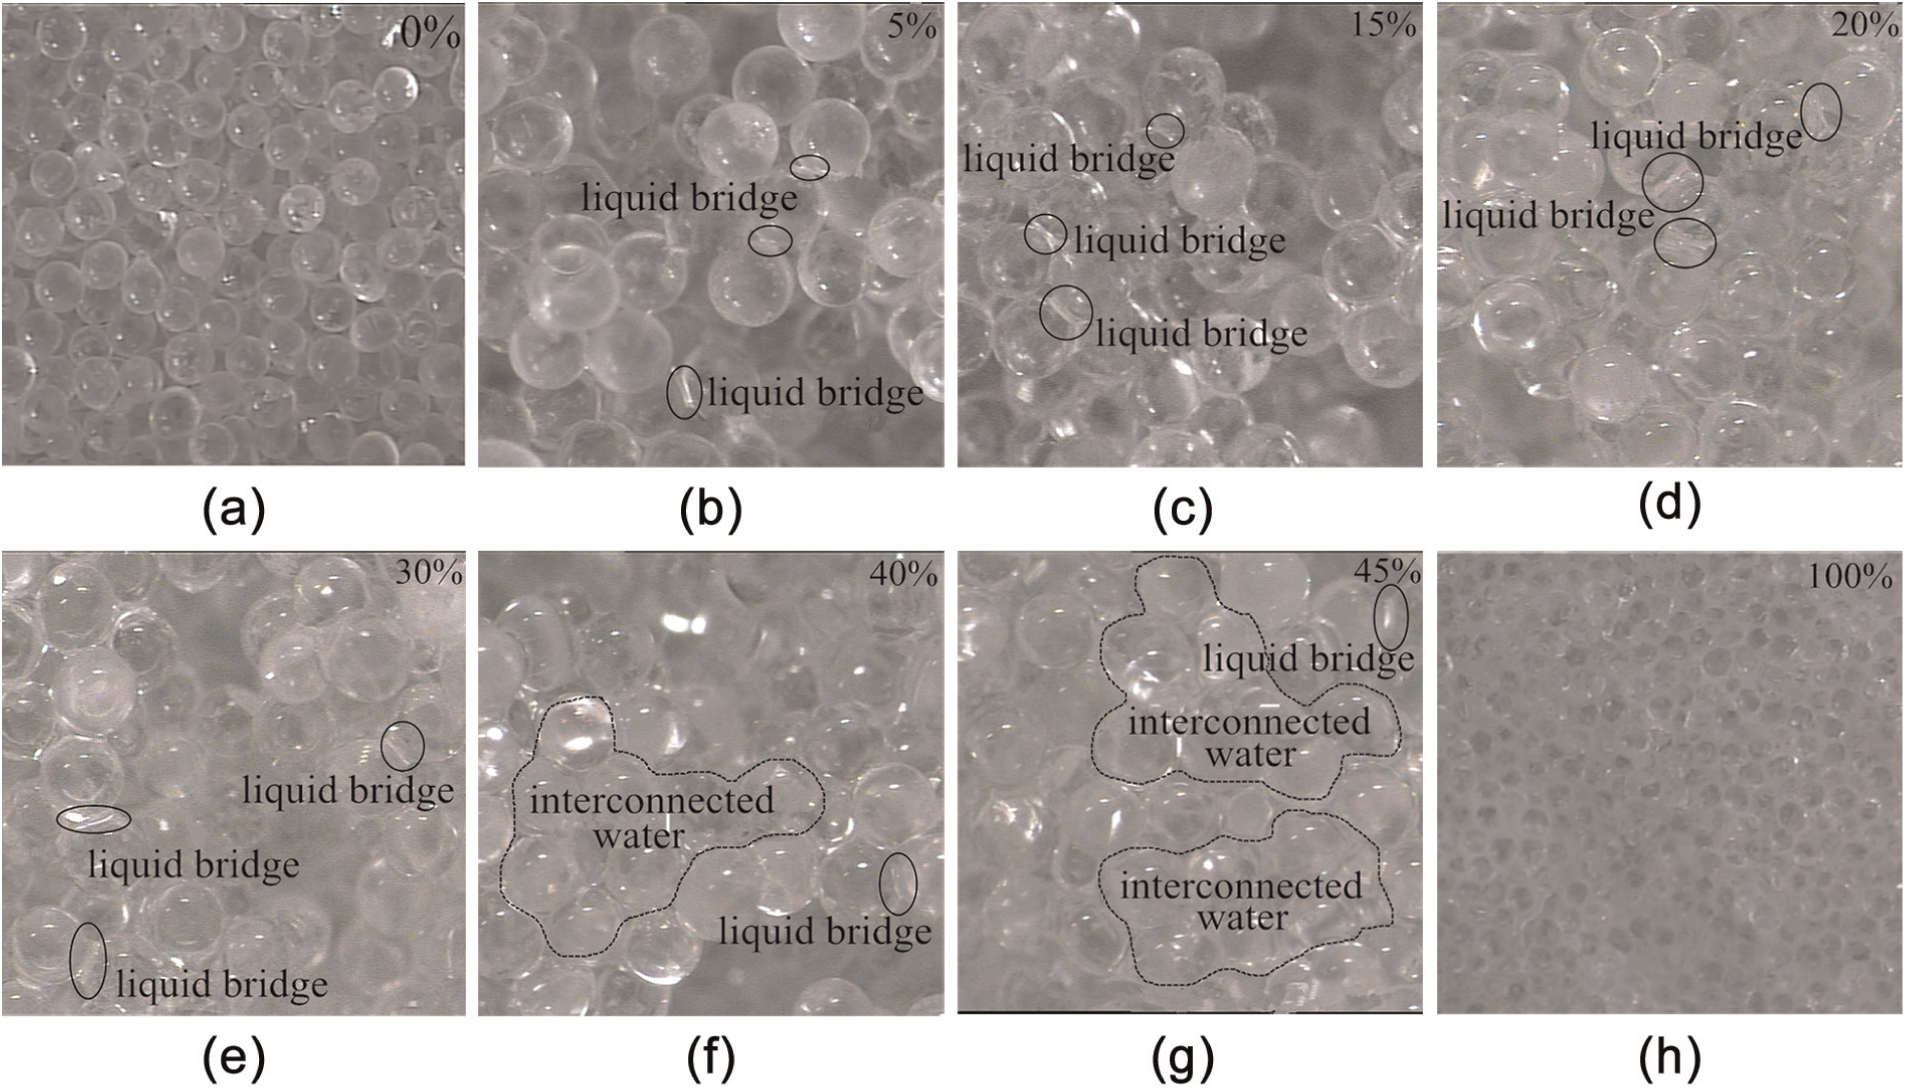
Sample with different water contents: (a) 0%, (b) 5%, (c) 15%, (d) 20%, (e) 30%, (f) 40%, (g) 45%, and (h) 100%.
Influence of liquid morphology on apparent volume, thermal conductivity, and electrical conductivity
Experiments show that the liquid existence forms and particles’ aggregation state change with the moisture content. Obviously, this will affect transfer properties of the samples. Whatever the liquid phase is, for example, water, NaCl, or KCl solution, as illustrated by the above experiments, the apparent volume, thermal conductivity, and electrical conductivity of the three kinds of samples have similar variation tendency with different liquid contents. Thus, the following analysis will take the sample mixed with water as the example to analyze the effect of liquid morphology and distribution on the apparent properties of particles’ packed porous media.
Influence mechanism of liquid morphology on apparent volume and thermal conductivity
All the particles are stacked loosely, and there is no particle aggregation in the dry sample as illustrated in Figure 4(a). As shown in Figure 4(b) and (c), many particles aggregate to form some clusters by the action of bridge force when the moisture content increases from 5% to 15%, which leads to relatively large aperture gaps emerging among the clusters. Due to the moisture content, the quantity and the size of the clusters will increase with the increase in the liquid bridges, and the aperture gaps become larger in accordance with the increase in the porosity of the sample. As a result, the apparent volume also increases. On one hand, the increase in the water content helps to increase the thermal conductivity. On the other hand, the increase in porosity has a negative effect on the improvement of thermal conductivity. During this stage, the increasing effect of water outweighs the negative effect of porosity on heat conduction, so the thermal conductivity increases.
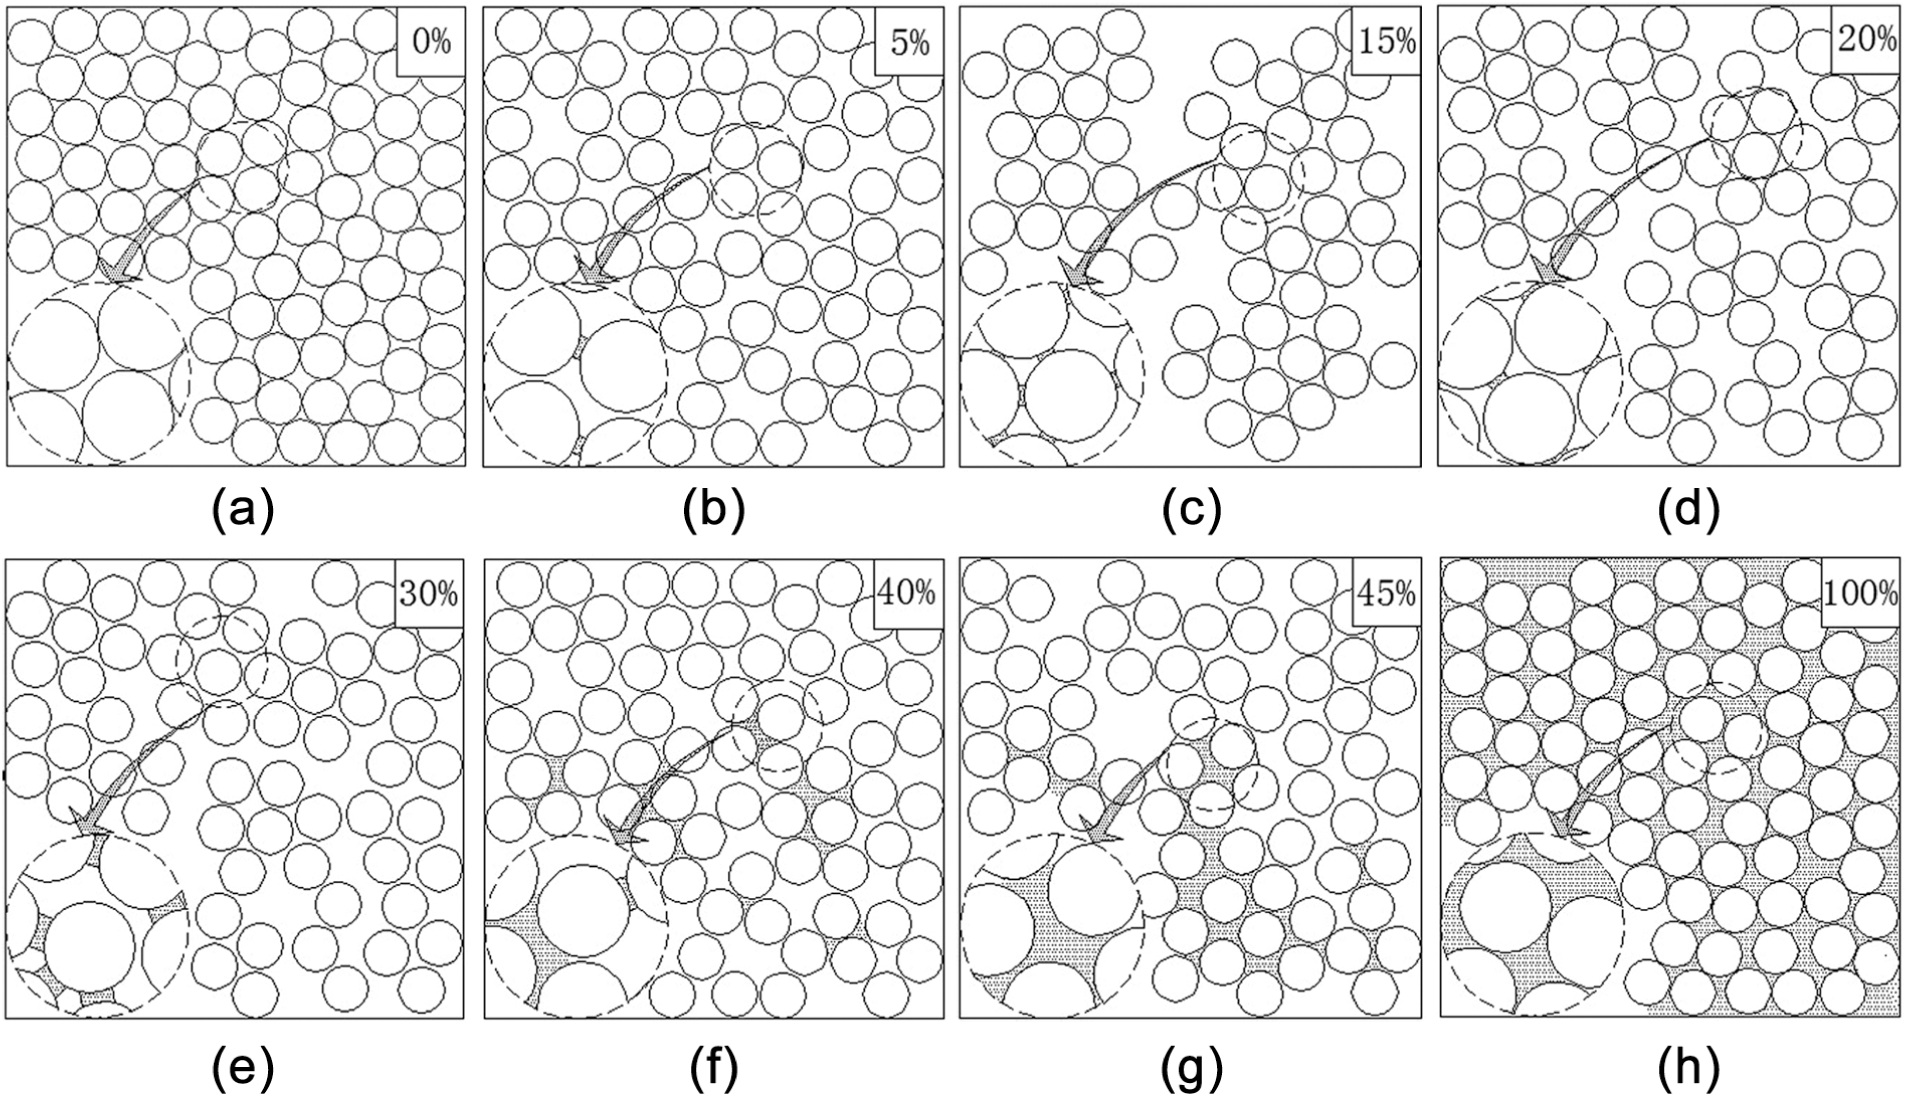
Illustration of the water distribution and particle aggregation of samples with different water contents: (a) 0%, (b) 5%, (c) 15%, (d) 20%, (e) 30%, (f) 40%, (g) 45%, and (h) 100%.
When the moisture content increases from 15% to 20%, the quantity of the liquid bridges inside particles increases and gradually distributes evenly with the increase in the water content. This results in the liquid bridge force exerting on different particles becoming more and more balanced, which leads to the number of small clusters gradually increasing and the distance between clusters decreasing slightly (Figure 4(c) and (d)). As a result, the sample’s apparent volume decreases when the porosity decreases. Thus, the thermal conductivity shows an incremental trend under the dual promotion influence of the increasing water content and decreasing porosity.
When the moisture content increases from 20% to 25%, the radius of curvature of the gas–liquid interface increases and the liquid bridges become larger, leading to the weakening of the liquid bridge pull force. Consequently, the apparent volume increases again when the mean distance between particles increases due to the weaker pull force (Figure 4(d) and (e)). At this stage, the heat conduction enhancement by the increase in moisture still outweighs the negative influence of the increase in porosity, so the thermal conductivity keeps increasing.
When the moisture content increases from 25% to 30%, the apparent volume keeps increasing. This is because the mean distance between particles increases, also induced by the weaker pull force of the liquid bridges when the water content increases (Figure 4(d) and (e)). The negative effect of porosity increase on heat conduction is a bit greater than the benefit of water increase. Therefore, the thermal conductivity slightly decreases rather than further increases.
When the moisture content increases from 30% to 40%, the liquid bridge force further decreases which leads to the gradual collapse of big clusters and the formation of much smaller ones. Because the void volume among small clusters is less than that among big clusters, the total porous volume of the sample decreases (Figure 4(e) and (f)). The result is that the sample’s apparent volume decreases. The apparent thermal conductivity shows an obvious incremental trend due to the superimposition promotion effect of water content increase and porosity decrease.
When the moisture content changes from 40% to 45%, the liquid bridges between different pores begin to connect each other, in other words, the liquid morphology begins to exist in the form of interconnected water. As the interconnected water is quite little and distributes inhomogeneously in the sample, the water capturing ability of different particles is different. As a result, water among some particles reduces while that among the others increases, which causes the unbalanced effect of liquid bridge force on different particles. Thus, some particle clusters become larger which increases the sample’s apparent volume (Figure 4(f) and (g)). The heat conduction enhancement effect of the interconnected water and water content increase is slightly greater than the negative effect of total porosity increase, so the thermal conductivity increases slightly.
When the moisture content is beyond 45%, there are more and more interconnected water emerging and less and less isolated liquid bridges existing with the increase in the water content. Particle clusters that are formed in previous stage collapse gradually with the distinct decline in liquid bridge force. So, the void between particles decreases and the sample’s apparent volume decreases gradually (Figure 4(g) and (h)). The thermal conductivity increases sharply when the water content increases and the porosity decreases.
When the moisture content is 100%, that is, all the pores are completely filled with water (Figure 4(h)), there will be no liquid bridge forces exerting on any particle, for there are no liquid bridges now. Therefore, the particles stack naturally in a loose state again like the state of the dry sample as shown in Figure 4(a). The apparent volume is almost the same as that of the dry state, and the thermal conductivity also reaches its maximum value.
Influence mechanism of liquid morphology on electrical conductivity
There is always a very thin layer of bound liquid existing on the surface of particles in wet samples regardless of the liquid content, 16 and glass beads themselves do not conduct electricity, so the electrical conductivity variation with different liquid contents reflects the variation of the liquid morphology and distribution except the thin bound layer inside the samples. The liquid mainly exists as liquid bridge at low moisture content; thus, the electric current in samples flows along with the serial route constituted by the thin bound liquid layer and the liquid bridges (shown in Figure 5). The cross area for the electron flow in low liquid content samples is relatively small and leads to a small electrical conductivity. Although the size of liquid bridges increases when the liquid content increases, the thickness of the thin bound liquid layer almost remains unchanged, which means that there will be no apparent improvement in the overall electrical capability. Therefore, the increase in the electrical conductivity is not obvious. Liquid in different pores connects each other with high moisture content, so the electric current mainly flows through the route constituted directly by interconnected liquid (shown in Figure 6) rather than the serial one connected with the bound liquid layers. Thus, the cross flow area of electron increases apparently when more and more liquid in different pores connects each other when the liquid content increases. As a result, the samples’ electrical conductivity increases rapidly with relatively high liquid content.

Illustration of the electric current flow route at low liquid content.

Illustration of the electric current flow route at high liquid content.
Contact angle and critical liquid content
Taking the sample that the liquid phase is water as the example, it can make the deduction from the above experiments as follows: When the moisture content is close to 40%, the liquid bridges’ volume is close to the maximum of the isolated liquid bridges. Although they still remain unconnected, the contact lines on a particle surface of two adjacent liquid bridges are very close. As the moisture content reaches a critical point around 40%, the contact lines of the two adjacent liquid bridges touch and merge with each other and then the interconnected water comes into being. Thus, 40% can be regarded as the critical liquid content for the sample above. However, different samples have different critical liquid contents. The contact angle which reflects the comprehensive interactive effect of the three phases (gas, liquid, and solid) has fundamental influence on the liquid morphology in pores. So, there should be an inherent connection between the contact angle and the critical liquid content. The following will analyze and discuss the relationship between them.
To simplify the analysis, here we assume that the particles are the same and the dry particles’ stacking style is face-centered cubic (Figure 7). After adding water, we assume that the stacking mode does not change, and the apparent volume change is only caused by the distance changes between particles while liquid bridges exist between particles (Figure 8). As shown in Figure 9, the particle radius is r, and the change ratio of the wet samples’ apparent volume increase ratio is a, which is compared to that of the dry sample. The distance between two adjacent particles is l.

Particles’ accumulation state when dry.

Particles’ accumulation state when liquid bridge appears.
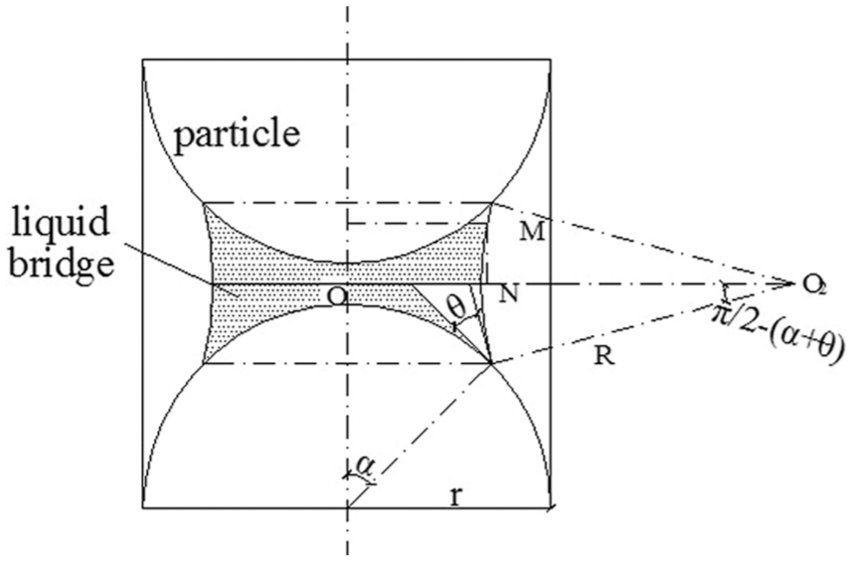
Profile of a liquid bridge with the adjacent two particles.
The relationship between l and r is

where
The average void volume possessed by each particle at dry condition is

Liquid bridges appear when some water is added into the sample, and their connection style is shown in Figure 9, where θ (θ < 45°) is the contact angle. The profile of the gas–liquid interface is assumed to be an arc with the radius of R.
The total volume of a liquid bridge and two spherical crowns of particles is given by
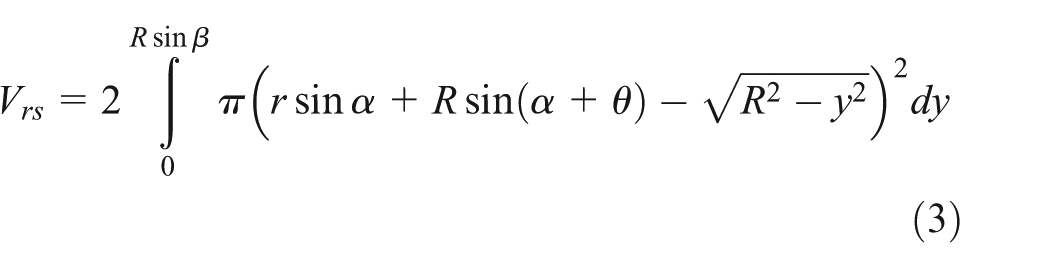
The volume of spherical crown covered by the liquid is given as follows
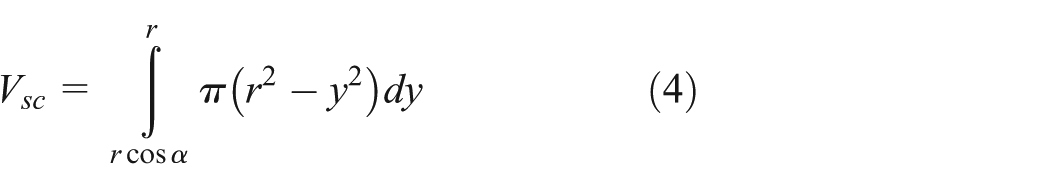
Therefore, the volume of the liquid bridge can be calculated from equations (3) and (4) as follows

The mean volume of liquid bridge possessed by a particle is 3Vl. There is α = π/4 at the condition when the adjacent liquid bridges start to touch at the critical liquid content (Figure 10). Then, the critical liquid content can be obtained as follows


Illustration of the condition when adjacent liquid bridges begin to touch.
In equation (6), m satisfies

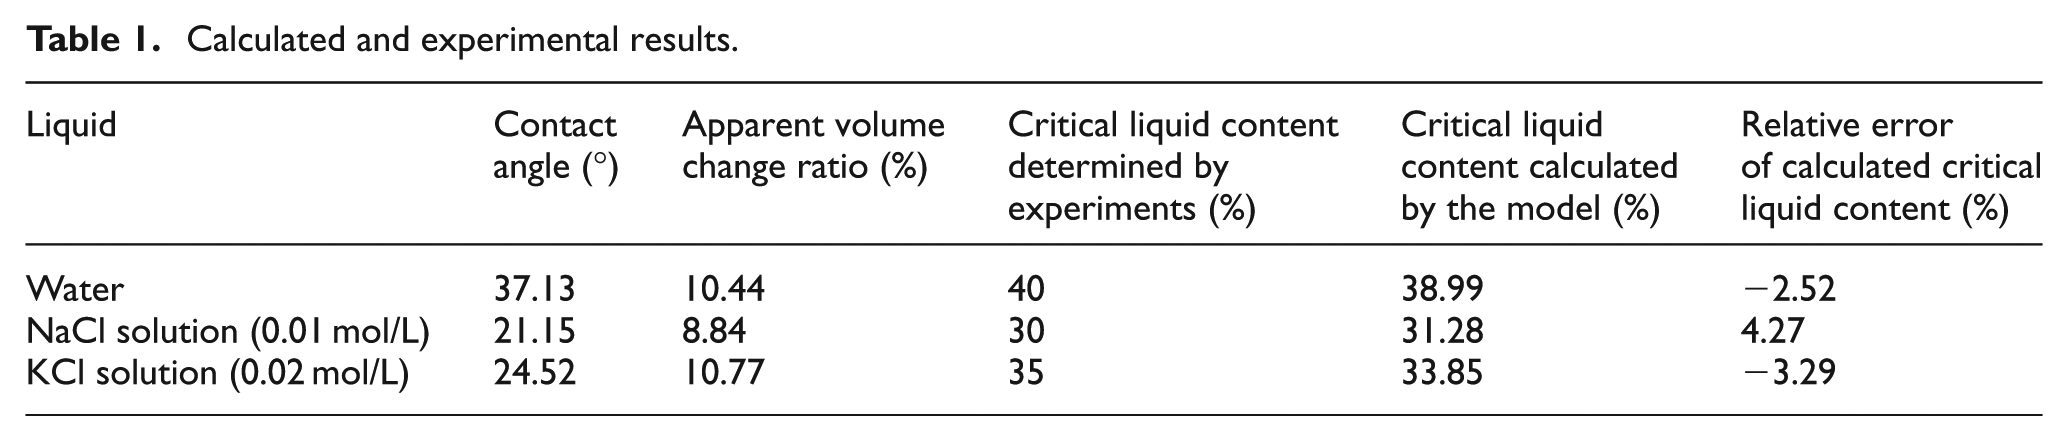
Since the contact angle on glass beads is not easy to be tested, the contact angles of the liquids on flat glass are adopted in this article. The contact angles, the apparent volume change ratio, and the critical liquid content determined by the experiments and calculated by the model are given in Table 1. The relative errors of the calculated critical liquid contents, which are compared with those determined by the experiments, are also listed in Table 1. From Table 1, it can be found that the calculated results are in agreement with the experiments, and the relative errors between them are less than 5%.
Calculated and experimental results.
Conclusion
This study has researched the influence of liquid morphology and distribution on particles’ aggregation state, apparent volume, thermal conductivity, and electrical conductivity of porous media formed by stacked particles. The liquid morphology inside the samples mainly exists as isolated liquid bridges between particles with low liquid content and as interconnected liquid when the liquid content exceeds the critical point. With the increase in the liquid content, wet sample’s apparent volume variation presents a rough tendency of an increasing trend first and then a decreasing trend, while the thermal conductivity shows an undulatory increasing trend. The electrical conductivity increases slowly with the increase in the liquid content at low liquid content. When the liquid content exceeds the critical value, the electrical conductivity improves rapidly with the increase in the liquid content. A model has been established to determine the critical liquid content from contact angle. The transformation of liquid morphology and distribution in particles’ packed porous media induces the variation of the liquid force acting on the particles. This results in the change in the aggregation state of the particles and further influences the apparent transfer properties of the porous media.
Footnotes
Appendix 1
Academic Editor: Oronzio Manca
Declaration of conflicting interests
The authors declare that there is no conflict of interest.
Funding
This work was financially supported by the National Natural Science Foundation of China (no. 51176104), the Research Grants Council of Hong Kong (GRF17207914, GRF717613, and GRF718111), and the seed funding programme for basic research of the University of Hong Kong (nos 201411159074 and 201311159187). This work was also supported, in part, by the Zhejiang Provincial, Hangzhou Municipal, and Lin’an County Governments.