
Abstract
The bond between fiber-reinforced polymer and concrete substrate plays a key role in the performance of concrete structures after strengthened by externally bonded fiber-reinforced polymer composite materials. The single shear pull-out test is generally used to determine the interface characteristics, and various bond–slip models have been proposed based on the results of this test. However, the sensitivity of the bond strength to the boundary conditions has not yet been considered in the available models in the literatures. This article presents an experimental and numerical study targeted at understanding the influence of the boundary conditions on the bond strength of the fiber-reinforced polymer/concrete interface in the single shear pull-out test. The validated finite element analysis by experimental results is used for the sensitivity study of the bond strength and stress state of the interface to the boundary conditions of the concrete block. It is found that the constraint height of the concrete block at the loaded side is an influential parameter on the stress state of the interface and the bond strength.
Introduction
Externally bonded fiber-reinforced polymer (FRP) plate/sheet for repairing/strengthening concrete structures has been widely used in civil engineering due to good material properties of FRP composite materials for this application.1–5 Main advantages of FRP composites are their very high strength- and stiffness-to-weight ratios, corrosion resistance, easy installation, and outstanding fatigue behavior. 6 Along with the advantages, the use of externally bonded FRP plates/sheets introduces a new and unique mode of failure in the strengthened structures which is FRP debonding from the concrete substrate. Debonding along the FRP/concrete interface is one of the principal failure mechanisms of concrete members externally strengthened with FRP.7–9
Although the interaction between the externally bonded FRP and the concrete substrate plays a key role in the performance of concrete structures after strengthening, there are no universally accepted standards for determining the bond behavior. Typical method of finding the bond–slip (τ-δ) behavior of the FRP/concrete interface is the single shear pull-out test. 10 In this method, the in-plane shear stress is applied to the FRP/concrete interface by applying a uniaxial tension load in the plane of the FRP, typically in the strong or longitudinal direction of the FRP fiber orientation. The tensile strain gradient in the FRP (representing the shear strain along the interface) is recorded and is used to determine the bond–slip relation.11–17 The obtained bond–slip relation is often used for nonlinear fracture mechanics or cohesive crack models in numerical analyses to predict FRP debonding from concrete substrate. Empirical and analytical equations to calculate the bond–slip relation are also developed using the results from the single shear pull-out test.
It is observed in many experimental studies that FRP debonding occurs in the concrete side at a few millimeters from the FRP/concrete interface.18–20 Therefore, the stress state of the concrete close to the interface affects the behavior of the FRP/concrete interface. Also, it is proven by numerical analyses that the FRP/concrete interface in the single shear pull-out test does not represent the case of pure shear.21,22 The boundary conditions of the concrete block is one of the parameters that can change the stress state of the concrete close to the interface and, as a result, can change the bond strength of the interface in the single shear pull-out test. The effect of the boundary conditions of the concrete block in the single shear pull-out test has not been fully investigated.
In the present study, single shear pull-out tests were conducted to find the bond strength and the interfacial fracture energy of the bonded FRP to the concrete substrate. Then, a finite element (FE) model using experimental values was validated by test results to model the FRP debonding failure in the single shear pull-out test. The validated numerical model was used to study the influence of the boundary conditions on the stress state and the bond strength of the FRP/concrete interface.
Methods determining bond–slip relationship
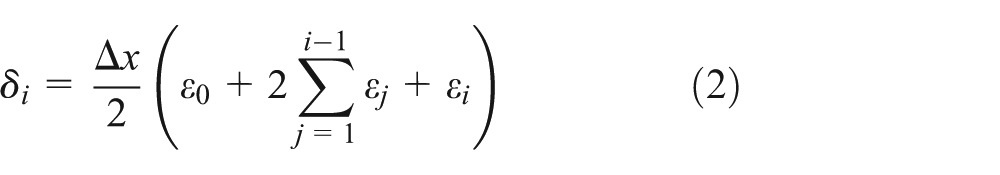
The bond–slip relationship from single shear pull-out test is commonly derived in one of two ways: (a) from direct measurement of axial strains of FRP or (b) from indirect analytical solutions modified by test results. In the former method, many strain gauges are attached with small intervals along the FRP surface as shown in Figure 1. Then, the bond stress and slip can be obtained from the following equations 10


Shear pull-out test.
where
It has been concluded from the available literature that the direct method cannot produce accurate bond–slip relationship and large irregular differences are observed among the bond–slip curves along the bonded length.10,23,24 For example, Figure 2 presents the local bond stress–slip relationships at different locations from the loaded end in a pull-out test reported by Dai et al. 10 The large scatter of the bond–slip behavior may be due to the discrete nature of concrete cracks, random distribution of concrete aggregates, local FRP composites defects during the application of strengthening system in situ such as wrinkles and scratches,25,26 and/or different concrete volumes attached to the FRP after initial damage affecting the stiffness of the debonding element. Mohammadi et al. 27 used mathematical methods called white noise and Brownian motion to model the variation of the interfacial fracture energy and a systematic method was developed to predict the load capacity variation in FRP bonded concrete specimens.

Local bond stress–slip relationships at different locations from loaded end. 10
A more stable analytical method to determine the bond–slip behavior of the FRP/concrete interfaces through single pull-out bond tests, without the necessity of recording the strain distribution along the FRP sheet, was proposed by Dai et al.
10
In this method, the local interfacial bond–slip models can be obtained from the relationships between the FRP strain (
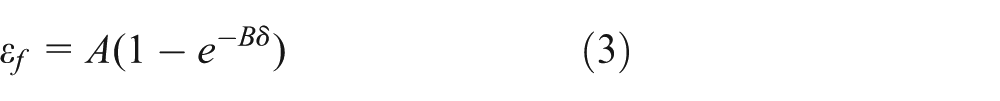
After determining the values of parameters A and B from the experimental data, the interfacial fracture energy (


where
Faella et al. 24 found that compared with direct method, indirect method has superior stability and robustness for calibrating the bond–slip relationship at the FRP-to-concrete interface using experimental data obtained through pull-out tests. In the present study, the analytical method (equations (3)–(5)) was applied to obtain the bond–slip behavior of the FRP/concrete interface from the experimental results of the conducted single shear pull-out tests.
Experimental program
Test setup and specimens
Figure 3(a) presents the test setup designed for the single shear pull-out test. In this figure, parts 1 and 2 are steel hollow structural section (HSS) 254 × 203 × 9.5 mm and HSS 203 × 254 × 9.5 mm, respectively. These two steel channels were fixed to the strong floor by bolts. Part 3 was designed in a way to fill the room between the two channels to prevent their movements relative to each other and also provide an adjustable height for the FRP plate. It is inevitable to have some variations of concrete block height and adhesive thickness among different specimens. Although these variations are very small, they may cause the line of action of the applied tension force not to coincide with the center of the FRP in horizontal direction. For this reason, two small wheels sitting on thread bars were used in this test setup to adjust the height of steel plates that hold the FRP plate in order to have tension force direction as close as possible to the center of the horizontal FRP plate. They also supported the steel plates to remove the bending in the FRP plate due to the weight of the steel plates. The wheels were used in order to generate the least friction force against steel plate’s horizontal movement during testing. 28 The surfaces of the steel plates, which contacted the FRP plate, were roughened to prevent the sliding of the FRP plate during the test. Figure 3(b) shows a picture of the entire test setup.

Test setup: (a) schematic (mm) and (b) picture.
The concrete block was placed on a rigid frame with two steel reaction elements (Elements A and B shown in Figures 3(a) and 4(a)) as boundary condition providers. Element A is a steel plate welded to the steel HSS, which has same width and half-height of the concrete block. The function of Element A is to prevent the horizontal displacement of the concrete block during the test. Element B is a steel plate welded with a steel roller and is bolted to the steel HSS as shown in Figure 3. The function of Element B is to prevent the vertical displacement of the concrete block during test. Elements A and B work together to prevent the rotation of the FRP bonded concrete specimen during test.

Specimen: (a) schematic and (b) picture.
Concrete block dimensions are 152 × 152 × 533 mm. The length and width of the bonded FRP plate on the concrete block are 406 and 50 mm, respectively. A 25 mm pre-crack between FRP and concrete was produced by placing a 25 mm wide tape between the adhesive and the concrete block during specimen preparation. The schematic of the specimen is shown in Figure 4(a) and the picture of a specimen is shown in Figure 4(b). The pull-out test was conducted under displacement control with loading rate of 0.0127 mm/s. A MTS 201.20T hydraulic single ended actuator was used to apply tensile force to the FRP plate.
Material properties
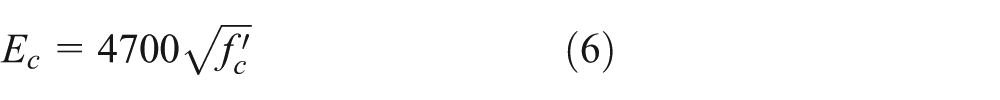
The mean unconfined compressive strength of concrete at 28 days,
Properties of strengthening system components.

Experimental results and bond–slip relationships
Six concrete specimens (CS1–CS6) were tested. The applied load, FRP axial strains at different locations and the slippage at the tip of pre-crack were recorded during the test. The FRP strains were measured using electrical resistance strain gauges attached to the FRP plate surface along its centerline at intervals of 25 mm. A digital dial gauge was used to measure the relative slip between the concrete and FRP at the pre-crack tip. The indirect method (equations (3)–(5)) was applied in order to obtain the bond–slip behavior of the FRP/concrete interface.
The dial gage was not set correctly during the test of specimen CS1, and therefore, the results of CS1 were not used for the calculation. During the test of CS3, it was observed that the FRP level was lower than the force level, which caused some peeling loads on the FRP. Therefore, the loading condition in the specimen CS3 was not same as the designed loading condition for this test, and its results were also excluded from the following calculations. The obtained curves of FRP strain versus slip at the tip of pre-crack for the rest of specimens (CS2, CS4, CS5, and CS6) are presented in Figure 5. The parameters A and B in equation (3) were obtained by the regression of the experimental data. Then, parameters A and B were used in equations (4) and (5) to find the bond strength,
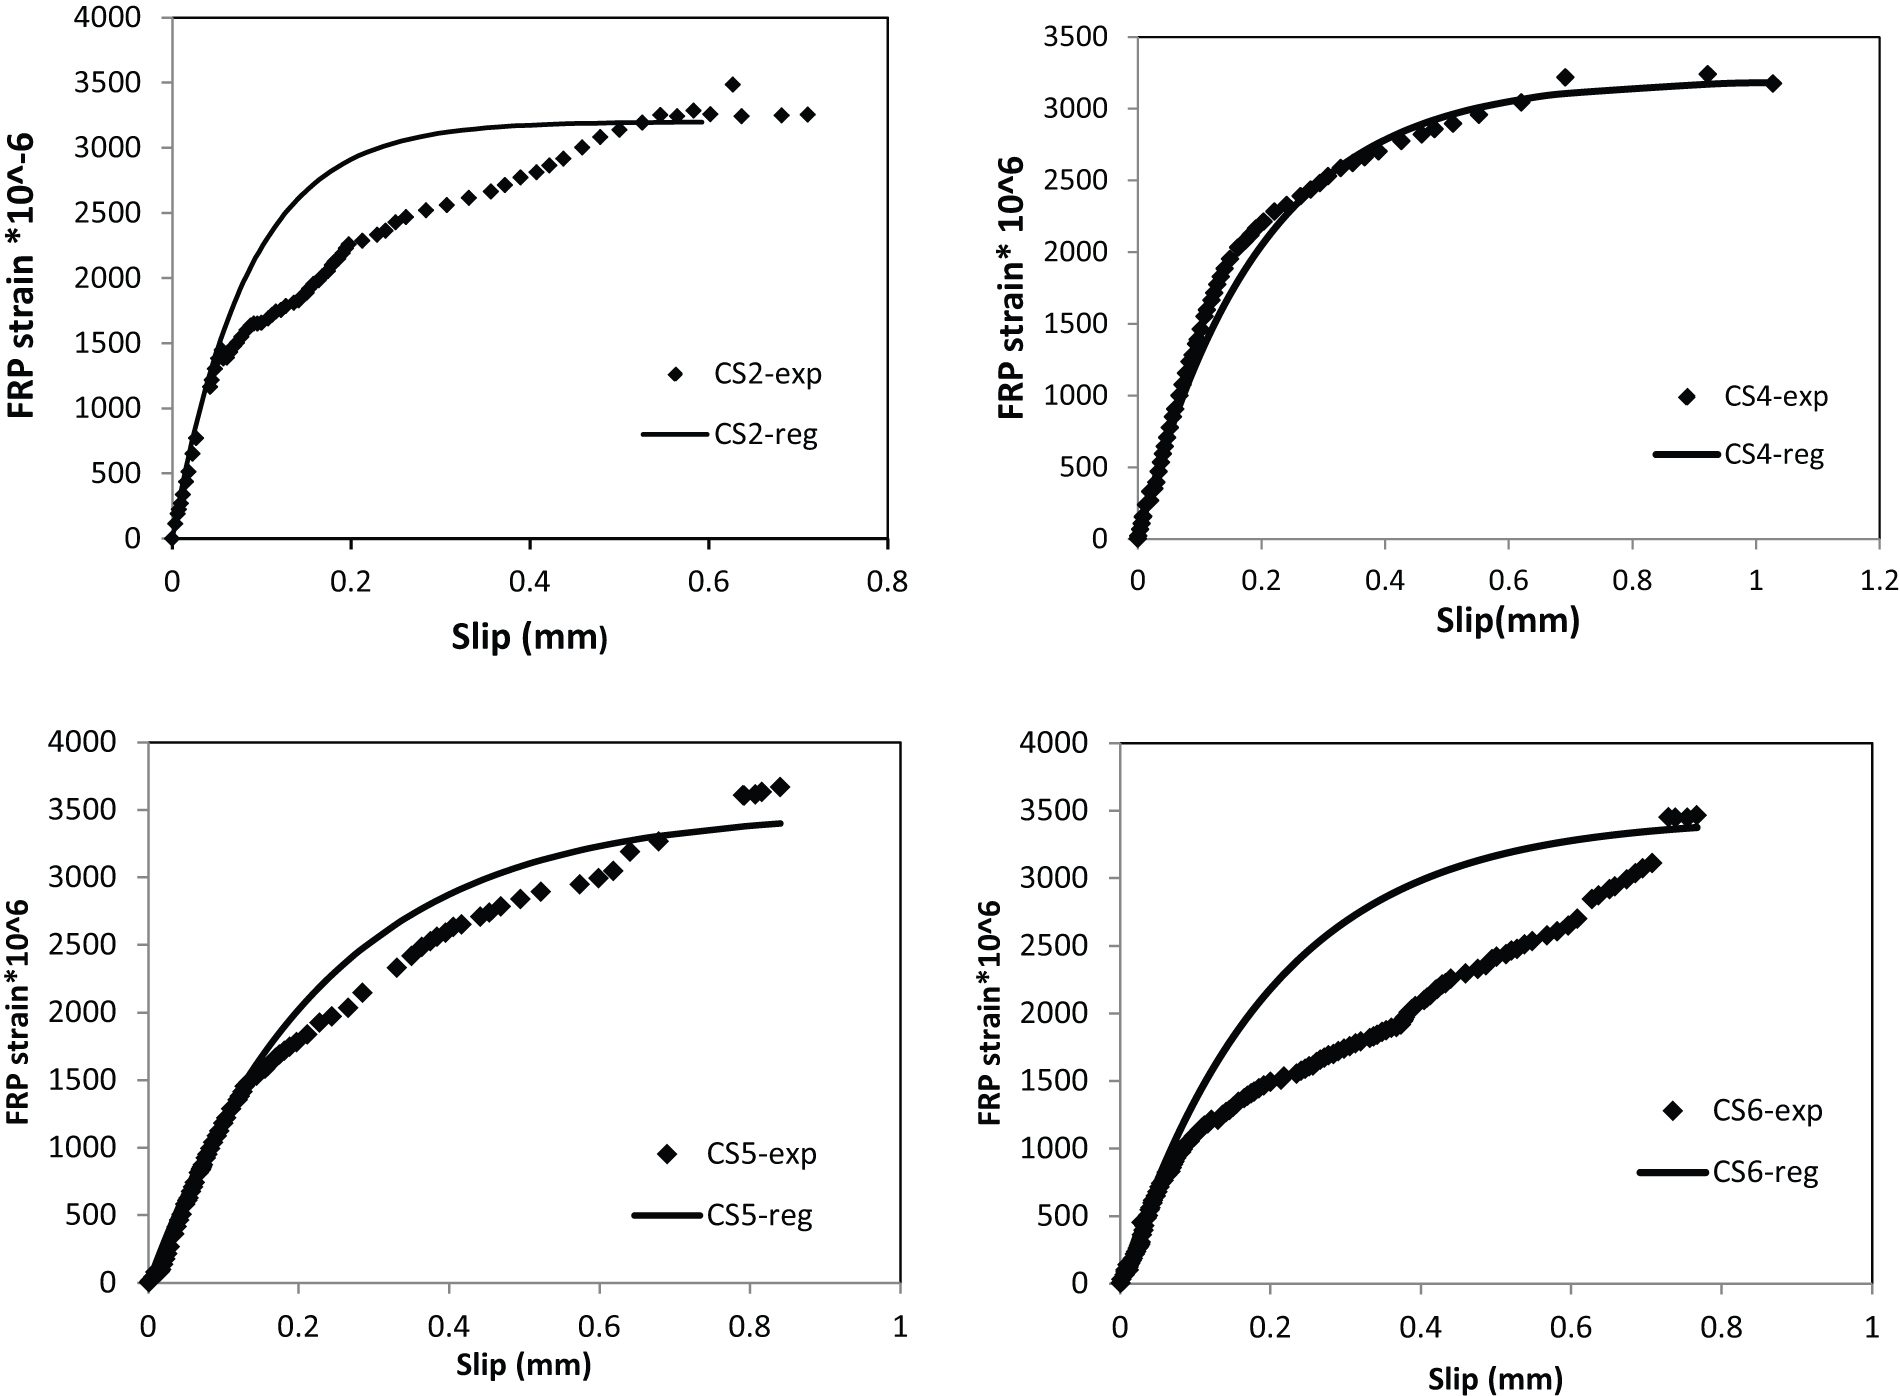
FRP strain versus slip curves at the tip of pre-crack.
Experimental results from single shear pull-out test.

Numerical analysis
The commercial software ABAQUS/standard 6.13 was used for the FE analysis. The plane stress four-node bilinear two dimensional (2D) elements (CPS4R) were applied for the modeling. The typical FE mesh is shown in Figure 6.

Typical FE mesh applied for numerical analysis.
Material constitutive models
Concrete
The concrete material was modeled using concrete damaged plasticity model. It assumes that the two main failure mechanisms of concrete are cracking in tension and crushing in compression.
30
This model can describe the nonlinear behavior of concrete including failures in both tension and compression. It assumes that the uniaxial tension stress–strain of concrete has a linear elastic relationship up to when the tensile strength of concrete is reached. At this point, the crack initiates in the concrete. Beyond the crack initiation, a softening strain response represents the crack propagation behavior that was assumed a linear softening behavior in this study, as shown in Figure 7(a). Therefore, the elastic parameters required to establish the first part of the stress–strain relationship for concrete in tension before crack initiation are the Young’s modulus,


Concrete material models: (a) linear approximation of concrete strain softening curve and (b) compressive behavior model of concrete under uniaxial compression. 6
where
The model proposed by Todeschini et al. 32 as shown in Figure 7(b) was used to represent the compressive concrete behavior under uniaxial compression.
FRP and epoxy
FRP and epoxy were modeled using a brittle cracking model. In the brittle cracking model, the stress–strain curve is assumed to be linear up to its ultimate strength, and the material loses all its load-carrying capacity suddenly at this point. The thicknesses of FRP plate and epoxy are 1.5 and 1 mm, respectively.
FRP/concrete interface
Since the debonding failure of FRP/concrete joints is due to a moving crack within concrete close to and along the FRP/concrete interface, a damage band was created separately from the rest of the concrete in the numerical model to simulate the FRP/concrete interface. 33
Cracks in a FE model may cause singular stresses and strains close to a crack tip, or a jump in displacement across a crack. For the numerical estimation of these non-smooth variables, there are two primarily different approaches. The first method is a polynomial approximation based on FE shape functions and requires the element mesh to conform to the discontinuities. In addition, a refined mesh is essential at the location close to the crack tip and remeshing is required in order to model the evolution of interfaces, for example, crack propagations. However, an effective remeshing procedure can be difficult for complex geometries because the elements must conform to the geometry of the discontinuity or projection errors are introduced. Moreover, this is computationally expensive and not suitable for developing cracks. The second method is the extended finite element method (XFEM) that is based on enriching the polynomial approximation space with discontinuous functions, so that non-smooth solutions can be modeled independent of the mesh. In this study, the XFEM-based cohesive method was used to model the damaged band as the FRP/concrete interface. The XFEM-based cohesive method is based on the partition of unity property of FE shape functions and enriching the cracked elements with additional degrees of freedom. This method is able to model crack initiation and propagation along an arbitrary, solution-dependent path in the bulk material, and crack propagation is not tied to the element boundaries in a mesh. In this method, it is needed to define a traction–separation law for cracking behavior of the damage band. The behavior of the damage band can be defined by a bilinear traction–separation law that is shown in Figure 8.18,34,35 Consequently, the stress–separation curve is linear up to when the damage initiation criterion is reached and then the post-cracking behavior is presented by in a descending linear damage evolution law. Therefore, the failure mechanism of the damage band consists of two components: a damage initiation criterion and a damage evolution law. The damage initiation criterion uses the maximum traction to define the beginning of the interface degradation. The area under the traction–separation response is assumed equal to the fracture energy required for separating the unit area of the interface. The damage evolution law uses the fracture energy concept to describe crack propagation behavior. In the present numerical analysis, the bond strength,
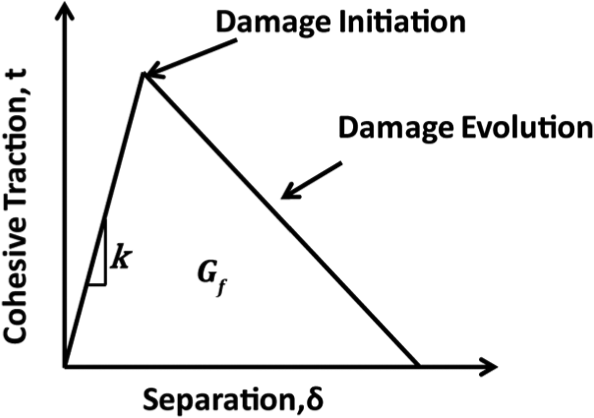
Bilinear traction–separation law.
The initial stiffness of the interface,
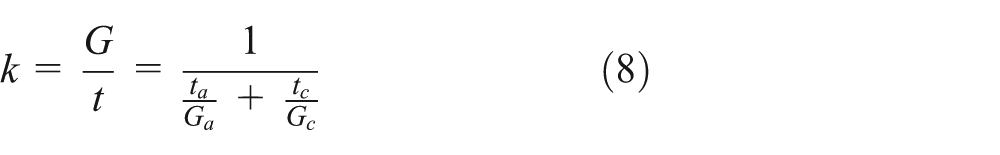
where Gc , Ga , tc , and ta are shear moduli, and thicknesses of the concrete and the adhesive, respectively. A summary of applied material properties in the FE analysis is presented in Table 3.
Material properties applied in FE analysis.

FE: finite element; FRP: fiber-reinforced polymer.
The applied FE analysis in this study is able to predict the FRP debonding from concrete substrate. The red color in Figure 9 shows the debonding cracks in the model. There is a very good agreement between the numerical and experimental results for FRP strain versus slip curves at the tip of pre-crack, as shown in Figure 10. The predicted ultimate load by numerical analysis was 45.59 kN which is very close to the average of the experimental ultimate loads, 43.41 kN, presented in Table 2.
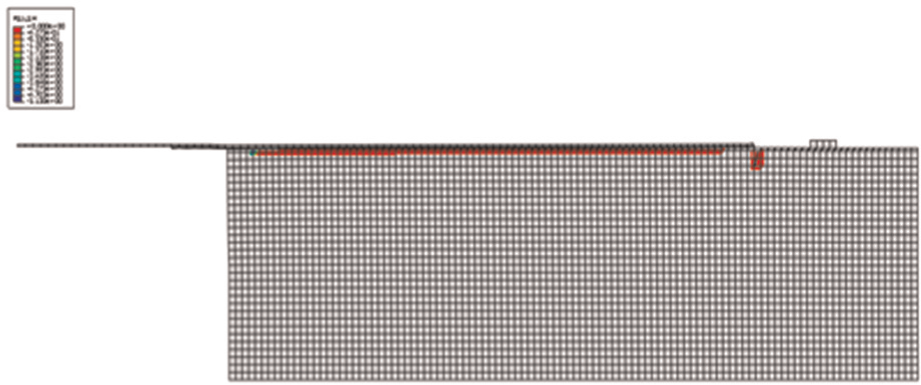
FRP debonding failure predicted by FE analysis.

Numerical and experimental FRP strain versus slip curves at the tip of pre-crack.
Sensitivity analysis to the boundary conditions
The numerical analysis shows that the FRP/concrete interface is not under pure shear stresses in the single shear pull-out test. Figure 11 shows the stress state of the element of the damage band at the tip of pre-crack when the initiation criterion is met. It can be seen in the figure that there are normal stress components besides the shear stress. The normal stress along y direction,

Stress state of the element at the tip of pre-crack.
Figure 12 shows the concrete substrate surface after FRP debonding. As it can be seen, the debonding actually was initiated with concrete fracture. Since the FRP debonding failure occurs in concrete close to the FRP/concrete interface, it is reasonable to assume that when the maximum principle stress in the element at the tip of pre-crack reaches to the concrete tensile strength,


Concrete substrate surface after FRP debonding in shear pull-out test.
Thus, the bond strength,

Since
In order to study the sensitivity of the normal stress components of the interface to the boundary conditions, four different boundary conditions (Figure 13) used in the literature were selected for the numerical analysis in this study. Boundary condition a is a representative of an experimental setup with the concrete block fixed to the base and no constraint on the side edges of concrete. 11 In boundary condition b, the height of the constraint on the edge of concrete is smaller than half of the concrete block height. 37 Boundary condition c is the case that the height of the constraint is half of the concrete height. It is the one used in the experimental test and numerical analysis in this study. In boundary condition d, the height of the constraint is very close to the concrete height. 38

Selected boundary conditions for the sensitivity analysis: (a) fixed support, (b) constraint height = 3h/4, (c) constraint height = h/2, and (d) constraint height = h.
The normal stress,

Normal stress
Conclusion
In the present study, the single shear pull-out test was conducted to define the bond characteristics of the FRP/concrete interface. Then, the experimentally obtained values of the bond strength and interfacial fracture energy were used in the FE analysis to numerically model the FRP debonding failure in the single shear pull-out test. Using the results of the numerical analysis, the stress state of the FRP/concrete interface and the influence of the boundary conditions of the concrete block on the stress state and bond strength of the FRP/concrete interface were investigated. The numerical analysis shows that the bond strength of the interface is sensitive to the height of constraint of the concrete edge at the loaded side. As the constraint height increases, the bond strength of the interface increases too. Therefore, boundary condition of the concrete block is a determinative parameter in the bond strength of the FRP/concrete interface in the single shear pull-out test.
Footnotes
Academic Editor: Yu-Fei Wu
Declaration of conflicting interests
The authors declare that there is no conflict of interest.
Funding
This research received no specific grant from any funding agency in the public, commercial, or not-for-profit sectors.