
Abstract
In this article, an application of a three-dimensional scanner for building a special diagnostic stand is described. An experimental method of detection of material defects is discussed. The considered defects are connected with cooperation of particular surfaces of machine parts. In the discussed experiments, particularly the dimensions of pitting holes can be evaluated. Availability of laboratory facilities required that the investigations were performed using geared wheels. The three-dimensional model which represents a degenerated surface, obtained based upon the diagnostic measurements, was compared with the pattern of an undamaged surface. The latter was generated by means of our pre-processor. The pre-processor enables generation of files which are compatible with the majority of the computer-aided design system formats. Therefore, the analyses were performed by means of commercial system inventor and computer-aided three-dimensional interactive application.
Keywords
Introduction
Due to dynamical development in the machine industry, the designers are forced to apply new technologies connected with prototyping, design, manufacturing, and diagnostics of machine parts. Nowadays, the main goal is fast and economic manufacturing of new products, especially reducing its dimensions in comparison to the transmitting power. Additionally, within the phase of design, a designer assumes maximal time of operating a particular device without repairs, just to eliminate costs connected with possible break. Development of versatile computer systems enables application of new technologies in fields such as design, investigation and measurement of different parameters of mechanical systems.1–3 In this article, some new methods are discussed, which have been recently used but previously not for diagnostic purposes. As was shown in previous works,4,5 there are several types of possible damages which can occur during cooperation of machine parts, for example, fatigue crack propagation, pitting, and scoring. However, fatigue damage and scoring cause immediate elimination of a particular machine from further duties. In case of pitting phenomenon, it is possible to accept further utilization of particular parts. The level of acceptance of some damages (of this kind) depends on the range and area of an application. In some case, even relatively intensive pitting can be accepted, but in some other areas and applications, every spotted (registered) low-level pitting holes are unacceptable. 6 Due to availability of a division laboratory dedicated to investigation of gears, a gear is considered as an object of investigations. One basic factor, which determines its capacity and fatigue life, is strengths of tooth flank in conditions of acting stresses (from other cooperating parts). Degradation of flank surface can be cased by different reasons or factors:
Cyclic load exceeding the fatigue strength of the material (of wheels);
Friction forces connected with rolling and mutual slips of geared wheels;
Exceeding of the ultimate strength of the material of the investigated gear wheel;
Deterioration or degradation of material due to excessive friction caused by contaminated oil;
Scoring of tooth flanks on particular gear wheels.
Pitting is a type of fatigue damage. Degradation of a surface resulting from this phenomenon consists in appearance of shallow holes having irregular shapes and boundaries. An initiation of pitting process is cracking, where cracks propagate due to acting of external forces (Figure 1(a)). Oil is pressed into the internal volume of the appeared cracks, and it causes further propagation of fatigue slits (Figure 1(b)). Pitting holes (pits and sites) can occur on one or in an extreme case on all teeth of a gear wheel. Their size and depth are different, but rather they have a regular shape (Figure 2). Pitting is characteristic for the negative slip zones, and it is divided into two categories: restricted and damaging. Restricted pitting is caused by slight deflections of tooth contour and excessive roughness parameter, and it is considered to some extent as acceptable. In particular work conditions, due to conformation process of two engaged wheel surfaces, its development stabilizes and even its effect diminishes according to some conformation phenomena.

Typical damage of flank surfaces of cooperating machine parts: (a) fatigue crack propagation, (b) scoring, and (c) pitting.

Variations in the shape of pits: (a) narrow, deep; (b) subsurface; and (c) wide, shallow. 7
Laboratory test stand
The standard ISO 6336-3 encloses or distinguishes four methods of determination of tooth flank strength, namely, A, B, C, and D. They are named according to their decreasing precision. The methods A and B assume that the experimental investigations should be performed for the determination of tooth flank strength. The following criteria (goals) of investigations are assumed:
Determination of the highest strain in a pitch point of engagement of two teeth which does not cause an increase in pitting after the so-called base number of cycles;
Determination of percentage (%) of degraded surface to the entire area of surface of gear wheel tooth flank.
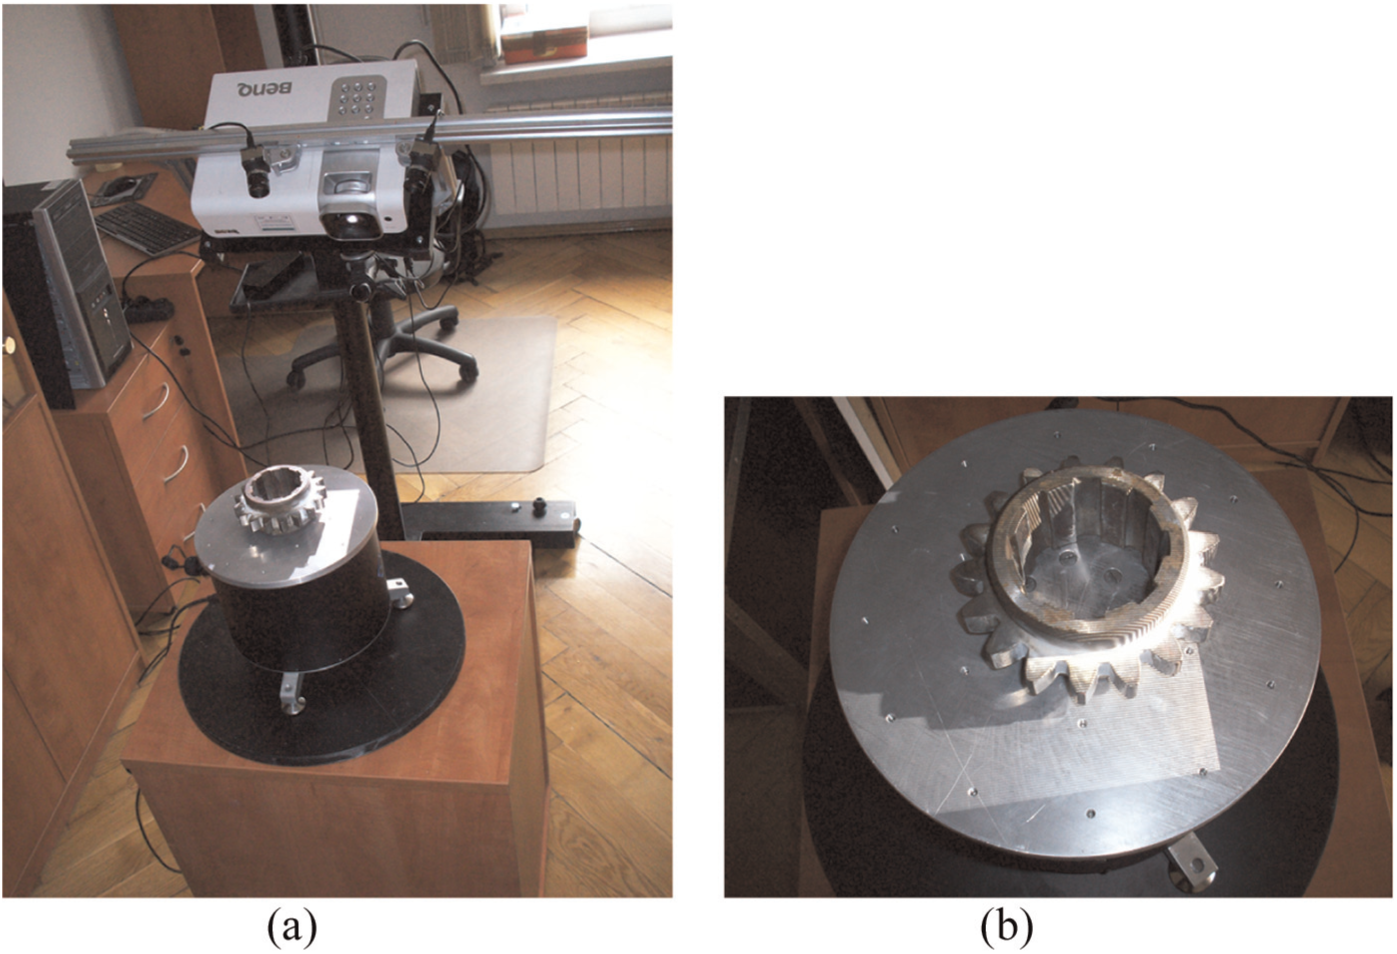
The investigations were performed using our so-called power-loop test stand, which was specially designed (Figure 3). It enables the performance of fatigue investigations of spur cylindrical gear wheels, with straight teeth (parallel to the shaft axis). It is assumed that the wheel specimens are investigated in the same conditions.8–10 The test stand consists of the following parts: investigated gear 2 and closing or symmetrical gear 1, motor 3, three-dimensional (3D) scanner 5, computer-based register device 6, and free-programmable controller GE Fanuc 7 together with connected vibration gauge 8 and encoder 9. The wheel specimens were made of 17HMN steel, subjected previously to the heat chemical and heat treatments:
Carbonizing under temperature of 930 °C within the period of 4 h;
Hardening, that is, heating under temperature of 830 °C within 15 min and cooling down to temperature of 130 °C in oil;
Quenching in temperature of 170 °C within the period of 2 h. The loading moment was applied by means of spanning clutch 3 and torsion shafts 4.
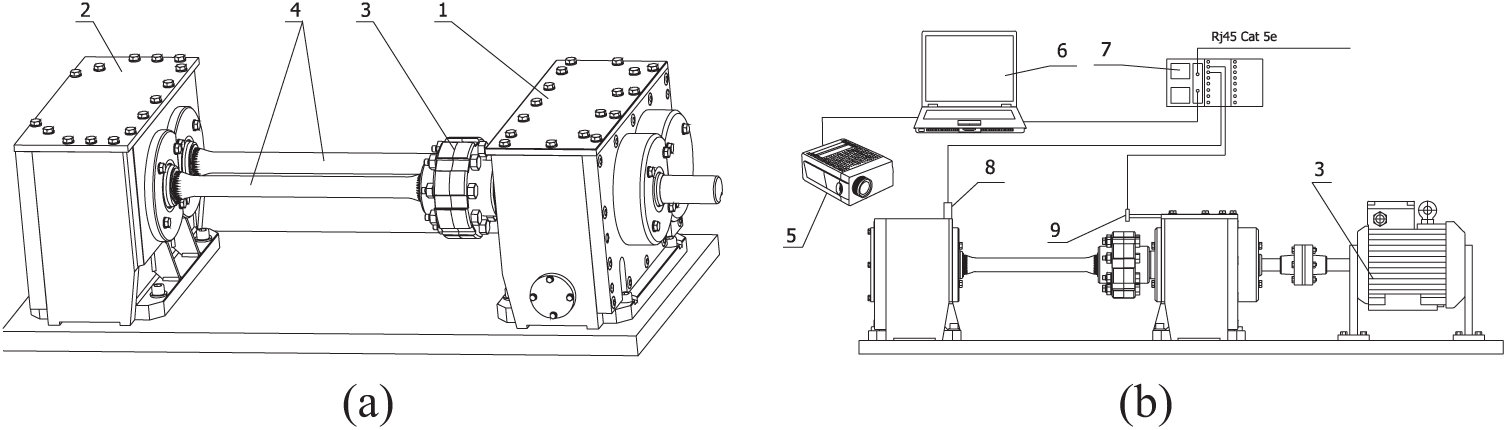
(a) Test stand—general view and (b) layout of measurement devices.
In this article, we are interested in an evaluation of percentage ratio of pitting holes on the tooth flank in comparison to the entire area of tooth flanks for the gear wheels being in mesh.
Methodology of measurements
The presented method consists in rapid evaluation of the state of a particular surface by comparison with the pattern. In our case, the computer-aided design (CAD) model was considered as a pattern of the object (Figure 4). A 3D scanner has been utilized for evaluation of the considered phenomenon. The purpose of the prepared pre-processor is to generate a shape (contour) for a gear wheel teeth based upon the assumed geometrical parameters. The surface of a gear wheel was divided into the following areas or regions:
Involute contour of a tooth flank;
Transition surface (tooth root);
Arcs of the circle of tooth roots;
Arcs of the circle of tooth addendums;
Special lines which close the contour to make it a continuous curve or surface.

Block scheme of the process of creation of 3D models.
The shape of the transition surface as well as the contour of a tooth flank is determined numerically upon the geometrical parameters of the geared rack (used for a tooth machining) applied in the manufacturing process. Due to such (along the special curve) movements of the tooth flank of the geared rack, the profile of a gear wheel tooth has an involute shape for which exact mathematical equations are known (derived). 11 However, the transition curve representing the tooth root is determined by the corner edge of the geared rack (machining tool). Therefore, the transition curve is so-called equidistant curve of the trajectory of the point of the center of the radius of corner edge of the discussed tool. In Figure 5, the appropriate shapes and curves are presented. 11 Parametric equidistant curve, in which sector constitutes the transition curve, is presented by means of the following relationships (1) and (2)
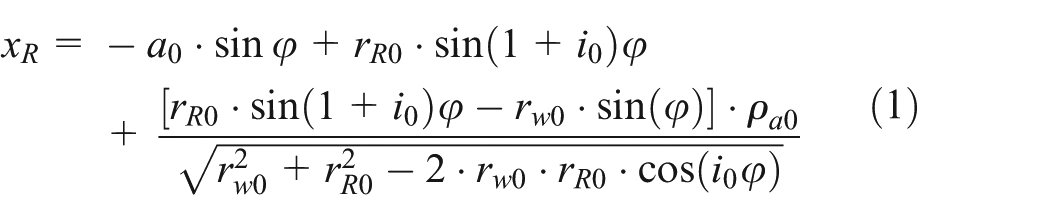
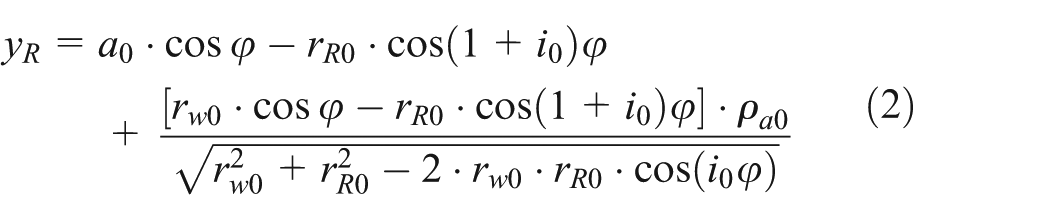
where a0 is the machining distance (a0 = rwE + rw0), rw0 is the tool radii vector, rR0 = rw0 + hwR0, and i0 = rwE/rw0.
Transition curve representing tooth root. 11
Generated contours of three consecutive gear teeth of a cylindrical gear or for two cooperating gear wheels are stored in formats compatible with majority of CAD systems. The diagnostic system mounted on the investigated gear (its housing) provides real-time information, representing its current state. In case of existence of symptoms indicating damage of a tooth flank, the investigated gear wheel is scanned, and CAD model is simultaneously created and compared with the previously prepared pattern. Analysis of results submits the direct response, whether the investigated element (part) can be accepted for further usage or it has to be immediately replaced by a new one. The best solution, for the discussed measurements, is a configuration which enables direct access of the scanner to the degraded (damaged) surface (Figure 1). In other cases, the experiment should be suspended, and the investigated element should be disassembled. The measurements should be performed on previously prepared adequate test stand (Figure 6). It can be considered that the measure of fatigue damage is the sum of damaged surfaces of tooth flanks of the engaged cylindrical gear wheels, 4 that is, pinion A1 and wheel A2

where


where 1 is the pinion, 2 is the wheel, z is the number of teeth, l are the lengths of effective expanded profile, and b is the gear wheel width.
Scanning of tooth flank using special dedicated test stand.
We can assume one of the following as the criterion of pitting wear of tooth flank, namely, that this wear surface should not exceed
2% active (working) surface of tooth flanks of all hardened teeth;
0.5% active (working) surface of tooth flanks of nonhardened teeth;
4% surface of one hardened tooth flank;
8% surface of one nonhardened tooth flank.
Scanning of tooth flank of the cylindrical gear wheel
During the experiments, the scanner eviXscan 3D Pro built by the Evatronix company was utilized. The choice was made based on the possibility of making measurements without the necessity of disassembly of the entire test stand (back-to-back rig) and performance of measurements on an additional stand (Figure 6). A 3D scanning process is used in reverse engineering procedures. It consists in representing (mapping) of the real geometrical shape of particular element and its processing into a numerical model (file) accepted by different professional CAD systems. The applied scanner uses a single laser beam for measurements. The scanned object is lighted by means of horizontal in-plane moving laser beam, which is subjected to some distortions depending on the geometrical shape of the object. These distortions are registered via charge-coupled device (CCD) matrix and then the software processes this image into a point cloud (set) which maps the scanned surface. Every single measurement can be performed within an appropriate or available precision or resolution. The scanner can scan achieving the maximal resolution of 5,000,000 points. Scanning is relatively a rapid process—one mapping of resolution of 5,000,000 points lasts approximately 3 s. The result of scanning can be later processed in CAD systems or specialized software dedicated to processing of point cloud. Calibration is needed for correct performance of scanning. The calibration procedure consists of appropriately defining the distance between a scanner and a measured object, lighting the observed surface by a laser beam, and presenting a simplified image on the computer screen. 12 The laser scanner does not effectively map some surfaces, for example, shining or transparent, compared to black surfaces. A surface of a scanned tooth was a reflective surface. To enable proper mapping, a thin layer of spray-dosed talc was used to cover a tooth outer surface which eliminates reflexes during the measurements. Layer thickness was within the range of approximately 1–2 μm. In case of investigations of gear wheels, it is necessary to perform a scan of a surface from several viewing angles (three are sufficient). The main goal of mapping was identification of all degraded surfaces. Depending on the direction of rotational movement, the teeth of a gear wheel work activating contact only on one tooth side; therefore, a damage appears just on this surface. If we would like to receive a 3D model of the scanned wheel, it is necessary to carry measurements around the considered tooth. In this article, measurements were performed on the outer surfaces of one tooth. In Figure 7, an exemplary result of scanning of cylindrical gear wheel is presented as a point cloud. The next step of analysis consists in matching (unification of) these points in making a body model. It can be done by means of automatic, professional procedures attached to the program or it can be accomplished in our routine via a unification of consecutive mappings by means of special characteristic points. The final effect is shown on the screen using an application (software) presented in Figure 8. In the interface box of the program, a user can see the images of the most degraded outer surfaces of tooth flanks. All the described activities are connected with the task relevant to reverse engineering. Hence, based upon a real element, a 3D model of tooth flank was obtained. Moreover, the model of the gear wheel encompasses all damages (their geometrical representation) which were done due to applied service conditions. Therefore, our task is not to determine its geometry but to measure the resultant damages. Unfortunately, there is lack of professional tools which enable an automatic analysis, for example, damages of tooth flanks. Therefore, the obtained images (i.e. their 3D models) were stored in a format readable in computer-aided three-dimensional interactive application (CATIA) system. It is a universal, professional CAD system which offers adequate moduli dedicated to process the point cloud received from the scanner. In CATIA system, a point cloud can be converted into the set of curves describing the shape of the scanned surface. Base upon these curves, a surface-like model of the artifact can be created. Unfortunately, there is a lack of dedicated subsystems which could carry an automatic analysis of the damaged surfaces. Moreover, there is not any possibility for automatic indicating of damaged zones. Such an operation can be done by a user herself or himself by marking the nodes (vertices) on the boundaries of the damaged region (area). But, which is worth highlighting, the CATIA program allows for creation of an arbitrary division of a surface and determination, for example, of depth of pitting holes (Figure 9). However, it is needed to verify the measurement method.

Exemplary scan of a cylindrical gear wheel—point cloud.

3D model of cylindrical gear wheel.

Measurement of depth of pitting holes.
Analysis of degraded surface by means of CAD systems
As it was mentioned previously, an evaluation of pitting phenomenon is done based upon the digital models of wear gear wheel. The 3D models were obtained via the scanning procedure of particular artifact (gear wheel). The obtained digital representation of the artifact (gear wheel) consists of point cloud (Figure 7). Via connection of adjacent points by means of lines (triangulation procedure), a user obtains a network of triangles which is usually known as a polygonal grid (network) (Figure 10). It should be stated that the method has some errors which result mainly from the resolution of measurements. The most challenging task during evaluation procedure is precise indicating of the measured zone.

Created body model based upon polygonal surface.
In the case of gear wheel, the division was done on a diameter of tooth roots (i.e. in the middle between teeth) (Figure 11). First, applied evaluation method was a comparison of volumes between the gear wheel generated based on a 3D scan and the pattern wheel, established by Autodesk Inventor. An “ideal” gear wheel was generated by means of our pre-processor, written in algorithmic language Delphi. 13 The outcome was the difference between the measured volumes (given in percentage). In our case, the difference in volumes for the most damaged wheel was equal to 9.60%. In the next step, the second type of comparison was performed, that is, the percentage ratio of the degraded tooth flank surface in relation to the pattern wheel was determined (Figure 12). Using special measurement tools of CATIA system, the surface of tooth flank was calculated, which were compared with the pattern wheel adequate surface. It was observed that degradation of the tooth flank exceeds 8%; therefore, the investigated wheel was unsuitable for further service. Moreover, comparison of gear wheel volumes was additionally performed via CATIA systems, in the same steps, utilizing appropriate routines (Figure 13). In this case, at the beginning, the tooth flank has to be defined (established). Next, the directions of division should be given as well as a value characteristic for a particular division (kind of resolution, density). It is a time-consuming method, but it gives the most precise results. Obviously, to some extent, the more dense the division of tooth model, the more precise the measurements are performed. As a result of a division, several curves were obtained alongside of side cross section of a particular tooth. These curves constitute a base for the determination of tooth volume. As a result of the calculations, the obtained result was 5.58%.

3D model of gear wheel tooth: (a) obtained via scanning and (b) obtained via the pre-processor generating 3D pattern of an artifact.
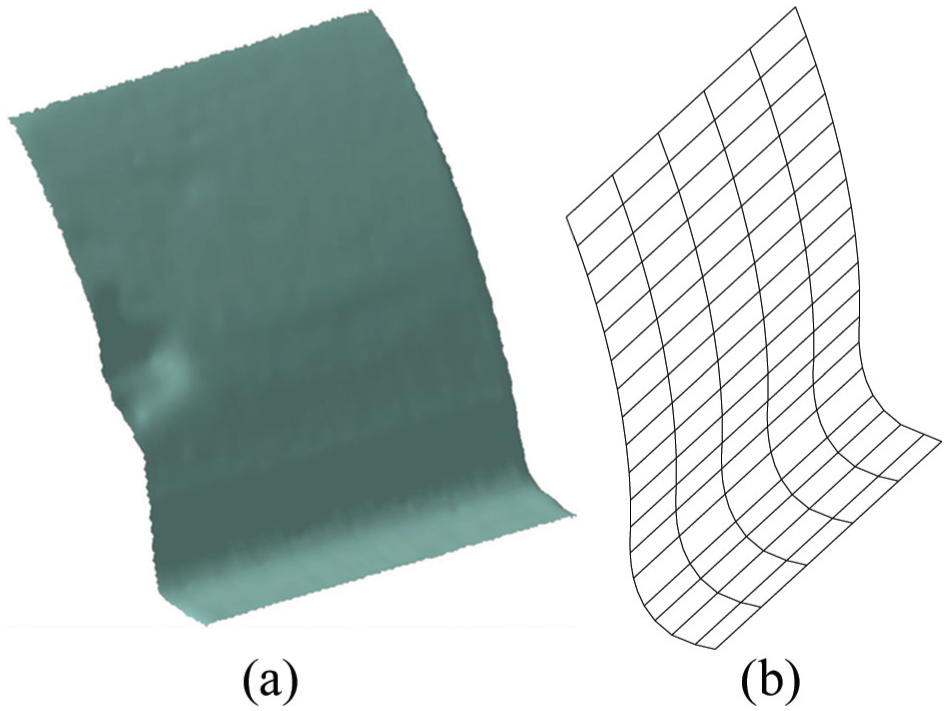
Sector of tooth flank of gear wheel: (a) obtained by means of scanning and (b) as a result of pre-processor which generates 3D pattern.

Definition of division of surface in the professional system—CATIA.
Final remarks
Due to exceeding the allowable strains, some fatigue damage originates on the tooth flanks (of gear wheels). Most frequently, the cause of the damage consists of the tear off some material particles from the tooth flanks which are currently in mesh. Their characteristic features are that they create irregular spots or holes which arise usually in pitch zones or near tooth roots. Analyzing the pitting phenomenon, it is important to avoid linear or progressive increase in pitting signs within the working time. Damaged elements, which would service being neglected, can cause excess uncontrolled vibrations as well as dynamic forces causing failure of the whole device or machine. Within a service conditions, measurements of pitting phenomena are usually performed three times. Assuming the fatigue life in accordance to pressure of the tooth flank, on the level 3 × 10⁶ load cycles, the first test measurement is carried out after at least 106 cycles. However, not all tribological measurement methods connected with wear can be directly applied to gear wheels. The following measurements of mass reduction are utilized: weight methods, micrometric methods as well as using so-called profilographs. But in case of gear wheels, these methods are difficult to apply (wheels are inside the housing). The problem arises in switching off the test stand (real gear) for a relatively longer period and break in production routine in industrial conditions. It is obvious that such break has to be previously planned and appointed (accepted) after an analysis of damage symptoms in the investigated object or artifact. Investigations of wear of machine parts surfaces are performed in laboratory conditions on special machines or in real industrial conditions for chosen work stations. In the first case, a specimen of a simple, specified shape is subjected to constant loading; due to applied friction, the cooperating surfaces are under degradation process. The obtained and collected results can be very useful for a designer, being a base for the introductory engineering calculations. In case of service investigations, the obtained results are appropriate to real working conditions. However, these investigations are very expensive, and additionally, their performance is sometimes impossible or extremely difficult and time-consuming. As was confirmed in this article, based on the results of our investigations, it is possible to apply a laser 3D scanner for evaluation of degradation of surfaces of cooperating machine parts. An advantage of the proposed method is the rapid mapping of outer tooth surfaces. Scanning of surfaces of one tooth (from three viewing angles) lasts approximately 24 s. Depending on the construction features of the test stand, the following positive aspects of the method can be mentioned: performance of inspection on an object, without any necessity to disassembly of gear wheels. A drawback of the discussed method is lack of professional dedicated software which could analyze the obtained image for the needs of evaluation pitting parameters just for gear wheels. Therefore, such adequate software has to be created, which would make analysis of scanner images standard and automatic. The methodology has to be verified via classic methods. The obtained body model of the damaged surface, for example, of a gear wheel can be implemented in arbitrary professional program (finite element method (FEM) 14 or boundary element method (BEM)) checking the strength of parameters or characteristics. Just after this additional analysis, an engineer can take a decision on the acceptance of a particular element for further service (Figures 14 and 15).

Determination of direction of surface division of tooth flank via CATIA.

Strength checking—an exemplary result of our computer program.
Footnotes
Academic Editor: Michal Kuciej
Declaration of conflicting interests
The authors declare that there is no conflict of interest.
Funding
This research received no specific grant from any funding agency in the public, commercial, or not-for-profit sectors.