
Abstract
To improve the fuel consumption of a motor grader, a method for shifting the power curve of the grader engine is proposed. The working principle, calculation method, and design procedure of the novel method are depicted. Considering the nonlinear and time-varying uncertainty of the load of a motor grader, the fuzzy adaptive control is provided to shift the power curve. The shifting action is decided by the gears and the corresponding engine speed together with the displacements of both the hydraulic pump and motor. As a result, the power line adapts to the frequent changes in different external loads. A prototype motor grader is developed to test the above-mentioned energy conservation method in different working conditions. The results show that the fuel consumption of the prototype motor is reduced by 23%–34% and the skip ratio is decreased by 10% compared with the traditional grader with only one power curve. The proposed shifting power curve method can be widely applied to other heavy-load construction machinery also.
Keywords
Introduction
With ever-increasing concerns on the energy diversification and environmental protection, the energy conservation technology has been widely used in automobile industry, such as a hybrid electric vehicle. As we know, the power of a construction machine is at least twice more than that of an automobile, for instance, the engine power of a 190HP motor grader is 142 kW and that of a Toyota Prius is only 73 kW, which considers both the engine and the electric motor. So, the energy conservation technology for a motor grader is much more important than an automobile. A motor grader, also known as a road grader, patrol, or maintainer, is a piece of heavy machinery used to create a smooth, wide, flat surface. Statistics data show that the fuel consumption takes up around 40% of the whole life cycle cost of the grader. Thus, the energy conservation technology is now one of the critical competitions for the motor grader manufacturers. With the high fuel prices, the demands of energy conservation and green emission for a motor grader, without the sacrifice of working performance, safety, and reliability, have been highly increased. Recently, most of the energy conservation research focuses on the energy recovery and hybrid power drive for a construction machinery.1–12 For example, a novel hydraulic energy-saving system for hydrostatic drives is proposed by Triet and Ahn, 1 based on a traditional closed-loop hydrostatic transmission (HST) with novel energy storage, including a hydraulic accumulator and a flywheel. Then, a new hydraulic closed-loop HST energy conservation system simulation is proposed by Ho and Ahn. 2 Furthermore, Sun and Jing 3 aimed at the frequent start/stop operation characteristics of the loader and proposed an energy-saving scheme with parallel hydraulic hybrid system to regenerate and reuse the braking energy normally lost in a conventional loader. A new hydraulic system was built for the wheel loader ZL50 to save its energy consumption by Yao et al. 4 As for the excavator, some new energy-saving hybrid excavators using an electro-hydraulic circuit design driven are presented by an electric motor/generator for the generation of potential energy.5–7 Lin et al. 8 analyzed the difference between the hybrid powered automobile vehicle and the hybrid powered construction machinery and reviewed the research and development of the hybrid power systems and energy regeneration systems of construction machinery. Furthermore, Lin et al. 9 proposed a kind of energy regeneration system for hybrid hydraulic excavators; the control strategy and parameter matching for the proposed energy regeneration system are discussed. Morton described a new function for electrical power–assisted steering systems applied for hybrid electric trucks, which can recover a maximum of 20% of the energy required to complete the steering maneuver. This energy saving relates to a fuel gain of 2094.5 gal over the lifetime of a truck of 500,000 mi 10 Wang and Wang 11 proposed a hydraulic cylinder-driven scheme combining a pressure compensator and an energy recovery device together to achieve good control operation and energy-saving capability simultaneously. Four main energy management strategies (EMSs), namely, the engine optimal control strategy, minimum motor power control strategy, motor optimal control strategy, and instantaneous optimal control strategy, have been applied to hybrid electric wheel loaders by Zeng et al. 12
However, it should be noted that the hybrid power and energy recovery technology can only be used in small- and medium-power vehicle. It cannot be introduced into a large power motor grader under the limitation of a small power motor. On the other hand, the fuel consumption of a grader engine is variable with different loads; the optimal control for the engine output power can realize the objective of energy conservation for a motor grader. This article analyzed the performance of the power line systematically and presented the static hydraulic transmission configurations for a motor grader. The working principle, calculation method, and design procedure of shifting the power curves are depicted. Considering the nonlinear and time-varying uncertainty of the power line, the fuzzy adaptive controller is designed. Finally, a prototype motor grader is developed to test the above-mentioned energy-saving method in different working conditions.
Energy-saving principle of shifting the power curve for an engine
Traditionally, a motor grader is used for road maintenance—its main function is to flatten surfaces before the application of asphalt. Presently, these machines are also commonly used for fine grading, spreading, and earthmoving. They can be used for clearing debris and brush as well as for snow removal. So, the working conditions of a grader are rather complicated, which includes heavy-load working condition in agriculture engineering, light-load in municipal engineering, and medium-load in civil engineering. In agriculture engineering, the grader’s purpose is to grade, as shown in Figure 1(a). In some locales such as Northern Europe, Canada, and places in the United States, graders are often used in municipal and residential snow removal, as shown in Figure 1(b). Traditionally, a powerful engine was chosen according to the heavy-load working condition. For the medium-load or light-load working conditions, most of the engine power is wasted.
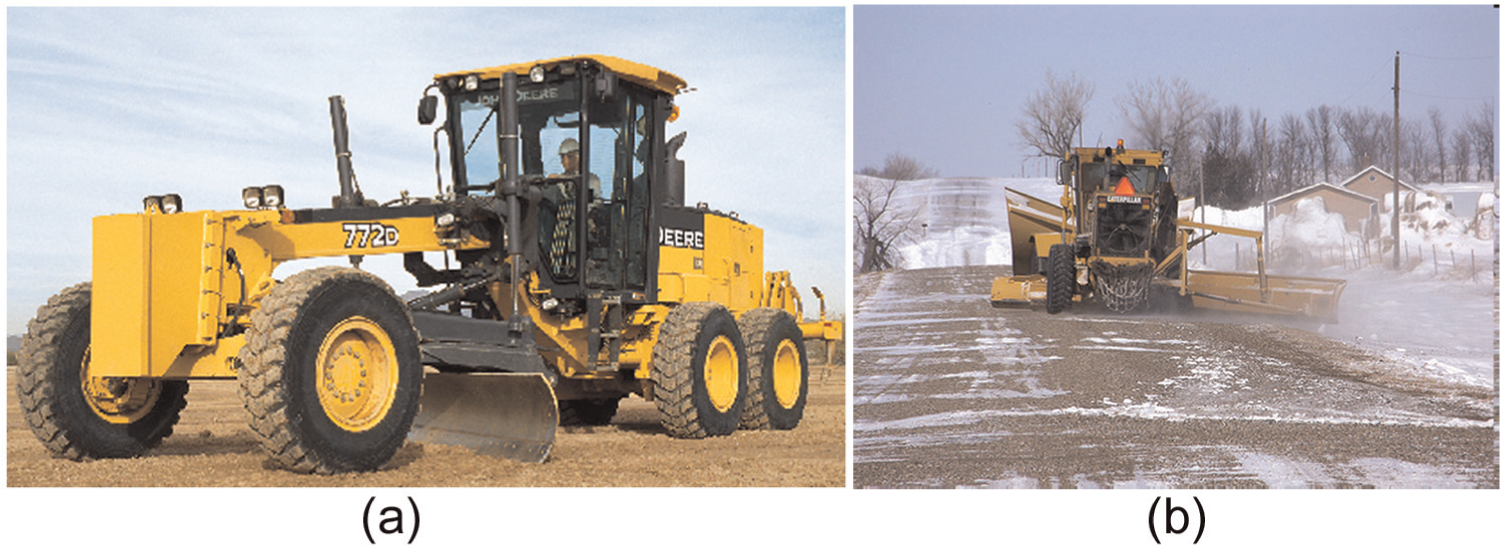
The work condition of a motor grader: (a) in agriculture construction engineering and (b) in municipal snow-moving engineering.
Most of the early graders adopt the mechanical or hydrostatic-mechanical transmission. Since the static hydraulic drive is endowed with the following advantages of high power density, easy layout, strong overload protection, flexible control method, and overload adaptive ability in a wide range, a new full hydraulic motor grader has been successfully studied, produced, and promoted to use in a wide range. The power line of the static hydraulic grader is as follows: the engine → the hydraulic pump → the hydraulic motor → the speed reducer balance box → the driving wheel, as shown in Figure 2. A variable displacement pump and two variable displacement motors are used in this power line. The dual motors are connected parallel to the pump. The performance parameters of the engine, hydraulic pump, and motors are shown in Table 1. The engine drives the variable hydraulic pump. The pump transfers the hydraulic power to the hydraulic motors. Then, the motor drives the reducer balance boxes and the driving wheels, which propel the grader to travel and work.

The schematic diagram of the power line.
Basic parameters of the engine, hydraulic pump, and motor.

The motion and kinetics characteristics of the grader
The vehicle speed
The analysis for the power line of the grader shows that the relationship between the grader’s traveling speed V and the hydraulic motor speed nm is as equation (1)

where V is the grader speed (km/h), nm is the hydraulic motor speed (r/min), r is the dynamic radius of the driving wheel (m), and i is the reduction ratio of the balance gear box. The hydraulic motor speed nm is determined by its own displacement qm, the displacement qp, and speed np of the hydraulic pump. The relationship between them is shown in the following equation
where np is the hydraulic pump speed (r/min), qp is the hydraulic pump displacement (mL/rev), ηv is the volumetric efficiency, and qm is the hydraulic motor displacement (mL/rev).
Since the engine is connected with the hydraulic pump directly by the shaft joint, the pump speed np is same as the engine speed ne, and the expression of the traveling speed of the grader V can be obtained by substituting equation (2) into equation (1)

where ηv, r, and i can be seen as constants, and we can see from formula (3) that the grader’s traveling speed V is proportional to both the engine speed ne and the hydraulic pump displacement qb, but is inversely proportional to the hydraulic motor displacement qm. When the engine speed ne slows down, the grader’s traveling speed V can be kept unchanged by increasing the hydraulic pump displacement qb and/or reducing the hydraulic motor displacement qm and vice versa.13,14
The economic characteristics of the engine
The universal characteristics curve of an engine is shown in Figure 3, where the horizontal coordinate ne is the engine speed, the longitudinal coordinate Te is the torque, Pe is the constant power contour (the dashed lines in Figure 3), and the thick solid line is the fuel consumption ratio ge. As shown in Figure 3, when the load requirement power is 60 kW, there are at least three working points for the engine, such as the star mark, triangle mark, and circle mark. However, for both the “circle mark” and the “triangle mark,” the fuel consumption ratio is 260 g/kW h; for the “star mark,” the fuel consumption ratio is only 240 g/kW h. It will save 20 g fuel if the engine works at the “star mark” for an hour than that works at other points. If we connect all the “star mark” under different power requirements, we can get the lowest fuel consumption ratio of the engine, namely, the best economical fuel consumption curve (S curve in Figure 3). The energy conservation strategy of static hydraulic grader is as follows: study the character curve of the engine to find out the best economical fuel consumption curve (S curve in Figure 3) and then arrange the work point of the engine to be near the curve according to the grader’s working conditions. Take advantages of the hydraulic transmission system of good controllability, continuous adjustment, and reasonably matching different parameters to meet the operating requirements of the graders to achieve the energy conservation target.13,14 It can be seen from Figure 3 that the corresponding engine speeds on the lowest operating point under different powers differ from each other. Since the single change in the engine speed can result in the traveling speed change in the grader. The engine is controlled to output the power to match different working conditions by adjusting the engine speed, but even under the same working condition, the output power of the engine is fluctuating, which makes it difficult to keep the engine always working in the high-efficiency range.

The universal characteristics of an engine.
The driving force
In most cases, the maximum driving force is developed at low speed and may be the same as the starting driving force value for the grader. The maximum driving force of the grader is defined by the ground situation, which can be calculated from equation (4)
where F ϕ is the driving force (N); G ϕ is the adhesion weight (N); ϕ is the factor of adhesion, here it is selected as 0.8. The rear axle weight is 11,840 kg. When the grader runs at the level ground, the starting driving force can be calculated as 92,826 N. The dynamic radius of the wheel is 0.628 m. The maximum driving torque is 58,294 N m. Continuous driving effort is the driving force that can be generated at any given speed. 15 Due to the relationship between power P, velocity v, and force F, it can be described as
where P is the power (kW), F is the resistance force (N), and v is the driving velocity (m/s). The continuous driving effort will inversely vary with speed at any given level of available power curve. Continuous driving effort is often represented in a graph form at a range of speeds as part of a driving effort curve.16–19
The torque equation can be described as
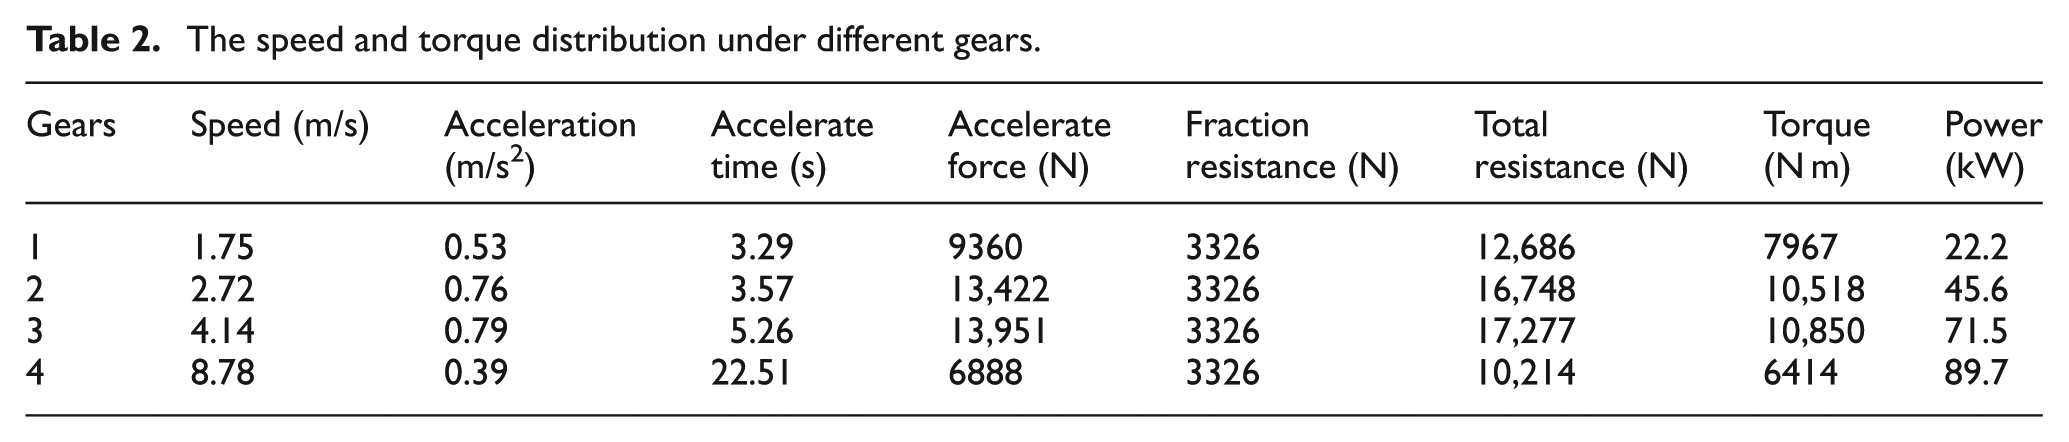
where Mr is the driving torque (N m) and rk is the driving radius of the wheel (m). According to different working conditions, the grader is designed into four speed thresholds, as shown in Table 2.
The speed and torque distribution under different gears.
Furthermore, the torque and power of the engine are calculated as in Table 3.
The working point of the engine under different speeds.

To guarantee the drivability, the load data of the heavy-load mode are used as the basis for the design of the parameters of the power components. The maximum adhesion torque is 58,294 N m. By the calculation, there is some excess driving ability for the engine to satisfy the requirement of the grader. On the other hand, the maximum torque of the engine is much larger than the adhesion torque. As shown in Figure 4, the maximum skip ratio is nearly 0.9, which means most of the energy is converted into the friction thermal energy, which radiates to the environment. The energy is wasted. If the load is light, it is better for the engine work at a lower power curve. Thus, the skip ratio will be lower. The energy can be conserved.

The driving performance of the motor grader.
The principle of shifting the power curve
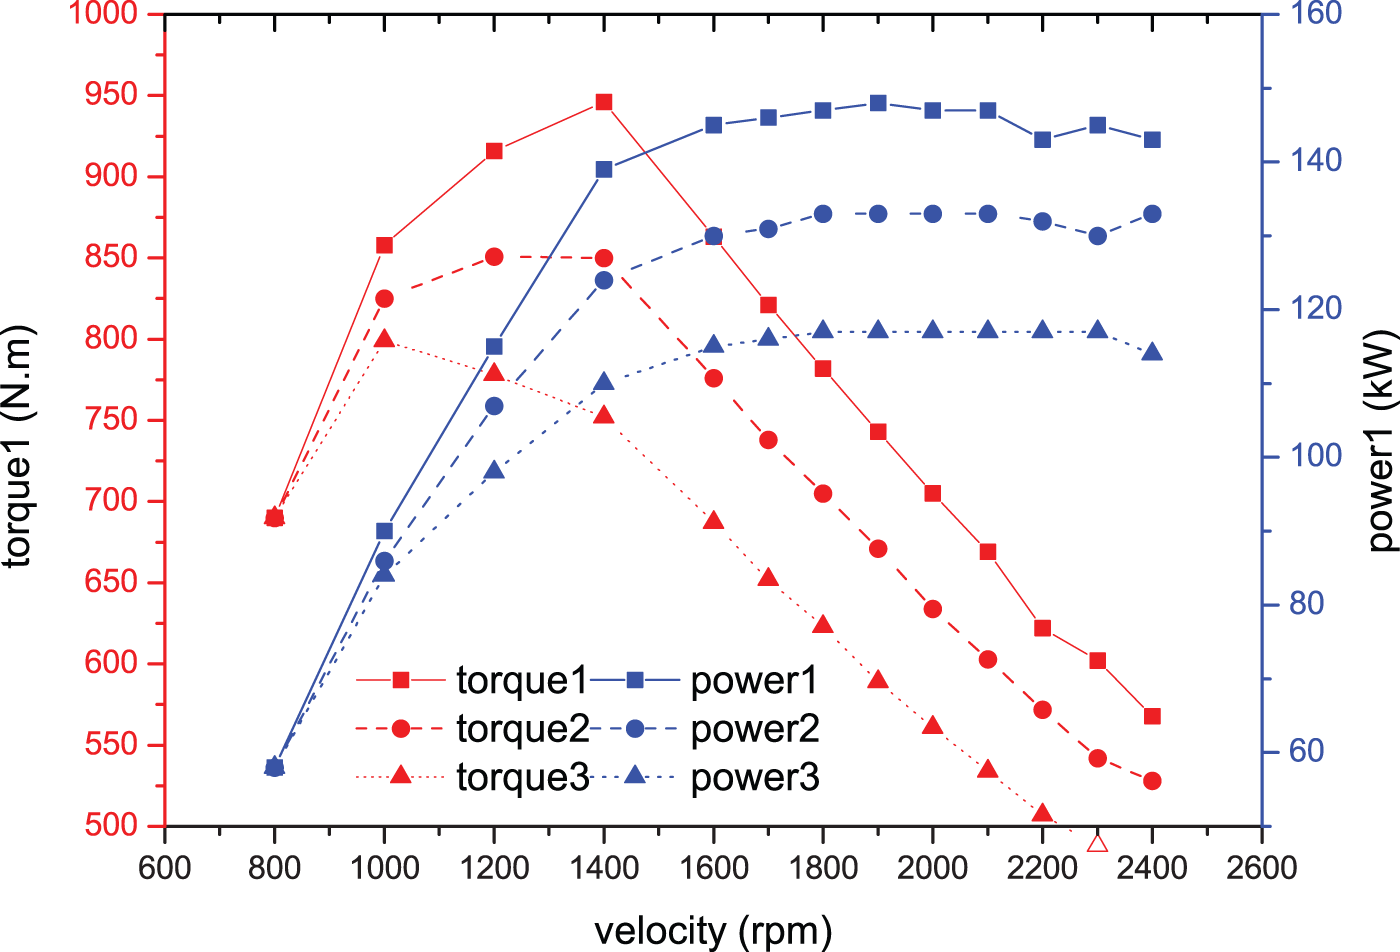
As shown in Figure 5(a), suppose that there are two power curves for the grader engine, which are torque 1 and torque 2. If load 2 is light, the engine work at point A and the fuel consumption rate of the two power curves are the same. However, if load 1 is heavy, the engine will work at point B for the first power curve torque 1 and at point C for the second power curve torque 2. It can be seen that the fuel consumption rate (195 g/kW H) at point C is smaller than that at point B (215 g/kW h). At the same time, the engine torque decreased; furthermore, the engine power also becomes less. The engine costs less fuel at point C than at point B. On the other hand, with the decrease in the slip ratio of the wheel, the tire friction wear also becomes less, which is shown in Figure 5(b). Suppose that there are two power curves for the grader engine; if the engine outputs the power that satisfies a load torque


The power and torque curves of the grader engine: (a) the fuel consumption comparison under different power curves and (b) the energy waste induced by the driving wheel skip.
So, it can be concluded that the fuel consumption difference is
The outline of shifting the power curve is that first, calculate the maximum power requirement of the grader under different gears. Then design some lower power curve below the maximum power curve. When the grader works at different load conditions, the engine can select different power curves according to the load requirement. The maximum power requirement of a grader can be calculated by equation (9) 20
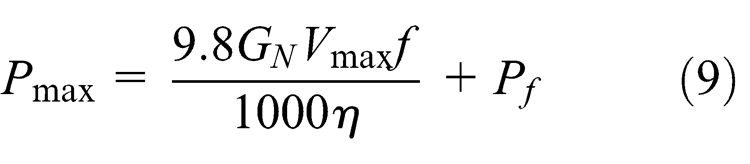
where

As shown in Table 3, the driving performance of the grader is Vmax = 0.83 m/s and GN = 10,500 kg. Selecting
The three power curves of the grader motor.
Fuzzy adaptive controller
It is well known that the grader maneuvering can be highly uncertain, so it is a highly nonlinear and complex dynamical process for the power line control.21–23 Due to the randomness and mutability of the grader load, matching the engine’s working point along the best economical fuel consumption curve will result in the frequent change in the engine speed as well as the frequent adjustment of the hydraulic system, and thus do harm to the stability and operational efficiency of the grader. This article puts forward the fuzzy adaptive control method to divide the grader load into different interval loads, namely, light-load, medium-load, and heavy-load. Then set the engine speed into a corresponding economical fuel consumption point for each load interval and finally avoid the frequent adjustment of both the engine and the hydraulic system. Figure 7 is the schematic diagram of the fuzzy adaptive control system. The input and output values in this control system are a precise value while the calculation of the control is fuzzy. Thus, there is a conversion process of two values in this system. As shown in Figure 7, the deviation value e can be obtained by comparing the system input value r to the output value and we can get de/dt value after the deviation change ratio calculation. Take deviation e and deviation change ratio de/dt as two input signals and enter them into the fuzzy controller after being fuzzified. The signals before entering into the fuzzy controller are the precise values. Change the precise values to be fuzzy set E and fuzzy set C after being fuzzified. E is corresponding to the deviation value, and C is the fuzzy set of the deviation change ratio de/dt. The fuzzy calculator is the core of the fuzzy controller. It summarizes the grader driver’s operation experience and thought process to be fuzzy relations and fuzzy reasoning rules and figures out the relevant control U (a fuzzy set) and produces the precise control value U after the fuzzy judgments to control those being controlled objects.

The schematic diagram of fuzzy controlling system.
This article takes the grader gears as the piecewise controlling basis; sets the engine speed, hydraulic displacement, and hydraulic motor displacement according to the working conditions of each gear; adopts the fuzzy adaptive control method; takes the drive system efficiency together with the engine torque reserve coefficients and so on; outputs the corresponding parameters of the engine speed, displacement of hydraulic pump, and hydraulic motor by the fuzzy adaptive control method; and finally enables the grader drive system adapt to the frequently changing external load while achieving the energy-saving target.
Under the energy-saving model, the hydraulic motor displacement is reduced to keep the running speed unchanged and then the hydraulic system pressure rise high relatively when the output is the same as the traction force. The specific measures are as follows: the controller inspects the hydraulic system pressure and increases the motor displacement when the pressure is inspected beyond the limitation to slow down the grader speed as well as to reduce the pressure. Once the displacement of the motor is adjusted to its maximum limitation and the pressure is still beyond the limitation, then the controller adjusts the displacement of the hydraulic system according to following formula (11) until the pressure is within the limitation

where qp is the displacement of the hydraulic pump (mL/rev), kf is the adjusting coefficient, Np is the input power of the hydraulic pump (kW), ne is the engine speed (r/min), and
The adjustment schematic of the fuzzy adaptive controller.
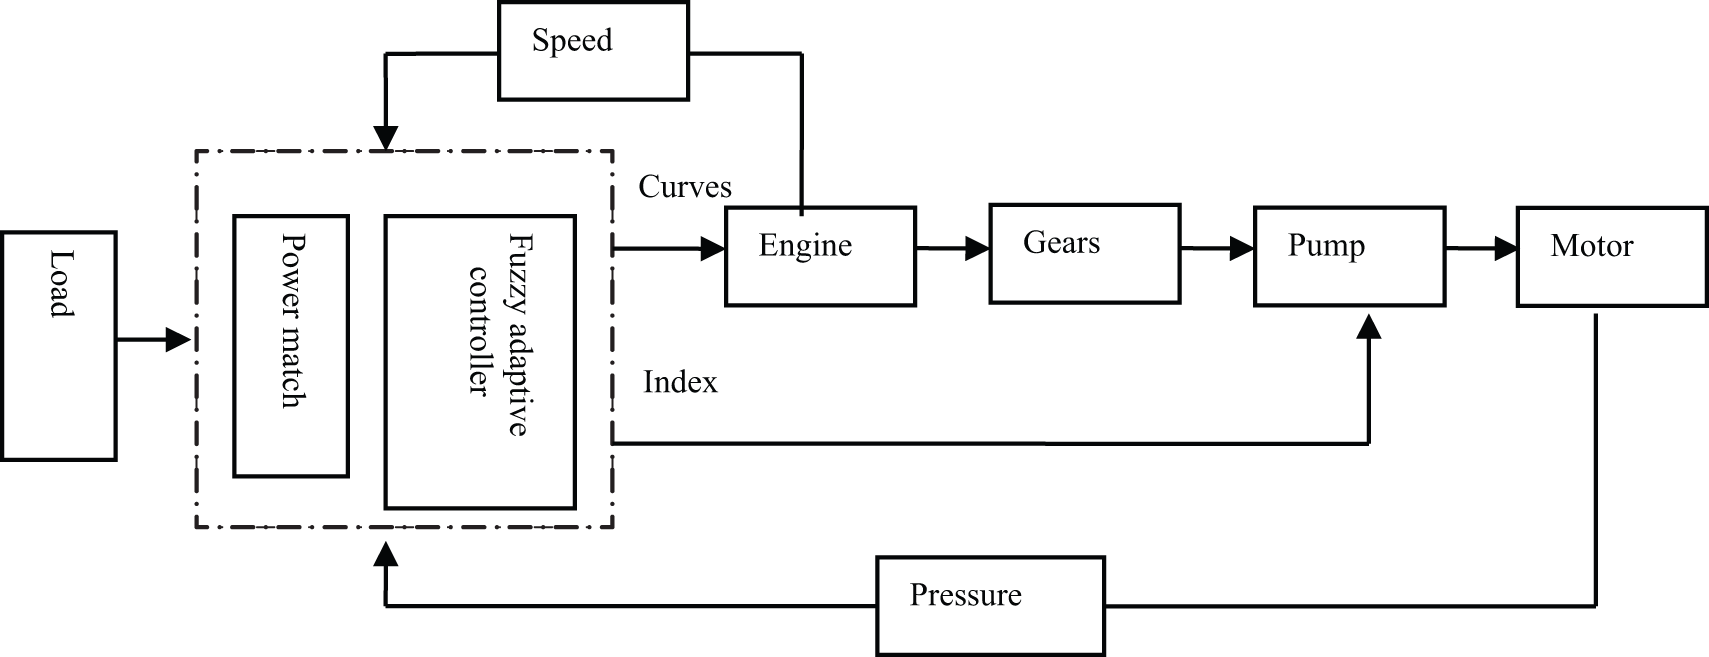
The fuzzy adaptive control role of shifting the power curve of the engine is shown in Figure 9. Under different load conditions and accelerate pedal position, the fuzzy controller compares the real velocity and index value, which is defined by the accelerate pedal. The error and the error gradient are obtained. Based on the expert’s experience, the fuzzy controller outputs the power curve position and the engine working point. It is the same as the engine speed and the hydraulic motor displacement.

The fuzzy control rule for shifting the power curves: (a) concern on error and (b) concern on the error change.
The control schematic outline of the grader is shown in Figure 10, which includes the accelerate pedals, the shift handle, the sensors, and the controller. All the electric units are linked by the controller area network (CAN) bus, as shown in Figure 10(a). The control flow of the controller is shown in Figure 10(b). The grader driver inputs the command into the controller by the accelerate pedal and gear shift handle to keep the grader running at a given speed. Once the controller received the command, it adjusts the output power of the hydraulic pump and motor by the displacement according to the hydraulic pressure and the grader speed. At the same time, it communicates with the engine by the CAN bus. Then the engine adjusts the power curves and working point. Finally, the grader is balanced at some speed and driving force. The skip ratio is low, and the fuel consumption ratio is also low.

The control schematic outline of the grader: (a) the outline of the control system and (b) the engine speed adjustment.
Experiments
Since the load conditions of a motor grader are complicated and without repeatability, the prototype motor grader is designed and manufactured. The experiments are carried out on the prototype grader to compare the fuel consumptions with only a single power curve and with three curves under different load conditions.24,25 The load is animated by another motor grader, whose sizes are 14 and 20 T, respectively, as shown in Figure 11(a). Different size grader means different load conditions, corresponding to light-load and heavy-load. The actual travel speed, driving force, hydraulic pressure, and fuel consumption are recorded, as shown in Figure 11(b). Finally, the energy-saving effect is calculated by the specific fuel consumption of the prototype in each power point with or without shifting the power curve.

The infield experiment pictures: (a) the fuel consumption record unit and (b) the animation load unit.
The driving performance comparison
First, the driving performances of the grader are studied. As shown in Figure 12 and Table 4, the skip ratio is 13% and 38% for the traditional grader with only one single power curve. The skip ratio is 2% and 28% for the prototype grader with three power curves. The driving forces are nearly the same for the prototype and traditional grader. However, the skip ratio decreased nearly 10% for the prototype grader than the traditional grader. The reason is that the engine output power decreases under the control of shifting power curve method, and the ground adhesion ability keeps invariable; at the same time, the engine velocity becomes lower, which is consistent with the theoretical analysis in Figure 12. The maximum hydraulic pressure is 41 and 40 MPa for the two graders. The reference engine velocity is 2314 r/min, which can be shown in the velocity meter in the driver cab. The driving performances for the two graders are nearly the same, but the skip ratio decreases nearly 10% for the proposed energy conservation method.
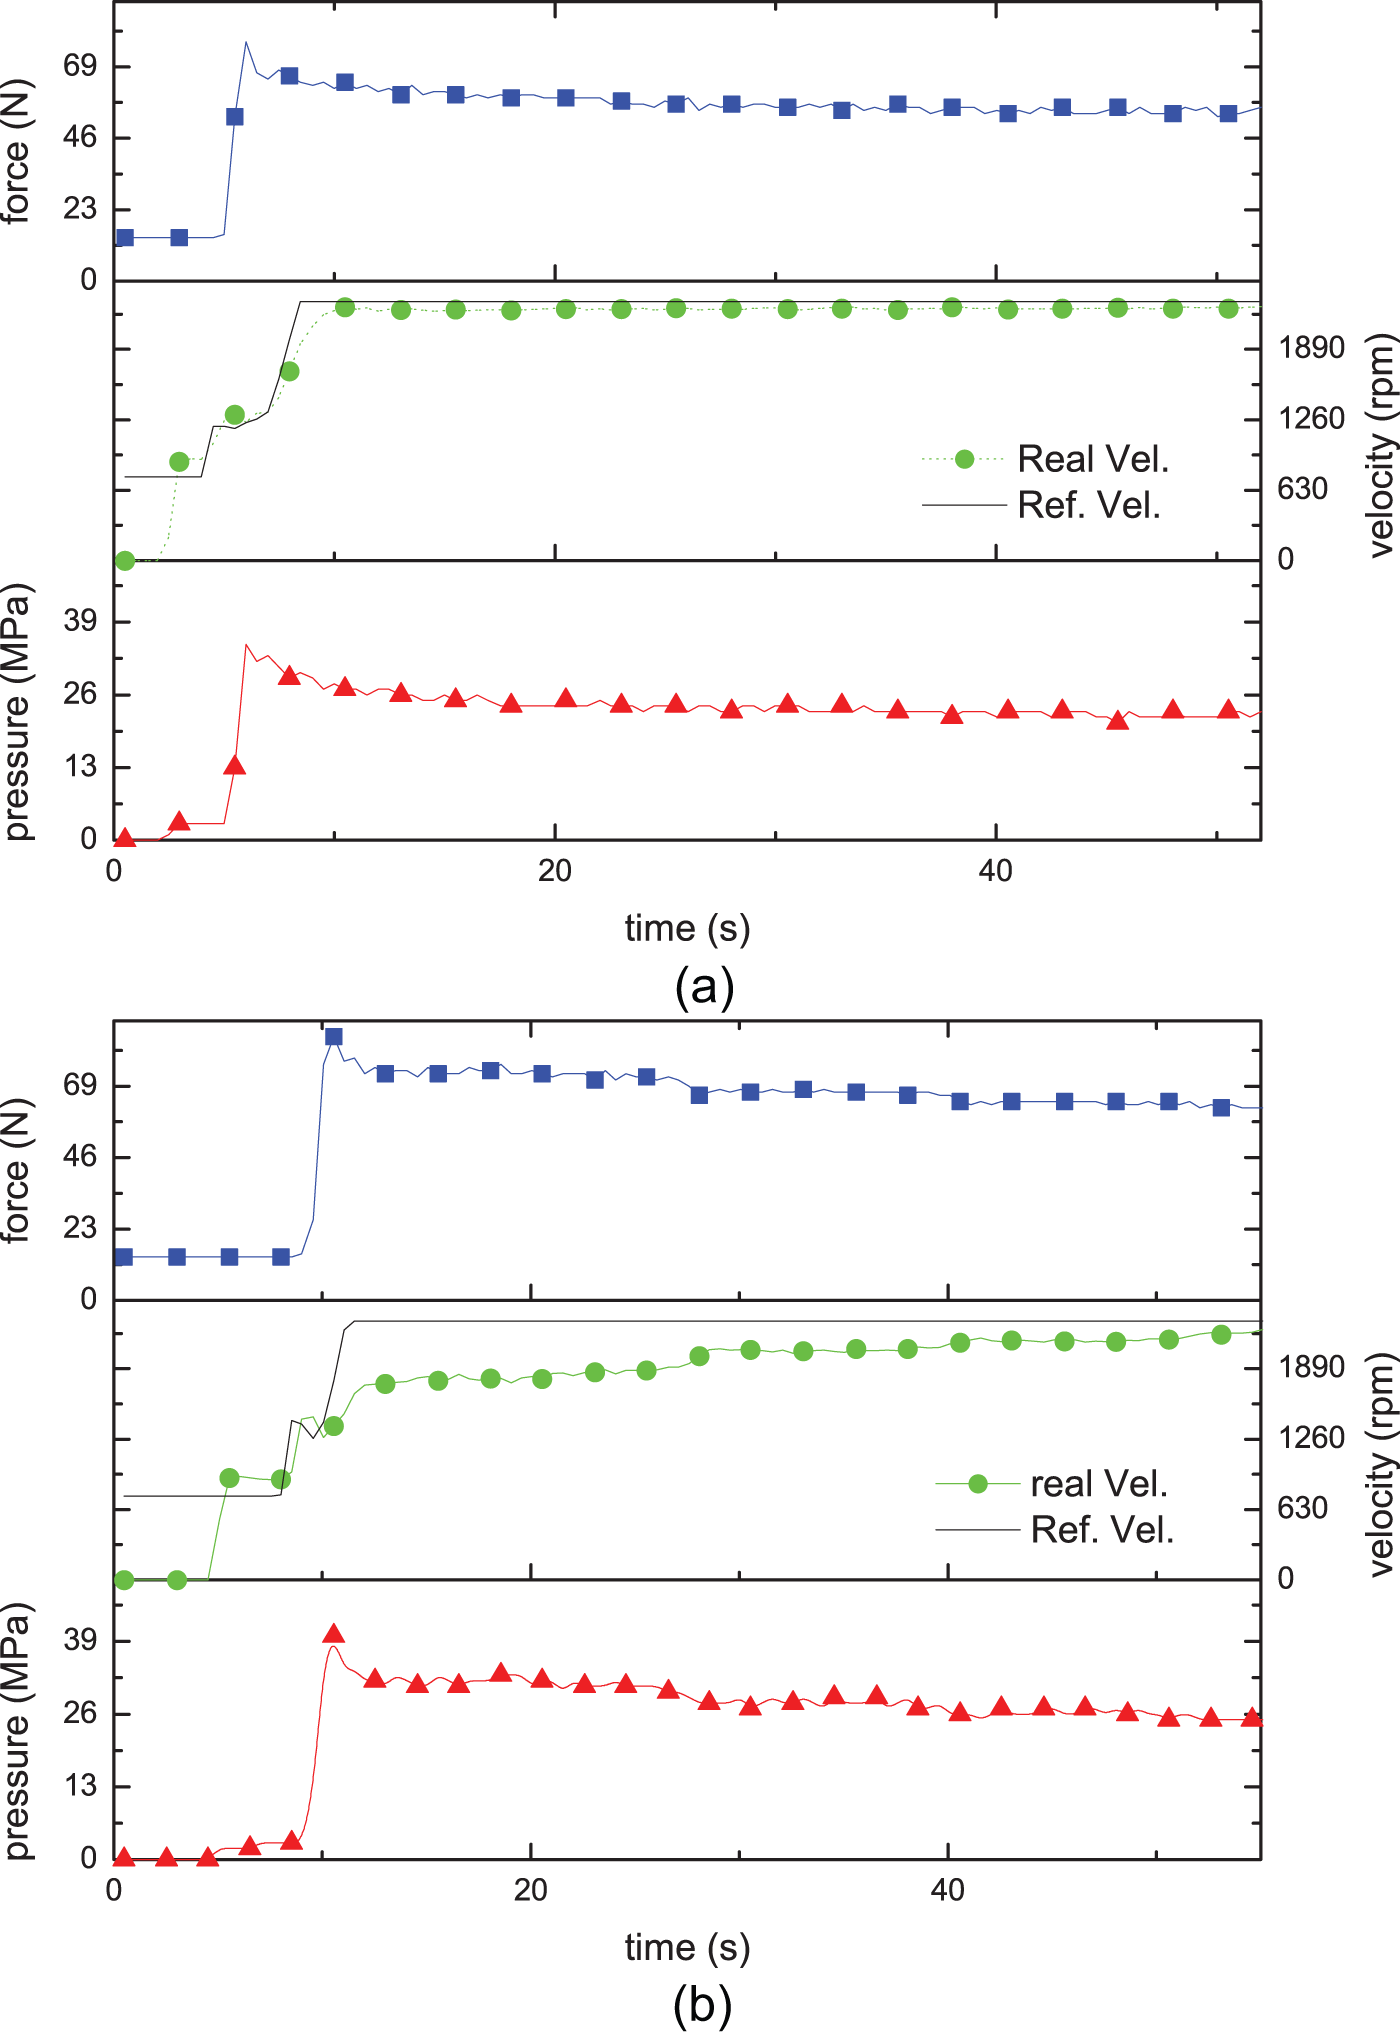
The infield experiment data under heavy load: (a) the drive performance for the prototype grader and (b) the drive performance for the traditional grader.
The driving performance of the motor grader under different power curves.

The contrast experiments of fuel consumption at heavy-load condition
Second, the fuel consumptions are compared for the prototype grader and the traditional grader. From Figure 13, it can be concluded that the energy-saving ratios are 34%, 30%, and 23%, respectively, under different traveling speeds. The reason is that with the increase in the travel speed, the skip ratio will also change. The gradient of the skip ratio will also decrease, so the energy-saving ratio becomes smaller.
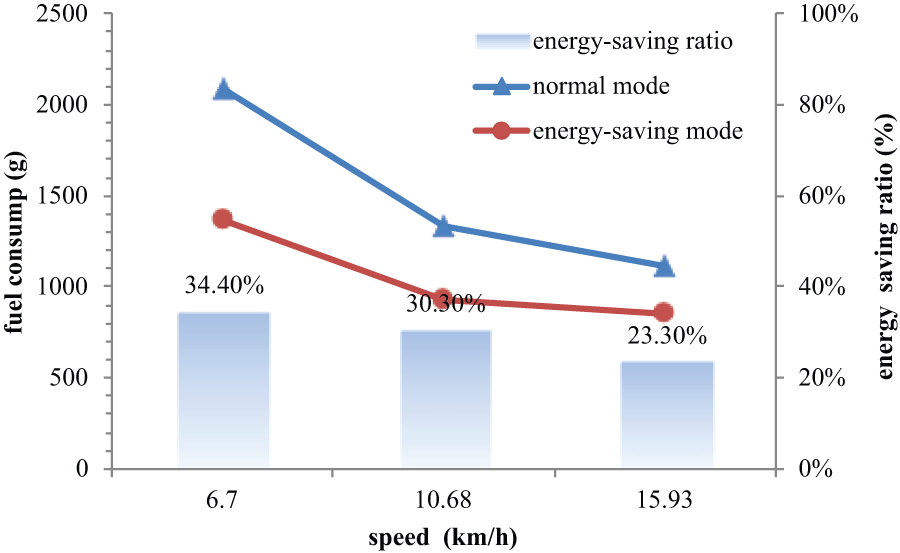
The energy-saving comparative experiments.
The experimental results showed that not only does the fuel consumption ratio decrease but also the driving performance increases. The experiments validate the effectiveness of the energy conservation of the motor grader by shifting the power curves. The methodology can be widely used in the heavy construction machinery, such as the paver, the wheel loader, and rollers. It can conserve the fuel and lessen the environmental pollution and furthermore accelerate the sustainable economic development.
Conclusion
Aiming at the environmental protection and energy diversification, this article studies the features of the drive line of the static hydraulic grader and proposes an energy conservation strategy. The working principle, calculation method, and design procedure of shifting the power curves of a grader engine are depicted. The maximum skip ratio is nearly 0.9 for the traditional grader with only one power curve, which means most of the energy is converted into the friction thermal energy radiating to the environment. Aiming at its strong nonlinear and quick time-variant characteristics of the power system, a fuzzy adaptive controller is proposed to guarantee both robustness and disturbance-attenuation ability of the power system. The results of the experiments show that the energy-saving effect is obvious by this technology and 34%, 30%, and 23% of fuel can be saved, respectively, under different traveling speeds. The skip ratio decreased nearly 10% for the prototype grader than the traditional grader. The methodology can be widely used by the heavy construction machinery, such as the paver, the wheel loader, and rollers. It can conserve the fuel and lessen the environmental pollution and furthermore accelerate the sustainable economic development.
Footnotes
Academic Editor: Jose R Serrano
Declaration of conflicting interests
The authors declare no conflict of interest.
Funding
This project was supported by the National Natural Science Foundation of China (No. 51105043) and Special Fund for Basic Scientific Research of Central Colleges, Chang’an University (CHD2011ZD016).