
Abstract
Driving sleepiness is still a major causes of traffic accidents. Individual drivers, under various conditions, act and respond in different manners. This article presents the attempt of a straight-line driving simulator study that examined the effects of driver behavior style differences and individual differences on driver sleepiness detection which is based on driving performance measures. A total of 15 drivers who were classified into two categories through subjective assessment based on a Driver Behavior Questionnaire participated in driving simulator experiments. A total of 18 detection models, including 15 SE models for each subject, an A model for the aggressive drivers, an NA model for the non-aggressive drivers, and a G model for all experiment participants, were developed using support vector machine method based on driving performance characteristic parameters. The results show that the G model is not suitable for all drivers due to its lower mean accuracy of 69.88% (standard deviation = 7.70%) and higher standard deviation. The SE models for each subject show the best detection accuracy performance of 84.26% (standard deviation = 5.38%); however, it is impossible to set up a special detection model for every individual driver. The SD models on different style categories show an accuracy value of 77.54% (standard deviation = 5.78%). The results demonstrate that driver style differences as well as individual differences have great effects on driver sleepiness detection (F = 19.148, p < 0.000).
Keywords
Introduction
A majority of traffic accidents are largely due to drivers’ improper operation, according to the report of the American National Highway Traffic Safety Administration (NHTSA). The driver performance–related factor, falling asleep, is the most influential factor in the occurrence of fatal single-vehicle runoff road crashes, followed by alcohol use and vehicle speed. 1 Novel approaches have recently been developed to advance intelligent Driver Assistance Systems incorporating sensor data from the driver, vehicle, and surroundings.2,3 With the vehicle information systems and the increasing use of safe Driving Assistance Systems in the car, driving sleepiness detection becomes one of the main objectives in designing driving assistance systems, and the accuracy of driving fatigue detection becomes more important and urgent.
Driving drowsiness can be predicted using driving performance measures since it has been shown that sleep loss produces decrements in driving skills. 4 When fatigue occurs while driving, driver’s body undergoes psychological as well as physiological changes such as yawning, increase in blinking frequency, and distraction, which leads to variation in the driver’s behavior. Driver sleepiness detection is usually achieved using physiological signals such as electroencephalogram (EEG)/electro-oculogram (EOG), eye movement parameter features such as percentage of eye closure (PERCLOS), and variation in the vehicle parameters caused by driver’s operational behavior including lane-related measures, steering-related measures, and heading and lateral acceleration–related measures. 5 Due to its non-invasiveness and real-time performance, the driving sleepiness detection method depending on vehicle parameters, for instance, steering wheel angle and yaw angle, has become more accepted by the researchers. 6
However, drivers’ independent styles were neglected which could influence their driving behavior while it has long been widely acknowledged that drivers engage in vehicular maneuvers in various ways. 7 Their driving behavior characteristics tend to be varied, which is difficult to be accurately quantified. However, drivers are often classified on the basis of different driving styles as the behavioral characteristics of drivers follow some clustering rule. 8 Anecdotal and empirical evidence clearly demonstrates that there are large individual differences in drivers’ behavior to becoming drowsy. Driver Behavior Questionnaire (DBQ)9–11 is a common method to investigate driver’s style classification in early researches.
In this article, we classified drivers into two different categories—aggressive drivers and non-aggressive drivers. It was motivated by the assumption that driving style category differences or individual differences may affect the performance of driving sleepiness detection. For Driver Fatigue Warming System, it works more reliably and effectively if the system performance conforms well to driver’s behavior style. We attempt to find a new method to improve the accuracy of driver sleepiness detection. Therefore, this article presents such a study focused on the effects of driving behavior style differences and individual differences on driving performance measures.
Description of the experiments
Experimental platform
To access in a safe manner, using driving simulator is a preliminary step and it can be used in a generalized manner. The experiment took place in a fixed-base high-fidelity driving simulator, as shown in Figure 1, in the Intelligent Vehicle Research Center (IVRC) of Transportation College of Jilin University. A driving simulator based on a full-size 2009 BESTURN B50 vehicle cabin collects all the data used in this research. This simulator also consists of an image system, a control system, and a sound system. A projection screen was 3.5 m in front of the B50 cabin, which is produced by FAW Car Co., Ltd.

Driving simulator.
Experimental subjects
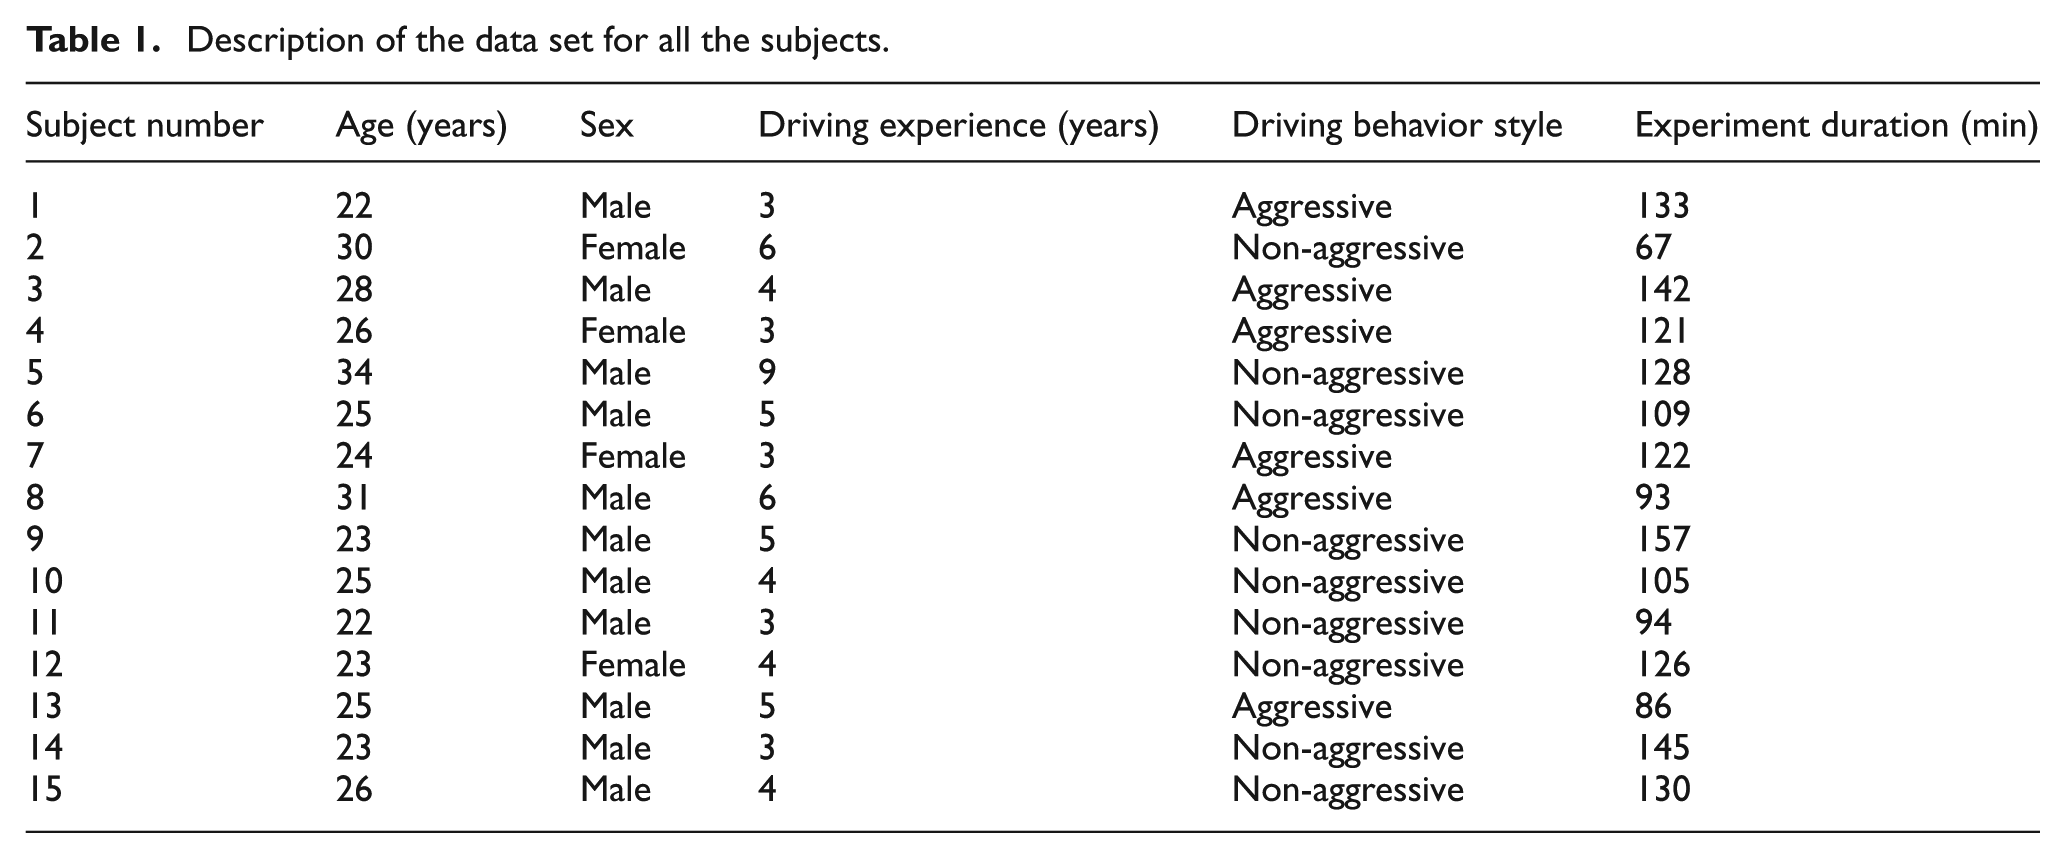
According to the reference materials, 59% drivers of “drowsiness-cited” cases for the 1989–1993 period are under the age of 30 years. 5 Moreover, Lee 12 also finds that fatigue is often cited in the accidents involving young drivers and truck drivers because these drivers tend to adopt risky strategies to drive at night and/or lack good-quality sleep. The experiments were conducted on 15 healthy subjects with ages ranging from 22 to 34 years and a mean age of 25.8 years. All of the participants, with valid licenses and at least 3 years of driving experience, were experienced drivers. Without loss of generality, they were classified into two main groups, six aggressive and nine non-aggressive drivers, through subjective assessment based on a DBQ. The extended version of DBQ, 13 which includes eight slips and lapses, eight mistakes, and eight ordinary and four aggressive violations, could categorize and evaluate aberrant driver behaviors. Participants were asked to indicate how often they committed each of the 28 behaviors in the previous year on a 6-point scale (0, never; 5, nearly all the time), 14 since many different factors, for instance, experience, age, drugs, and emotional conditions, might affect the subjects’ driving behavior. At least 7 h sleep, on no medication and alcohols, and no negative emotions before the experiments were claimed, and all of them had prior experience in driving the simulator.
Experimental scenario
Various scenarios in urban and interurban environment could be chosen in the simulator. A highway scenario, specifically, was used as the driving scenario in this study. The scenario is a 133-km-long highway of a sampled actual Changping Highway located between the Changchun and the Siping cities; there are two 3.75-m-wide lanes in one direction, a 0.5-m-wide hard shoulder, and a 3-m-wide isolation belt. 15 The speed is limited between 80 and 120 km/h marked on the speed limit signs based on the highway design. To induce drivers’ boredom and sleepiness, only sparse oncoming traffic and no traffic driving in the same direction was selected in this experiment.
Experimental process
Cameras were used to record the driver’s facial expressions inside the cabin at 10 Hz during the experimental process. Each subject took part in a 2-h simulator driving task between 1:00 p.m. and 4:00 p.m. or till the driving task was too sleepy to continue. During these time frames, the circadian rhythm shows higher chance of getting sleepy, and drivers are three times more likely to fall asleep at these times than at 10:00 a.m. or at 7:00 p.m. 16 Each participant took 10 min to practice simulator driving at the beginning of the driving simulation experiment. The driving process was divided into two sections depending on subjects’ driving states (alert driving state and sleepy driving state), according to subject’s yawn, blink frequency, and other facial expressions, by experts reviewing the videos (Table 1).
Description of the data set for all the subjects.
Data recording
Driving performance measures that can be used to predict drowsiness are important since it has been shown that sleep loss produces decrements in driving skills. 17 Several steering-related measures have been considered to be accurate and reliable for the detection of drowsiness, all of which are feasible for using a driving sleepiness model.18,19 Heading errors can become a major problem in high-speed driving. Heading, obviously, is closely related to lane maintenance and steering-related measures. It is easy to see that changes in heading and heading rate that could be used to detect drowsiness may also be possible measures. Several heading- and heading-rate-related measures, for example, yaw variance, have been found accurate and reliable to detect driving drowsiness, all of which are feasible for using a driving sleepiness model.15,16 Speed variability, including longitudinal acceleration and velocity maintenance, shows ability of a driver to maintain consistent driving speed applying the brakes and accelerator. 20
Three types of data were recorded synchronously in the experiment:
Driver’s face videos were recorded by digital cameras inside the cabin at 10 Hz.
The forward scenes were recorded by digital cameras outside the cabin at 10 Hz.
To develop a driving sleepiness detection model, some driving performance data were directly obtained from the driving simulator at 10 Hz, including (a) vehicle velocity, (b) vehicle acceleration, (c) steering wheel angle, (d) steering wheel angular velocity, (e) throttle position, (f) yaw angle, and (g) yaw angular velocity.
Detection model
Support vector machine (SVM) method
SVM, based on the counts study theory, is a research hot spot in machine learning domain. In recent years, SVM has become arguably one of the most important developments in supervised classification. Since it was first proposed by Vapnik 21 in 1995, SVM has its unique advantages in pattern recognition, and this method has been successfully applied to a wide variety of domains, such as image processing (e.g. face recognition), text and speech recognition, and bioinformatics (e.g. protein classification) because of outstanding learning performance and good capabilities in generalization. 22 The SVM technique has been used in driving sleepiness detection algorithms with high robustness and practicability.23–25 Figure 2 shows the basic idea of SVM classification in two-dimensional (2D) space.

SVM algorithm. 19
As sleepiness affects driving performance complexly, the learning technique of the SVM method makes it very suitable for measuring the sleepy state while driving. 26
Model training
It is believed that recurrent driving drowsiness usually remains for several minutes. In order to improve the real-time performance, the characteristic parameters of driving performance were extracted in 1-s window. SVM models were trained for each subject and for each type of the driving styles (aggressive and non-aggressive); in addition, a general model was developed as a comparison to study the impact of driving style on driving sleepiness detection.
LIBSVM (library for support vector machine) is one of the most widely used SVM software, and SVM models were trained and tested by the “LIBSVM” MATLAB toolbox. 27 Kernel function is key of the SVM, and the four basic kernels of SVMs are linear, polynomial, radial basis function (RBF), and sigmoid. The RBF is applied to map samples into a higher dimensional space, and it can handle the case when class labels and attributes is a non-linear. In addition, the RBF shows a more robust result compared to other kernel functions, reduces numerical difficulties, and contains less hyper-parameters which influence the complexity of model selection.26,28 Therefore, we chose the RBF as the kernel function for all the SVM models in this research

In this function,
The vector
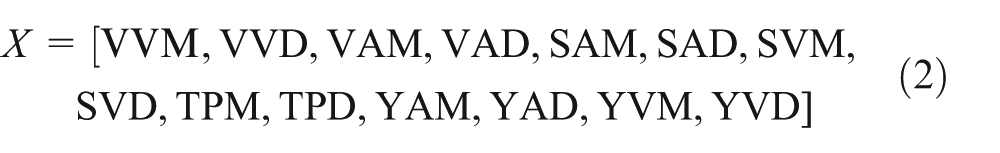

The drivers’ behavior can be modeled through three different approaches. The first approach is finding a specific model for each driver; the second approach is presenting two more general models for aggressive and non-aggressive drivers, respectively; and the third approach is presenting a most general model using the data collected from all the driver subjects.
In this article, 18 sleepiness detection models were developed in total. For each participant, there were 150 training instances, 75 instances of alert state and 75 instances of sleepy state, which were selected based on driver’s facial video images by experts, of drowsiness driving state in a straight-line driving as the model input and other 300 instances for testing. Without loss of generality, 15 specific models for the corresponding participants were developed (SE models). A specific model A (aggressive) for aggressive driving style was developed using 150 instances randomly selected from the six aggressive subjects (nos 1, 3, 4, 7, 8, and 13), and a specific model NA (non-aggressive) for non-aggressive driving style was developed using 150 instances randomly selected from the remaining 9 non-aggressive subjects (SD models). In addition, a general model was developed using 150 instances randomly selected from all the 15 subjects (G model).
Experiment result
We use the mathematical models presented in the previous section to identify driving sleepiness. Figure 3 shows the performance of different SVM models for sleepiness detection. The specific models for each subject (SE models) detected driver sleepiness with a mean accuracy of 84.26% (standard deviation = 5.38%), and the specific models for drivers’ different driving styles (SD models) detected driver sleepiness with a mean accuracy of 77.54% (standard deviation = 5.78%), while the mean accuracy for the general model (G model) is 69.88% (standard deviation = 7.70%).

SVM models detecting accuracy.
One-way analysis of variance (ANOVA) was used to compare the means of detection accuracies for the three SVM model developing methods separately (F = 19.148, p < 0.000), as shown in Tables 3 and 4. It can be observed that the accuracies of these three different approach models have a meaningful and considerable difference.
ANOVA results of the detecting accuracy.

ANOVA: analysis of variance; df: degree of freedom.
Multiple comparisons.

Relative to the non-aggressive drivers, it can be observed that the aggressive drivers (nos 1, 3,4, 7, 8, and 13) are least likely to be detected by the G model (mean = 66.983, standard deviation = 7.707), while the SD models (mean = 79.85, standard deviation = 4.713) and SE models (mean = 86.417, standard deviation = 4.023) have significantly increased detection accuracy. Results show that more aggressive drivers tend to be better detected when grouped by driver behavior style, which is most likely because their actions are more consistent than non-aggressive drivers’ actions.
As the result shows, by classifying drivers according to driving behavior styles and developing models based on three approaches, there are significant differences in the three models (Table 5). The performance of the SE models is obviously better than the G model; moreover, the accuracy performance of the SD models developed for different driving behavior styles works better than that of the G model for all subjects.
Mean accuracy for different driver styles.

A: aggressive; NA: non-aggressive.
Conclusion and future works
This study is exploratory as cautioning the reader because of the limited number of participants. In this article, we have proposed a method based on driver style classification to detect sleepy driving state. The results show that a general SVM model is not suitable for every driver because of the lower accuracy and higher standard deviation. The specific model for each subject shows the best detection performance; however, it is infeasible to set up a special detection model for everyone who drives car. The SD models on different categories increase the value of accuracy although it is obvious behind the G model, yet. Due to the driving performance differences between driving behavior styles and individuals, the driving performance is significantly different in normal driving state. The variation trend and the variation range of different drivers’ driving performance during the transition from alert to sleepy state were different as well. By classifying drivers according to driving behavior styles, there is a significant increase in the aggressive drivers. After all, drivers with different driving behavior styles drive in various ways. Building a specific model for each category classified by driving style represents a promising approach to detect driver sleepiness based on driving performance measures.
By adapting them to the character of the driver, the value of future driver assistance systems can be largely increased. Since these SVM models are based on straight-line simulation driving only, further work should validate these evaluations in real traffic scenarios and curved roads. In addition, more drivers should participate in the experiments. Moreover, other driving style classification approaches should be attempted and on-line driving behavior style detection methods are needed for the Driver Fatigue Warming System.
Footnotes
Academic Editor: Jiin Y Jang
Declaration of conflicting interests
The authors do not have any conflict of interests with the content of the article.
Funding
This research was supported by the International Cooperation Projects of Jilin Science and Technology Department (20130413056GH), the Science Fund of State Key Laboratory of Automotive Safety and Energy under Grant No. KF14182, the Key Science and Technology Program of Changchun City Technology Bureau (2013021-13KG05), and the National Distinguished Young Scholar Foundation Candidate Cultivation Program of Jilin University.