
Abstract
To increase intelligence of walking-assisted devices, it is important to identify motion mode of the subject who wears a walking-assisted device. In this paper, cerebral hemoglobin information was used for recognizing motion mode. Spontaneous upstairs, downstairs, sit-down, and standup movements were performed on seven subjects. During the movement, cerebral hemoglobin information was recorded by applying near-infrared spectroscopic technology. Analyses of variance were performed to compare the rate of change of oxygenated hemoglobin and deoxygenated hemoglobin (oxyHb_rate and deoxyHb_rate) in different motion modes and in different motor-related regions. In PMCR region, oxyHb_rate and deoxyHb_rate were significantly different in the upstairs and downstairs modes(p = 0.001 and p = 0.000); however, they were not obviously different in the sit-down and standup modes (p = 0.914 and p = 0.836). In PMCL region, oxyHb_rate and deoxyHb_rate were significantly different in the downstairs mode (p = 0.008), whereas they were not distinctly different in the upstairs mode (p = 0.601). Results demonstrated that the motion trend of two lower limbs could be identified based on the statistical difference between oxyHb_rate and deoxyHb_rate in the PMCR region. As for cycle-repetitive movement of two lower limbs, upward and downward motion direction could be further recognized based on the difference between oxyHb_rate and deoxyHb_rate in the PMCL region. Since the data using for analyses was those collected before the start of movement, the results will be preferable to provide appropriate reference movements for a walking-assisted device. This is helpful to enhance intelligence of walking-assisted devices.
Keywords
Introduction
Recently, the number of persons with motor dysfunction in lower limbs has been increasing markedly because of natural disasters, injuries, accidents, diseases, and so on. In order to restore patients’ ability of independent walking, there is an urgent demand for intelligent walking-assisted devices. This requires walking-assisted devices to provide auxiliary power in different motion modes and to determine motion mode based on patients’ physiological information rather than an oral command or once selection of buttons. To control the movement of a device by using brain information has been attracting much attention in worldwide.
Commonly used brain imaging technologies include electroencephalography (EEG), magneto encephalography (MEG), functional magnetic resonance imaging (fMRI), and near-infrared spectroscopy (NIRS). 1 Movement is restrained seriously in MEG and fMRI methods; thus, they are not suitable for the application environment with a large range of motion. EEG has a higher time resolution compared to MEG and fMRI. 2 It has become an important study direction of many brain–computer interface research institutions. Tsinghua University realized the control of four-joint prostheses using steady-state visual evoked potential (SSVEP). 3 The prostheses could hold a cup, pour water, put a cup back in place, and return to the initial position. However, the method of SSVEP depends on the vision of persons. It is easy to cause visual fatigue after a long period of operation. Thereby, it is better to control the operating time of the corresponding brain–machine interface. Xi’an Jiaotong University implemented the control of a neural prosthetic hand based on spontaneous EEG technology.4,5 The hand could be controlled in a free state, a motion state, and to perform grab and open actions, whereas spontaneous EEG relies on spontaneous mental activities of subjects. A lot of training is required to produce a particular pattern of EEG. That is, spontaneous EEG is easily to be affected by subjective factors. Moreover, EEG has a poor signal-to-noise ratio during dynamic movements. In comparison, NIRS imaging technique is capable of collecting data during dynamic movements without visually evoked signal or pre-training. It is less susceptible to data corruption by movement. Therefore, NIRS method was applied for recognizing motion modes in this article. And changes in the concentration of hemoglobin were used to reflect cerebral activation level (CAL).
In general, the movements of two lower limbs conclude mirror-symmetric motion trend and cycle-repetitive motion trend. If the motion trend of two lower limbs could be identified, an appropriate reference movement will be provided for the motion controller of a walking-assisted device. In the mirror-symmetric motion trend, the reference movement will be mirror symmetric with the corresponding joint of the healthy limb. In the cycle-repetitive motion trend, the reference movement will be the same as the corresponding joint of the healthy limb in the first half of current gait cycle. In this article, it is hypothesized that motion trend of two lower limbs could be distinguished by referring to CAL in different regions. Statistical analyses were performed to discover the difference of CAL in different motion modes.
Methods
Subjects
Seven healthy volunteers (six males and one female, age: 25 ± 1 years) at Soochow University participated in the motion test. No volunteer had a history of physical or psychiatric disorders. Informed consent was obtained from each volunteer.
Instruments
A FOIRE-3000 optical topography system (Shimadzu Corporation, Kyoto, Japan) 6 was used to measure concentration changes of oxygenated hemoglobin (oxyHb), deoxygenated hemoglobin (deoxyHb), and total hemoglobin (totalHb) (Figure 1). The emitter and detector probes were arranged in a 30-mm square grid. Three wavelengths of the near-infrared light were 780, 805, and 830 mm. The intensity changes at the three wavelengths were converted to relative changes in oxyHb, deoxyHb, and totalHb with the modified Beer–Lambert law (BLL). 7 The infrared light could detect variation in cerebral blood volumes at around 20–30 mm below the scalp. 8 The sampling period of hemoglobin signals was 0.13 s.

Cerebral activation measurement: (a) sit-down–standup, (b) upstairs–downstairs, and (c) distribution of the detected channels in the motor-related region.
One set of 5 × 7 parietal flash holder was applied to fix emitters and detectors. In the experiment, 16 probes (8 detectors and 8 emitters) were used to collect cerebral activation data in a 4 × 4 area (Figure 1). Based on the international 10–20 system,9–12 the probe holder was placed on the top of the head with the midpoint of emitter 7 and detector 8 being placed in Cz portion. The number of measurement channels was 24. The locations of each measurement channels are shown by the white rectangles with digital numbers in Figure 1. In all 24 channel signals, the regions of interest included sensorimotor cortices (SMCs: channels 19, 20, and 23), supplementary motor areas (SMAs: channels 9, 12, 13, and 16), premotor cortices (PMCL: channels 8 and 15 in the left hemisphere; PMCR: channels 10 and 17 in the right hemisphere), and pre-supplementary motor areas (pre-SMAs: channels 5 and 6). Miyai et al. 13 have confirmed that the medial sensorimotor cortices were mainly associated with motion activations of lower limbs, and arm swing without walking activated more lateral and rostral parts of the primary sensorimotor cortex.
SMCs mainly give movement commands to different physical parts;7,14 SMA is associated with the planning of motor actions and guiding self-initiated bimanual control. 15 It has a role in updating motor plans for temporally ordered subsequent movements and temporal–spatial adjustment movements.13,16,17 Pre-SMA is mainly associated with the planning of motor actions; 18 and PMC is involved in preparation of movements for control and posture; 19 selection, planning, and execution of voluntary movements;20,21 and mediating motor behavior according to environmental cues.22,23 Therefore, these regions were considered as motor-related regions. Since Li et al. 24 have proved that the oscillation in interval between 0.02 and 0.06 Hz was considered to reflect the neurogenic activity in the vessel wall, a band-pass filter with an upper cut-off frequency of 0.06 Hz and a lower cut-off frequency of 0.02 Hz was performed to filter high-frequency noise and low-frequency noise that were present in the channel signals.
Motion tasks
In order to identify motion trend of two lower limbs, the subjects were asked to perform sit-down–standup movement and upstairs–downstairs movement, which are representative motions of mirror-symmetric motions and cycle-repetitive motions of two lower limbs. All the movements were performed spontaneously, which are more natural compared to evoked movements and are general motion actions in daily life. Once the motion trend of two lower limbs in spontaneous modes was recognized, it will be favorable to provide appropriate reference movement for the impaired limb or a walking-assisted device in daily life.
As for the sit-down–standup movement (Figure 2), the rest period between two tasks was around 20 s, and the rest period before the first task and after the last task was around 10 s. Once sit-down and once standup were considered as once sit-down–standup movement. And the sit-down–standup movement was repeated four times. As for the upstairs–downstairs movement (Figure 3), the rest period between two tasks was around 30 s, and the rest period before the first task and after the last task was around 15 s. All the rest times were not fixed because it is controlled by the subjects themselves. There were four stairs for upstairs and downstairs, respectively. Since the data lines of FOIRE-3000 were not long enough, the subjects were requested to recede back the original place for the next upstairs task. Once upstairs, once downstairs, and once receding were considered as once upstairs–downstairs movement. The upstairs–downstairs movement was repeated four times as well. In each motion mode, when the motion status was changed (rest to motion or motion to rest), the time was recorded with a mark by an experiment operator. In the upstairs–downstairs motion mode, in order to reduce the gravitational force caused by the data lines of FOIRE-3000, another person held the data lines and walked aside the subjects during the experiments. Before the recorded experiment, the subjects practiced the upstairs–downstairs movement two times to learn how to coordinate with another person and to familiarize themselves with the task. Meanwhile, they practiced the sit-down–standup movement two times to familiarize themselves with the corresponding task too. During the experiment, the hemoglobin concentration of the subjects was recorded simultaneously.

Sit-down–standup movement.

Upstairs–downstairs movement.
Statistical analysis
The data collected during the receding back of upstairs–downstairs were not considered for data analyses. The concentration change in oxyHb and deoxyHb was used to reflect CAL. Data processing includes the following four steps:
For each subject, calculate the rates of change of oxyHb and deoxyHb in each concerned channel for time courses of hemoglobin concentration during all the movements. The calculated rates were recorded with oxyHb_rate and deoxyHb_rate.
For both oxyHb_rate and deoxyHb_rate in each channel, average the three cerebral values obtained before each task, including the data in the mark point and the two data previous the mark. The data sampled before the mark were used so as to identify the motion trend of lower limbs on an early start. This facilitates for providing valid reference movement for the impaired side quickly. After calculation, four values corresponding to four movement repetitions were achieved for each subject in each motion mode (sit-down, standup, upstairs, and downstairs). Altogether, there were 32 values (2 kinds of hemoglobin data × 4 motion modes × 4 movement repetitions) in each channel for each subject.
Average the values in the channels of each region. Now, there were 160 values (2 kinds of hemoglobin data × 4 motion modes × 4 movement repetitions × 5 regions) for each subject. For example, in the sit-down motion mode, each region has four oxyHb_rate means:
Average the corresponding data of the seven subjects. Finally, 160 cerebral values were obtained for all the subjects.
To confirm the effects of “Hb_rateind” (oxyHb_rate and deoxyHb_rate) and “Region” (SMC, SMA, pre-SMA, PMCL, and PMCR) on “Mode” (different motion modes), a three-way analysis of variance (ANOVA3) on “Mode” × “Hb_rateind” × “Region” was performed. If an interaction among the three factors was significant, the simple main effect of “Hb_rateind” for the interaction between “Hb_rateind” and “Mode” in each region would be further analyzed. This was aimed at confirming the difference between oxyHb_rate and deoxyHb_rate in different motion modes in each region. The statistical analyses were performed with SPSS software (IBM SPSS Statistics 19). Statistical significance was set at p < 0.05.
Results and discussion
In order to achieve four groups of available data for each subject, if the measured data had a steeping ascend during the process of some repetition task, the subject was required to perform the corresponding task once more. Figure 4 gives representative average time courses of hemoglobin concentration in the five regions during the upstairs–downstairs movements. It is obvious that the motor-related regions were apparently activated. Comparatively, the motor-related regions were activated much more apparently during the sit-down–standup movements.
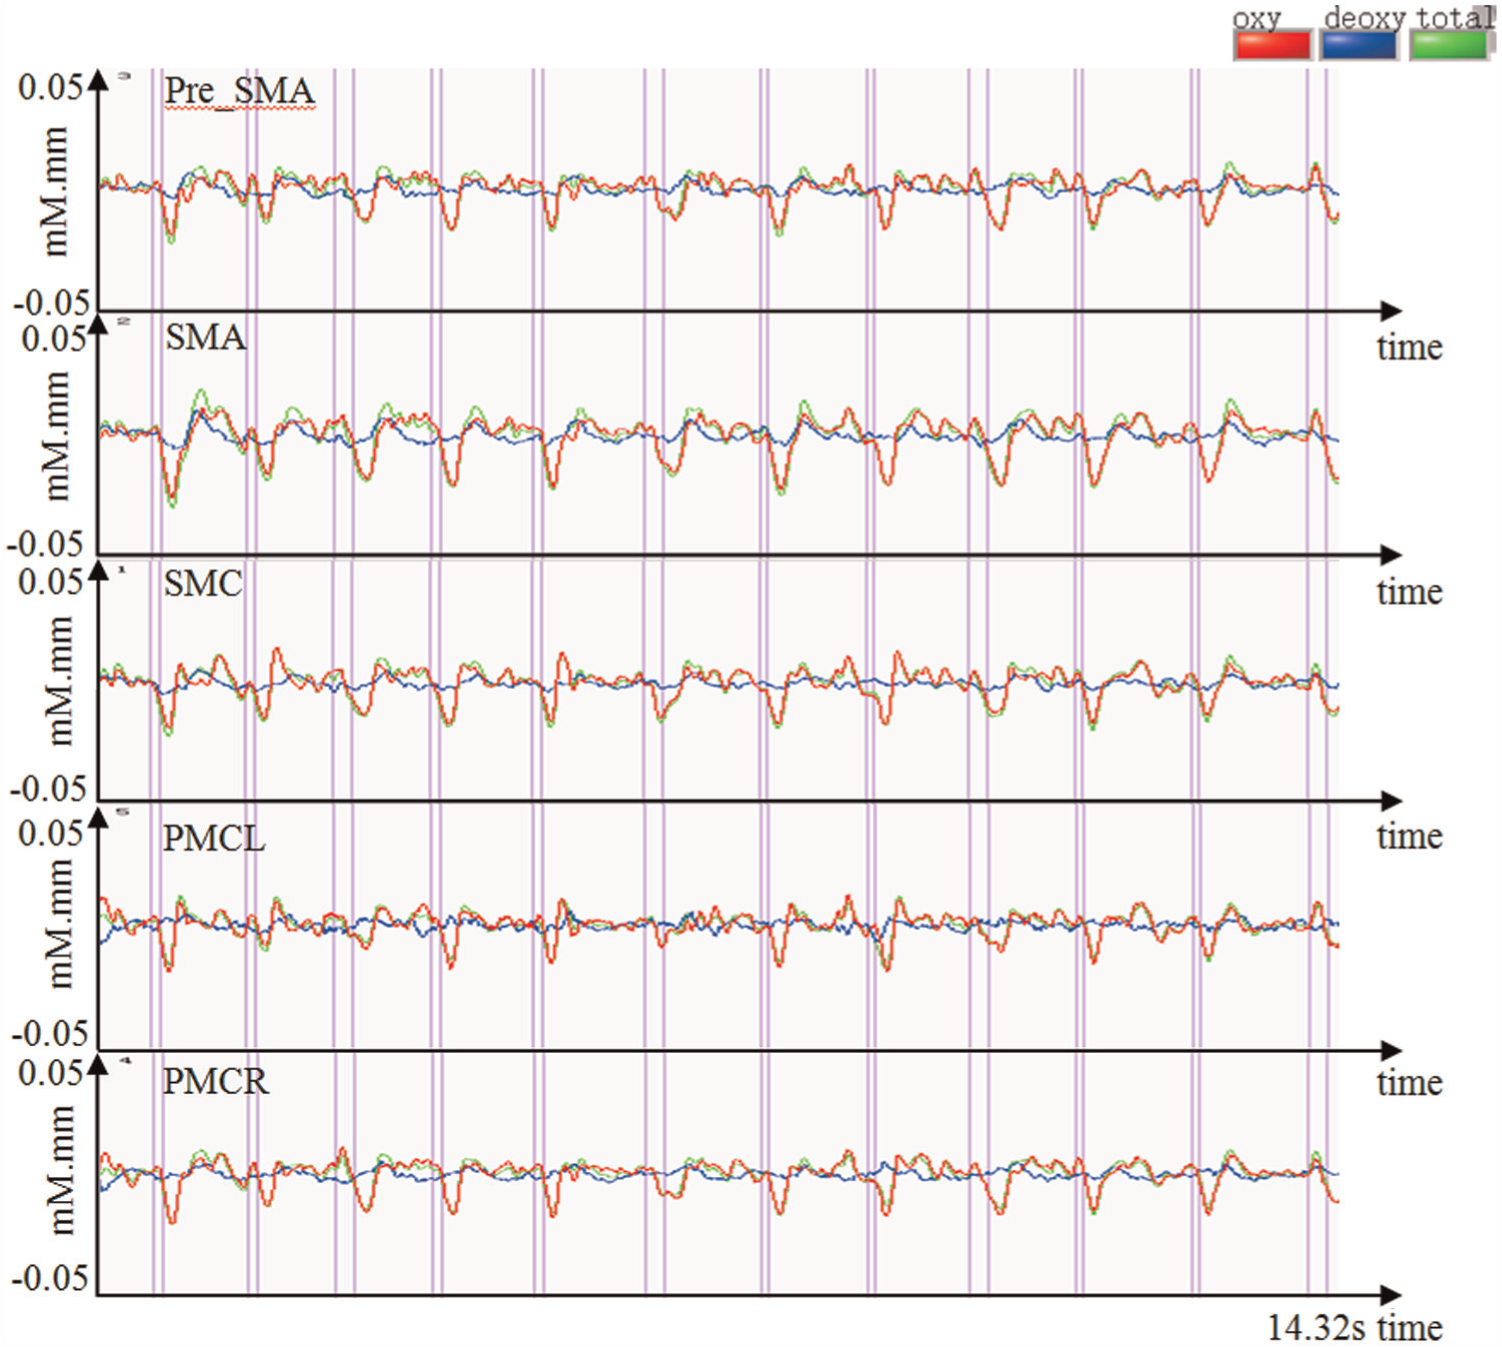
Representative average time courses of hemoglobin concentration during the upstairs–downstairs movements.
ANOVA3 showed that there was a distinct interaction among the three factors (p = 0.022). The results of the simple main effect of “Hb_rateind” for the interaction between “Hb_rateind” and “Mode” were given in Table 1. It can be seen that in the PMCR region (Figure 5), there was a significant difference between oxyHb_rate and deoxyHb_rate in the upstairs (p = 0.001) and downstairs (p = 0.000) motion modes. However, the difference between oxyHb_rate and deoxyHb_rate in the sit-down (p = 0.914) and standup (p = 0.836) motion modes was not distinct. And the corresponding p values were much larger than those achieved in the upstairs and downstairs motion modes. In the PMCL region (Figure 5), there was a significant difference between oxyHb_rate and deoxyHb_rate in the downstairs (p = 0.008) motion mode, but there was no distinct difference in the other three motion modes. In the regions of pre-SMA, SMA, and SMC, the oxyHb_rate was obviously larger than deoxyHb_rate in each motion mode (Figure 6). However, in the SMA region, the main effect of “Hb_rateind” for the interaction between “Hb_rateind” and “Mode” was not distinct (p = 0.158) in the standup mode. In the SMC region, the main effects of “Hb_rateind” in the motion modes of upstairs, downstairs, and sit-down were also insignificant (0.352, 0.103, and 0.091). Overall, the corresponding p values (0.158, 0.352, 0.103, and 0.091) were not as large as those obtained in the PMCR region (sit-down: p = 0.914, standup: p = 0.836) and in the PMCL region (upstairs: p = 0.601, sit-down: p = 0.932).
The p values of the simple main effect of “Hb_rateind” for the interaction between “Hb_rateind” and “Mode” in different regions.

PMCL: premotor cortices in the left hemisphere; PMCR: premotor cortices in the right hemisphere; pre-SMA: pre-supplementary motor area; SMA: supplementary motor area; SMC: sensorimotor cortex.

Estimate marginal means in the PMCR region. The asterisk with the same color denotes that oxyHb_rate and deoxyHb_rate were significantly different in the motion mode.
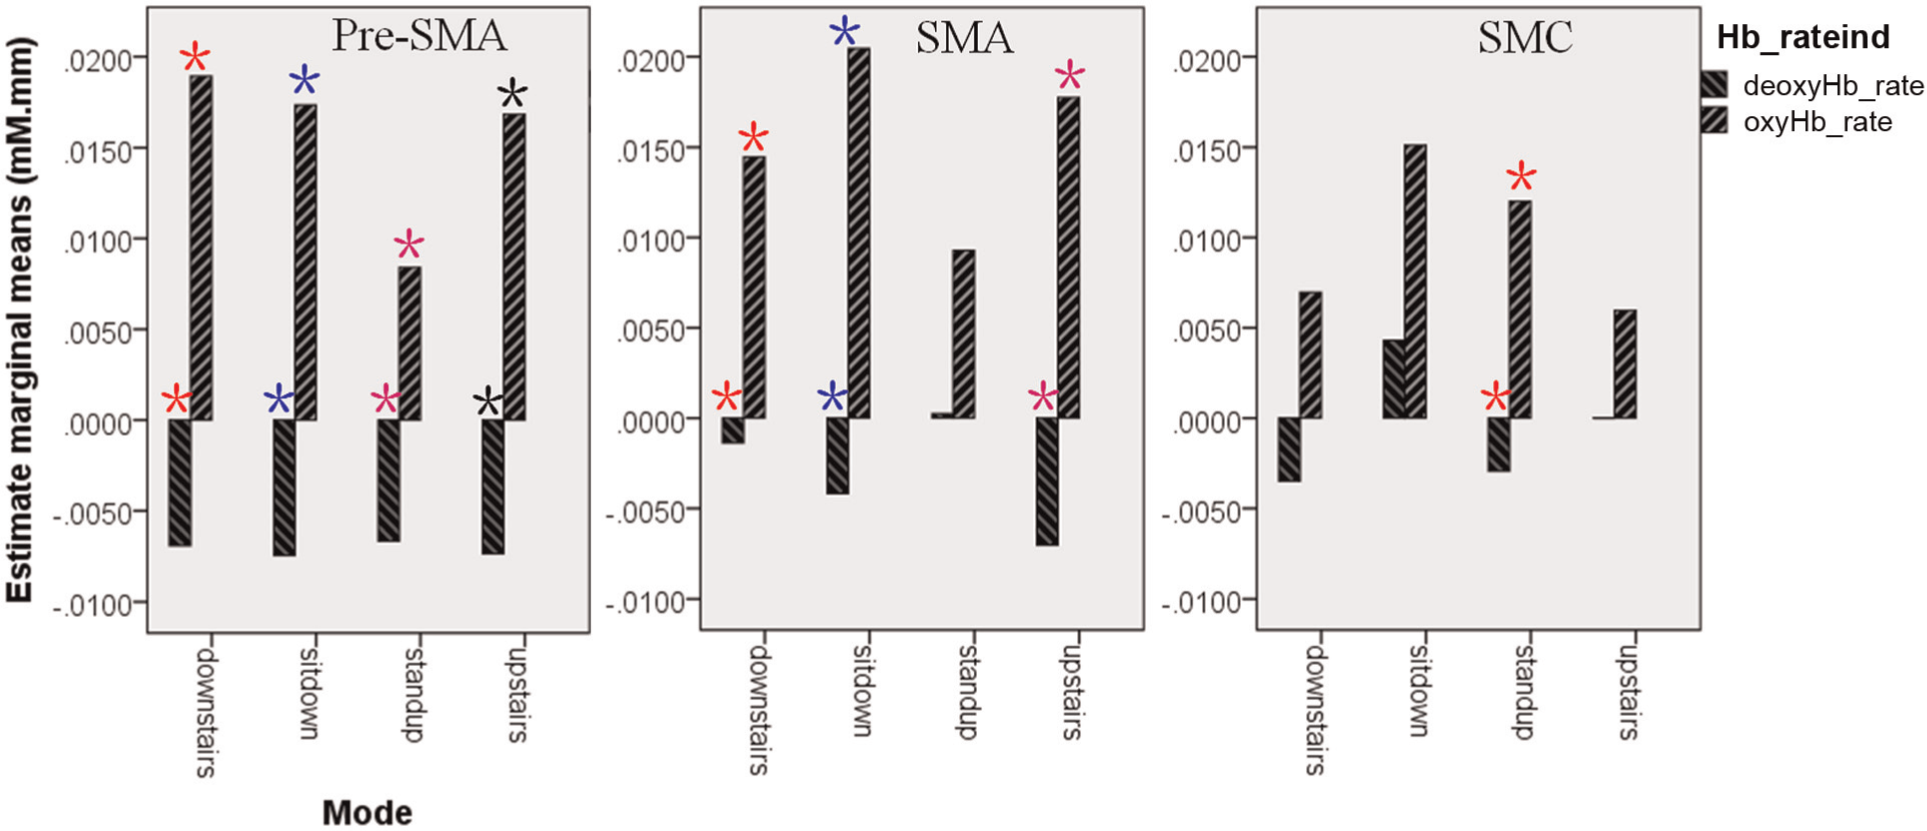
Estimate marginal means in the pre-SMA, SMA, and SMC regions. The asterisk with the same color denotes that oxyHb_rate and deoxyHb_rate were significantly different in the motion mode.
In order to distinguish motion trend of two lower limbs, a threshold of 0.5 was set for the p values. That is, in the same region, if the main effect in motion mode A was significant, whereas the main effect in the motion mode B was not distinct and the corresponding p value was larger than 0.5, it is considered that the motion modes A and B could be distinguished. Here, 0.5 rather than a smaller value was selected as the threshold because if there was noise in some channel or the probe holder was fixed with a small bias, the main effect of some interested factor may be affected to be insignificant but with an obvious trend. Therefore, the larger the threshold, it is easier to distinguish motion mode. On the other hand, under the influence of noise or inaccurately placed probe holder, the p values may be affected to reduce. Thus, the defined threshold was not very large. Based on this setting of threshold, the mirror-symmetric motion (sit-down and standup) and cycle-repetitive motion (upstairs and downstairs) of two lower limbs could be identified by referring to the main effect of “Hb_rateind” for the interaction between “Hb_rateind” and “Mode” in the PMCR region.
In addition, in the PMCL region, the main effect of “Hb_rateind” was significant in the downstairs motion mode (p = 0.008), but it was not obvious in the upstairs motion mode (p = 0.601). Therefore, under the promise of identifying the motion trend of two lower limbs, the upstairs and downstairs could be further distinguished.
Based on the above results, an appropriate reference movement could be provided for a walking-assisted device located at the side of the impaired limb. That is, if the two lower limbs perform mirror-symmetric movement, the reference movement should be the same as the corresponding joint of the healthy limb. If the two lower limbs perform cycle-repetitive movement, the reference movement and the movement in the corresponding joint of the healthy limb should be symmetric in cycle and should have a time delay of half a gait cycle. This is very helpful for realizing intelligent control for walking-assisted devices.
Meanwhile, based on the analysis results, it can be concluded that the PMCR region plays an important role on the preparation for controlling the motion trend of two lower limbs in voluntary movements. This is consistent with the summary presented in studies.20,21 And the PMCL region may be associated with coordinating the motion balance of two lower limbs in downward cycle-respective movements. However, the number of subjects in the experiment was only seven. The function of these two regions should be further verified by performing many more experiments on more subjects.
Conclusion
In this article, hemoglobin information in cerebral cortex was detected simultaneously during the process of upstairs, downstairs, sit-down, and standup movements. ANOVA3 was performed on oxyHb_rate and deoxyHb_rate. The statistical results in the PMCR region confirms that motion trend of two lower limbs could be identified. And the statistical results in the PMCL region could be used for distinguishing upstairs and downstairs. This is beneficial in providing a favorite reference movement for a walking-assisted device.
However, the accuracy of identification should be further confirmed on many more subjects. Besides only the four motion modes were considered in the experiment, other movements such as upslope, downslope, walking forward, receding back, and squat should also be studied. In the future study, other motion modes will be considered, and a more general method will be presented for recognizing different motion modes.
Footnotes
Academic Editor: Zhuming Bi
Declaration of conflicting interests
The authors declare that there is no conflict of interest.
Funding
This work was supported by National Natural Science Foundation of China (grant nos 61203367, BK2012215) and the National High Technology Research and Development Program (2015AA042301), China.