
Abstract
A novel fiber Bragg grating direct current sensor with intrinsic temperature compensation is presented in this article. The operating principle of the sensor is based on the deflection of a cantilever beam due to the electromagnetic force between a static-iron and a moving-iron attached to the free end of the cantilever which is enclosed within a solenoid through which the current under test is passed. The deflection of the cantilever beam is measured by differential strain sensing using two fiber Bragg gratings mounted on either side of the beam, thus achieving temperature compensation. The sensor operation is theoretically described, and experimental measurements confirm the operation of the fiber Bragg grating direct current sensor up to 500 A. A 382-pm Bragg wavelength shift difference is detected when the current is 500 A. The test results are analyzed and discussed in the time domain and frequency domain. The resistance to electromagnetic interference immunity of the fiber Bragg grating sensor is improved compared with the strain gauge sensor.
Keywords
Introduction
The measurement of electric current is required in various industries, particularly in the electrical power industry. Current sensors provide valuable information for measurement, monitoring, control, and relay protection. 1 Shunt resistors can be used to measure the current; for high-current applications, this can lead to a large power loss. A small shunt resistance can be used to minimize the power loss; however, a high gain amplifier must be used which limits the bandwidth of the sensor. Also, for low-resistance shunts, the temperature dependence of the contact resistance between the shunt and the associated instrumentation circuit board can lead to significant temperature errors. 2 Also, the shunt resistor must be incorporated into the electrical circuit and is sensitive to electromagnetic interference. A Hall effect–based current sensor, based on a simple structure, has been developed with fast response time, but it is difficult to solve the temperature drift problem. 3 Faraday effect–based all fiber current sensors have problems including mechanical stress, thermal stress, and manufacturing imperfections. Commercial sensors have been developed by ABB and NxtPhase.4–8 Interferometric optical fiber current sensors have also been demonstrated based on the Sagnac, Fabry–Pérot, and Mach–Zehnder configurations9,10; however, these sensors are typically used only in the laboratory because of noise and sensing signal drift. Hybrid optical–electrical systems have been developed using Rogowski coils; however, the conversion of optical power to electrical power for the demodulation electronics and electrical signal to optical signal for remote operation complicates the system design.11,12
Fiber Bragg grating (FBG) sensors can be used to measure many parameters, such as temperature, load, strain, vibration, pressure, and acceleration. Many successful applications in fields including aerospace, civil, and marine engineering have been reported, which exploit the intrinsic benefits of optical fiber sensors such as immunity to electromagnetic interference, electrical insulation, high reliability, small size and distributed measurement, 13 and so on. At present, FBG-based current sensing is becoming an important direction of research and exploration. In Joule heating–based current sensors, it is difficult to distinguish the influence of ambient temperature from Joule heating. The optical fiber is coated by metal, and the heat generated by current passing through the metal coating changes the physical length and refractive index of the fiber, which is detected using an interferometric technique or a FBG. 14 FBG sensors based on the magnetostrictive effect have also been reported, where the FBG is bonded to giant magnetostrictive material (GMM) which stretches the fiber due to the action of magnetic field of electric current, and the current is detected15,16; however, the temperature effect of GMM affects the performance of the sensor. A fiber optic current sensor based on electromagnetic force was developed by Yao et al. 17 Dai et al. 18 investigated a novel fiber optic sensor based on magnetic fluid and etched gratings, but they did not consider the influence of ambient temperature. Zhao et al. 19 developed a novel current measurement based on FBG sensor technology; however, the current measurement has only the whole range from 0 to 400 mA. In this article, a novel FBG direct current (DC) sensor with temperature compensation based on electromagnetic force is developed, and the FBG DC sensor is demonstrated up to 500 A.
This article is organized as follows: In section “Operating principle and design,” the principle of the FBG DC sensor with temperature compensation based on electromagnetic force is analyzed, and the FBG DC sensor structure is proposed and designed. In section “Experimental setup,” the experimental setup of the FBG DC experimental system is presented. In section “Results and discussion,” the test results are analyzed and discussed in the time domain and frequency domain. Finally, section “Conclusion” concludes this article.
Operating principle and design
The schematic representation of FBG DC sensor with temperature compensation based on electromagnetic force is shown in Figure 1. Moving-iron, static-iron, two FBG sensors, the cantilever beam, and plate are installed in a solenoid. The cantilever beam is fixed between the moving-iron and the plate. The static-iron is fixed on the plate with a holder. Two FBG sensors are bonded to opposite sides of a cantilever beam as optical strain gauges. When DC passes through the wire of the solenoid, the moving-iron and static-iron will be magnetized and attracted toward each other. This results in a deflection of the cantilever beam which generates opposite strain in the two FBG sensors. The cantilever deflection is proportional to the differential strain, and thus, the difference between FBG1 and FBG2 is insensitive to temperature assuming that there is no thermal gradient across the cantilever beam.

Schematic representation of the FBG DC sensor.
Operating principle of FBG DC sensor based on electromagnetic force
When the DC to be measured flows through the solenoid, a uniform magnetic field is produced inside the solenoid coil which magnetizes the moving-iron and static-iron. The electromagnetic attraction force will be produced between the moving-iron and static-iron because the magnetic field of the moving-iron and static-iron has opposite polarities. 20 The electromagnetic attraction force (F) can be described as

where DC (I) is the current of coil (A),
The cantilever beam will be deflected by the attractive electromagnetic force (F). The strain

where x is the distance from the bonded FBG1 or FBG2 position to the applied location of the electromagnetic attraction force,
When the strain or the temperature of the FBG sensor changes, the center wavelength of the FBG (
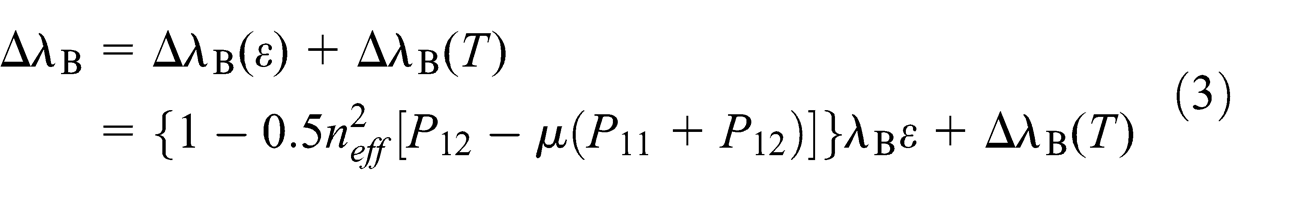
where
Because FBG1 and FBG2 are very close to each other, shifts of their Bragg wavelengths due to temperature are considered to be identical, but wavelength shifts due to the strain are in opposite directions with the same absolute values. Based on this differential measurement method and the designed structure, the Bragg wavelengths will move, respectively, toward longer and shorter wavelength direction,19,22,23 and their Bragg wavelength shift difference (
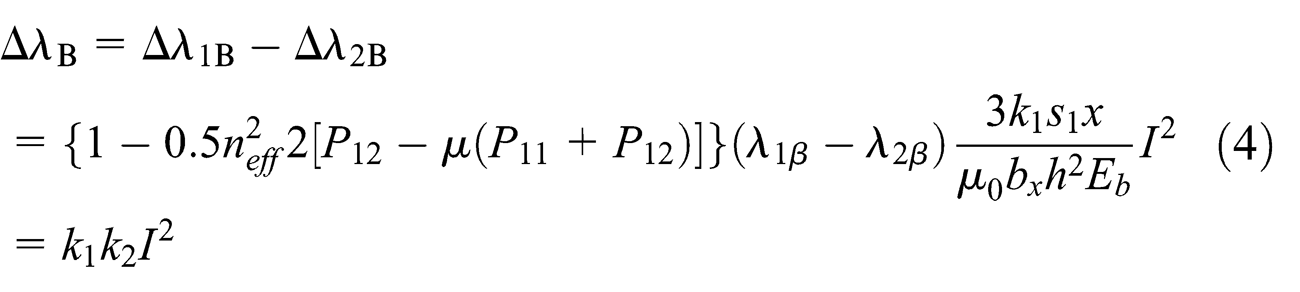
where
DC (I) can be obtained from the Bragg wavelength shift difference (
Design of FBG DC sensor with temperature compensation
The picture of FBG DC sensor is shown in Figure 2. The 70-mm-wide solenoid (three turns of multi-strand soft copper wire) has a diameter of 130 mm. The plate (aluminum) has the following dimensions: the length is 160 mm, the width is 70 mm, and the height is 12 mm, which has two grooves (the groove spacing is 35 mm and the length is 40 mm) to fix the static-iron by two bolts, and the static-iron can be moved through two grooves for adjusting the air gap to the moving-iron in order to change the electromagnetic attraction force. The air gap of FBG DC sensor in the experimental setup is 3 mm. The cantilever beam is made of beryllium bronze, the bottom width is 16 mm, the height is 71 mm, and the top width is 6 mm. The cantilever beam is fixed between the moving-iron and the plate.

Picture of the FBG DC sensor.
Two FBG sensors (FBG1 and FBG2) are bonded on the opposite surfaces of the cantilever beam with the glue (type: 353ND) (FBG1 is bonded on the left surface of the cantilever beam and is shown in Figure 2, whereas FBG2 is bonded on the right surface of the cantilever beam and is not shown), the distance between the two FBG sensors and the top fixed hole of the cantilever beam is 55 mm. FBG3 and FBG4 temperature sensors (FBG3 is bonded on the left surface of the cantilever beam and is shown in Figure 2, whereas FBG4 is bonded on the right surface of the cantilever beam and is not shown), without stress, are placed near FBG1 and FBG2 in the FBG DC sensor in order to measure and verify the temperature changes. The material of the moving-iron and the static-iron is pure iron DT4C, iron impurities are shown in Table 1, the thickness of the moving-iron is 10 mm, the thickness of the static-iron is 20 mm, and the diameter of the moving-iron and the static-iron is 60 mm. The static-iron is fixed on the plate by a holder of the static-iron bottom; the moving-iron is fixed on the top of the cantilever beam with one hole (the diameter is 3.5 mm).
Impurities in DT4C.

In order to compare the characteristics of FBG DC sensors, two electrical resistance strain gauge sensors (BX120-3AA,
A grounded iron metal shield is used to reduce electromagnetic interference for the electrical strain gauges. In the final application, this can be removed due to the immunity to electromagnetic interference of the optical sensors.
Experimental setup
To demonstrate the principle of the FBG current sensor that can detect DC in the environment of strong electromagnetic interference, a FBG DC experimental system (see Figure 3) is tested. The main instruments and equipment in the experimental system are as follows: DC power: SWL-500A/8V, 0–500 A (www.whslcdq.com); DC comparator: ZLB-1A (www.whslcdq.com); voltmeter: 34401A (www.agilent.com); FBG demodulation: SM130 (www.micronoptics.com); data acquisition device: USB-6251 (www.ni.com); strain meter: DH5935N (www.dhtest.com); and Gauss meter: HT20.

Experimental setup for FBG DC sensing.
The FBG DC sensor design is based on electromagnetic force; thus, we need to monitor changes of the magnetic field in the experiments. However, (1) the space near the moving-iron and the static-iron of the FBG current sensor is too small to locate the Gauss meter probe; (2) based on electromagnetic theory, the magnetic field in the solenoid is proportional to the magnetic field of the wire, so the magnetic field of the current conductor wire is measured with a HT20 Gauss meter. The voltage drop across the solenoid is measured using the data acquisition device (sample rate: 1 kHz) to determine the actual current flow between two metal contacts of the wire. The related experimental equipment is grounded by a shielded wire.
The FBG DC sensor is connected to a DC power supply. The output of the four FBG sensors in the DC sensor is measured using the FBG demodulator (scan frequency: 1 kHz). The output of the electrical resistance strain gauge sensors is measured using the strain meter (sample rate: 1 kHz). The Gauss meter is used to detect the magnetic field near the wire. The FBG demodulation device, data acquisition device, and strain meter are connected to the computer through their respective communication interfaces. The relevant software are installed and configured in the two computers to control data acquisition, perform data analysis, and store the acquired data for these devices. The output of the DC power can be continuously adjusted from 0 to 500 A by manual operation with an adjustable resistance. The operating current is manually set in 20-A increments from 0 to 500 A, then the current is decreased in 20-A steps from 500 to 0 A, and this is repeated once. At each step point, the current is held constant for 30 s.
Results and discussion
The original acquisition voltage drop across the solenoid is shown in Figure 4(a). The original acquisition voltage is small due to the small resistance of the solenoid coil and is susceptible to noise from electromagnetic interference, and this can be clearly seen in Figure 4(a). A median filter (101 voltage data points are averaged to produce a new voltage data point) is applied to the original acquisition voltage to reduce the noise; the filtered voltage is shown in Figure 4(b). The steps visible in the filtered voltage correspond to a change in the applied current of 20 A. The observed jitter from one step to another step is due to the manual adjustment of the DC. We can observe small drifts in the DC during measurement interval. In order to analyze the characteristics of the DC, the frequency spectrum is calculated using the fast Fourier transform (FFT) of the original acquisition voltage (Figure 4(a)) and is shown in Figure 4(c). The frequency spectrum of the DC clearly shows a signal at 10 Hz and harmonics of 50 Hz. This indicates that the measured voltage using the data acquisition device is vulnerable to electromagnetic interference. The average step voltage from the filtered data (Figure 4(b)) is shown in Figure 4(d). A linear fit was made to the data, and the line of best fit is given by V = 0.1846 I − 0.0486 (R 2 = 0.9999), 24 where V is the voltage drop across the solenoid and I is the DC. The voltage is 92 mV when the DC is 500 A. Also, the magnetic field measured using the Gauss meter adjacent to the solenoid wire is shown in Figure 4(d), and the line of best fit is B = 0.0109 I − 0.0258 (R 2 = 0.9997), where B is the magnetic field.
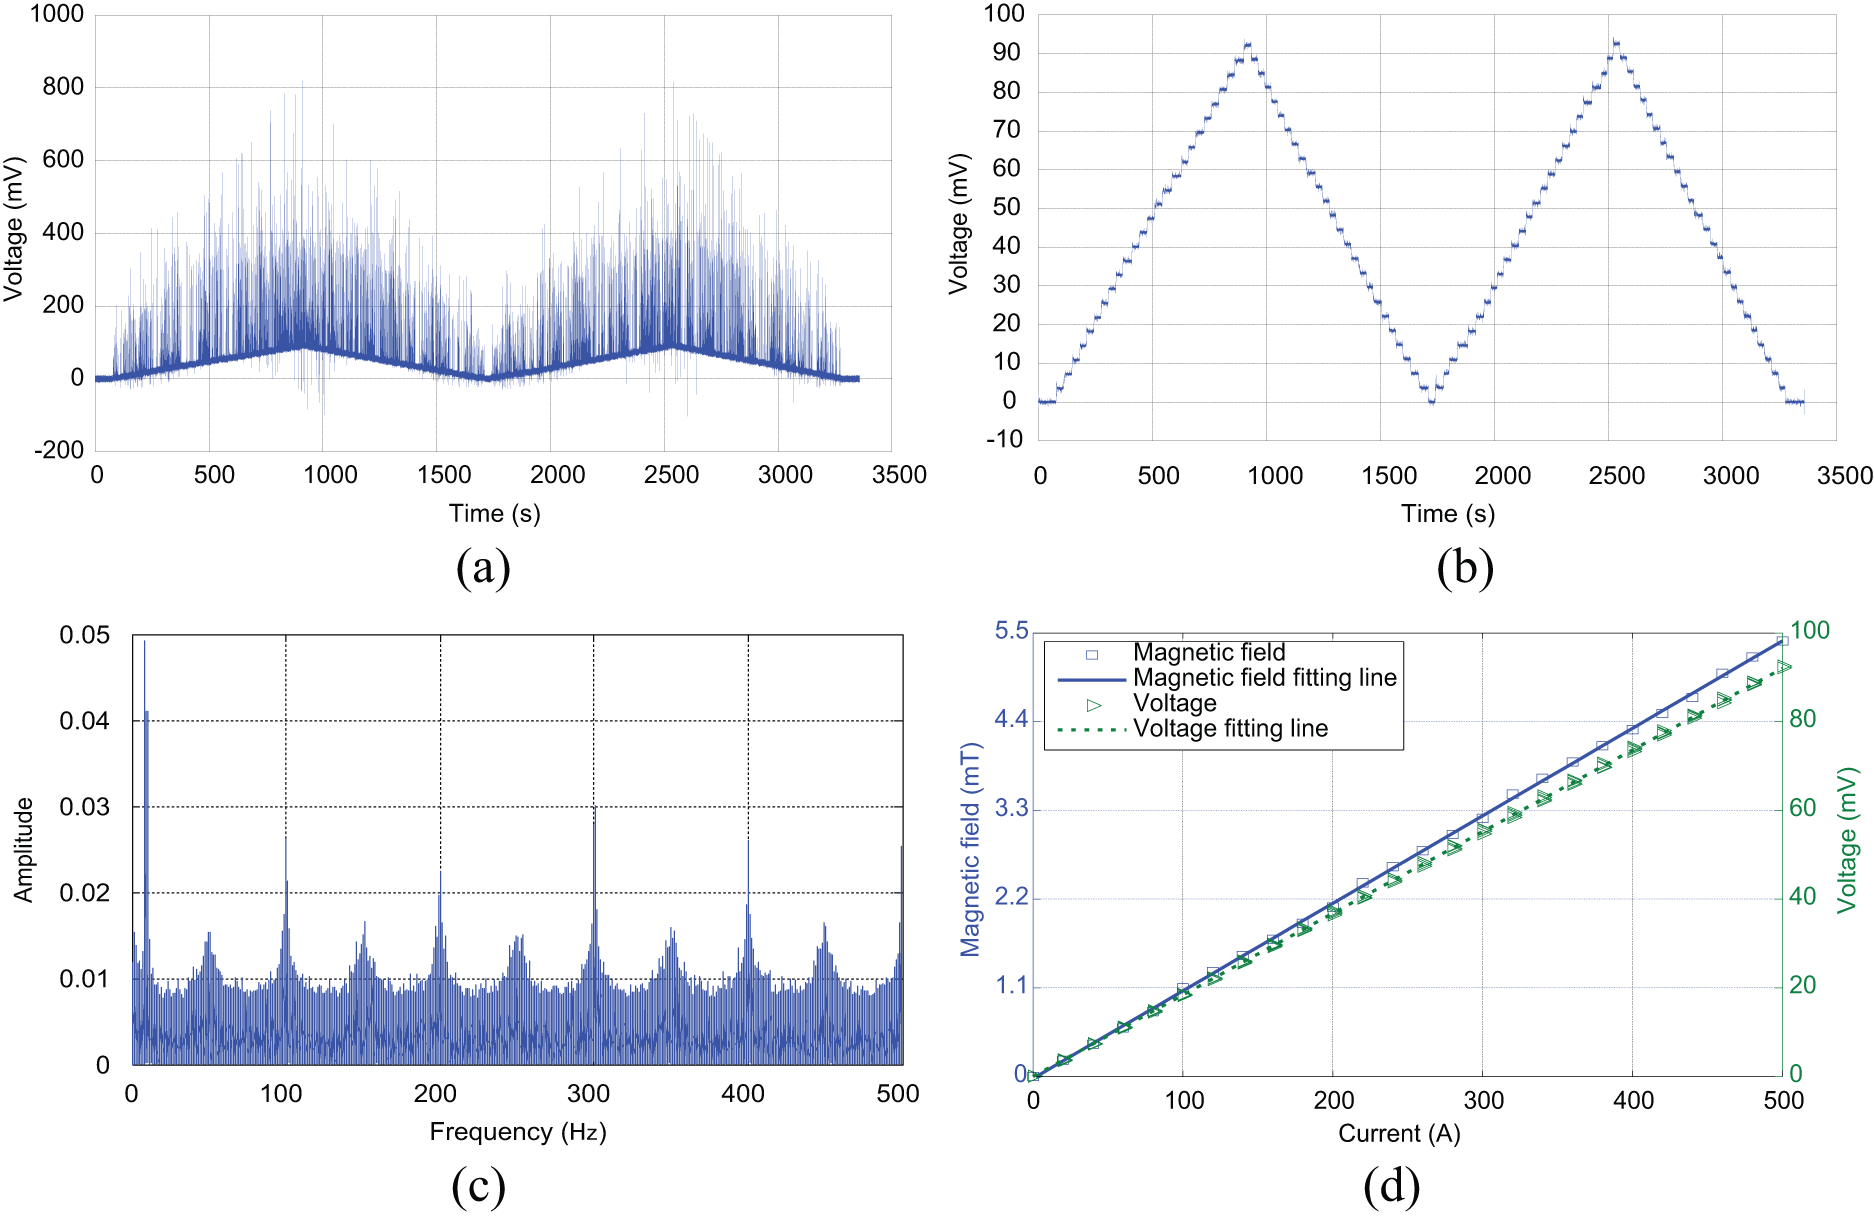
Acquisition voltage and magnetic field of the solenoid: (a) original acquisition voltage, (b) acquisition voltage using a median filter, (c) frequency spectrum using the FFT algorithm, and (d) step voltage average and step magnetic field data.
For each current set point, the Bragg wavelength of the FBG sensors mounted on opposite sides of the cantilever beam is measured and plotted in Figure 5 as the current is repeatedly cycled from 0 to 500 A. The Bragg wavelength shift of the sensor labeled FBG1 is opposite to the Bragg wavelength shift of the sensor labeled FBG2 because one sensor is under tensile stress and the other sensor is under compressive stress; this is consistent with the theoretical analysis in section “Operating principle and design.” The wavelength difference between them is calculated, and the change in wavelength difference relative to the first measurement point is also shown in Figure 5. The wavelength difference changes (FBG1 − FBG2) show repeatable in DC power continuously adjusted (0–500–0–500–0 A, steps 20 A). Small variations in the DC directly produce vibrations in the cantilever beam due to the attractive electromagnetic force; thus, jitter is observed in the Bragg wavelength of each FBG sensor during each current step. The results show a 382-pm Bragg wavelength shift difference between FBG1 and FBG2 when the current is 500 A.

Bragg wavelength shift of FBG1 and FBG2 sensors.
The Bragg wavelength shift of FBG3 and FBG4 which are used only to measure and verify the temperature changes is shown in Figure 6. The Bragg wavelength shift of FBG3 and FBG4 has random drifts due to the systematic error of FBG DC experimental system, which has overlapped with each other because FBG4 temperature sensor has a higher temperature sensitivity than FBG3 temperature sensor, and the main cause of this is the Joule heating in the sole. This explains why the wavelengths of the sensors FBG1 and FBG2 do not return to their starting value when the DC is 0 A after the experiment is completed. However, the Bragg wavelength difference between FBG1 with FBG2 does return to its starting value when the DC is 0 A after the experiment is completed as shown in Figure 5. This result demonstrates that the FBG DC sensor has temperature compensation compared to previous current sensor structures,17,18 and it is also consistent with the principles in equation (4). FBG3 and FBG4 temperature sensors will be removed in the future application of the FBG DC sensor.

Bragg wavelength shift of FBG3 and FBG4 sensors.
The strain signal difference of the two electrical resistance strain gauge sensors is shown in Figure 7. The strain signal does return to zero when the DC is 0 A after the experiment is completed because the two electrical resistance strain gauge sensors are configured using the differential half bridge circuit with intrinsic temperature compensation. Each 20-A current step can be observed and has a similar Bragg wavelength shift difference between FBG1 and FBG2, as shown in Figure 5. The measured strain is repeatable as the DC is continuously adjusted (0–500–0–500–0 A, in 20-A steps). This confirms the measured result of the FBG DC sensor with temperature compensation.

Strain signal of the electrical resistance strain gauge sensors.
The average of the Bragg wavelength difference (FBG1 − FBG2, in Figure 5) is plotted against DC for each current step and is shown in Figure 8. The measured response is processed by the method of least squares
24
(

Quadratic fits to the experimental data using the method of least squares about the average of the Bragg wavelength difference and the average of the strain signal for each current step.
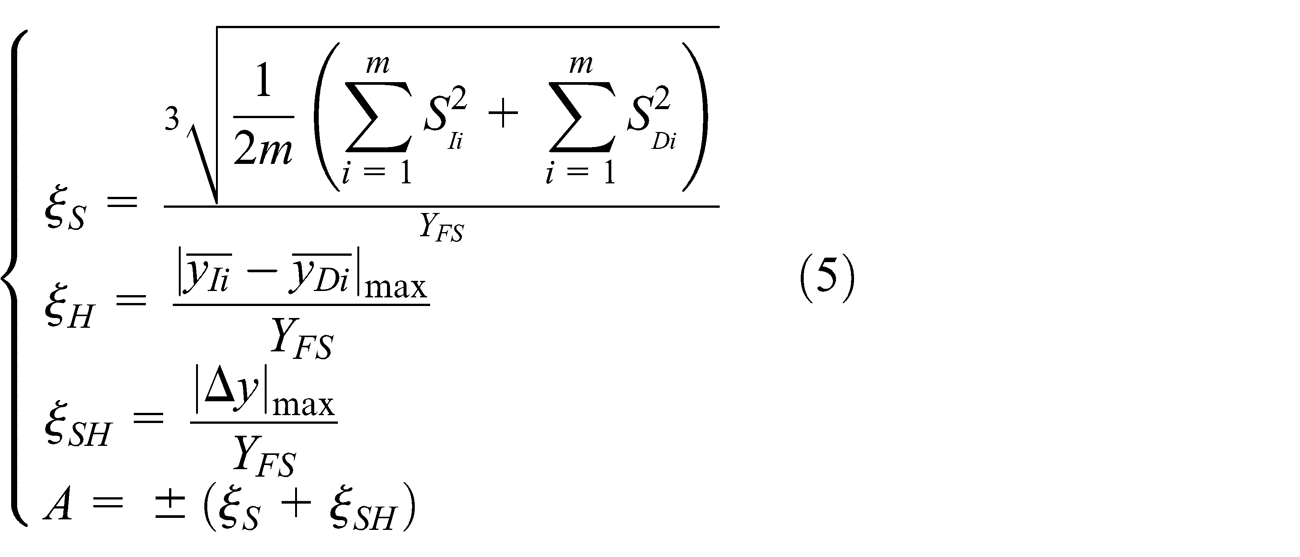
The quality of measurements that reflects the closeness of the results of measurements of the same quantity performed under the same conditions is called the repeatability of measurements. Repeatability error (
Error analysis.

FBG: fiber Bragg grating.
where m is the test number of the upscale test and the downscale test,
The cantilever beam has hysteresis effect, and the iron (DT4C) material exhibits a hysteresis effect (because the relationship between the magnetic induction intensity and the magnetic field intensity is a closed hysteresis line; the magnetic induction intensity in the moving-iron and the static-iron is different between the increasing current and decreasing current with the same current value. When the current decreases, the excitation magnetic field decreases, but the material magnetization lags behind the magnetic field change, which causes the magnetic force to be larger than the positive direction) in the moving-iron and the static-iron, which produces the greater hysteresis error. Because the 353ND glue layer bonded of two FBG (FBG1 and FBG2) sensors on the opposite surfaces of the cantilever beam is thicker than the 502 glue layer bonded of two electrical resistance strain gauge sensors on the opposite surfaces of the cantilever beam, the strain at the position where the two FBG sensors have more hysteresis activity than the strain at the position where two electrical resistance strain gauge sensors, the hysteresis error of FBG sensor is greater than the electrical resistance strain gauge sensor. The same glue and the same layer bonded will be used in the future application to reduce the hysteresis error of FBG DC sensor. The repeatability error on the experimental results of the FBG sensor and electrical resistance strain gauge sensor is smaller than the hysteresis error, the systematic error, and the intrinsic error, which show that FBG DC sensor has well repeatability. The greater hysteresis error will result in the greater difference value between the measured signal point and the compromise signal point of the fitted curve in the DC upscale process error. Thus, the systematic error and the intrinsic error have greater values. The material hysteresis effect in the moving-iron and the static-iron can be reduced by choosing a low-hysteresis material, such as silicon steel and permalloy; thus, the hysteresis error will be reduced.
A frequency analysis of the optical FBG sensors and the electrical strain gauge sensor has also been performed, and the frequency spectra have been analyzed using the FFT algorithm and are shown in Figure 9. The amplitude of about 50 Hz harmonic frequencies of the optical FBG sensors has decreased in comparison to the DC measurement (in Figure 4(c)). The FFT of the FBG signals shows no noise at 50 Hz or higher harmonics. The amplitude of about 50 Hz harmonic frequencies of the electrical strain gauge response has increased in comparison to the DC measurement (in Figure 4(c)). This indicates the effect of electromagnetic interference on the electrical resistance strain gauge sensors and also demonstrates that the FBG sensors have strong electromagnetic interference immunity. Therefore, the FBG DC sensor can be used in current measurement applications in environments with strong electromagnetic interference. The comprehensive evaluation indicates that the FBG sensor is better compared to the electrical resistance strain gauge sensor in electromagnetic interference environments for measurement of DC.

Frequency spectrum of FBG1, FBG2, and the electrical strain gauge sensor using the FFT algorithm.
The moving-iron and the static-iron are magnetized by the uniform magnetic field in the solenoid (from Figure 1). The electromagnetic attraction force between the moving-iron and the static-iron is equal and can be changed by adjusting the air gap between the moving-iron and the static-iron; this allows the same FBG DC sensing structure to be used to measure different current ranges. The induced magnetic field of the solenoid acts like a shield which can prevent the influence of external electromagnetic interference, and this is advantageous compared to previous work. 19
In order to further improve the temperature stability of FBG DC sensor in a wider temperature range, (1) the moving-iron, the static-iron, and the cantilever beam will be processed by the high- and low-temperature aging treatments; (2) the cantilever beam will be made by the minimal temperature coefficient of materials.
Conclusion
A novel FBG DC sensor, based on the deflection of a cantilever beam due to the electromagnetic force between a static-iron and a moving-iron attached to the free end of the cantilever which is enclosed within a solenoid, has been demonstrated from 0 to 500 A. A differential measurement method was used in the design of the FBG DC sensor with temperature compensation. The 382-pm Bragg wavelength shift difference was observed in response to a current of 500 A. The induced magnetic field of the solenoid acts like a shield which can prevent the influence of external electromagnetic interference. The comprehensive evaluation indicates that the FBG sensor has excellent performance compared to the electrical resistance strain gauge sensor operating in the electromagnetic interference environment for the measurement of current. The physical parameters of the FBG DC sensor can be modified accordingly to match the current measurement range and the required current sensitivity. The advantages of this work include intrinsic temperature compensation, and because the FBG sensor encodes the measured as a change in wavelength, the proposed sensor is less sensitive to intensity variations in the optical fiber and allows the long-distance transmission of the optical signal. The reported methodology and practical design can potentially be used in the future to multiplex current sensor networks in the power industry, where immunity to electromagnetic interference is a critical requirement.
Footnotes
Acknowledgements
The authors are grateful to Dr Gordon Flockhart and Prof. Deepak Uttamchandani in the Centre for Microsystems and Photonics, Department of Electronic & Electrical Engineering, University of Strathclyde, Glasgow, United Kingdom, for their enthusiastic support for our work.
Academic Editor: Chow-Shing Shin
Declaration of conflicting interests
The authors declare that there is no conflict of interest.
Funding
This work was supported by the Fundamental Research Funds for the Central Universities (no. CCNU13A05041) and partly supported by China Scholarship Council (no. 201206775083). This work was also supported by the Project of National Science Foundation of China (no. 61377091).