
Abstract
Investigating the stress intensity factors has a great importance to predict the fatigue damage for the involute spur gears. The aim of this article is to reveal the variation laws of stress intensity factors for crack on the involute spur gear tooth. For this purpose, a three-dimensional finite element model for calculating the stress intensity factors of the involute spur gear containing a surface crack is established using the finite element code ABAQUS. Based on the established three-dimensional finite element model, the influences of several parameters, such as torque, friction coefficient, crack depth, crack initial location, and crack size, on mode I, mode II, and mode III stress intensity factors are investigated numerically. The results of the study provide valuable guidelines for enhanced understanding of stress intensity factors for the crack on the involute spur gear tooth.
Introduction
Involute spur gear is one of the most common types of gears, which has been widely used in automobile, aerospace, chemical, and many other fields. However, the long working times and severe working environment in the process of operation can result in gear damages including wear, surface fatigue, plastic deformation, tooth breakage, and so on.1–7 Among them, fatigue failure caused by material defect is one of the main gear damages. The material defects produce cracks, which decrease the actual strength of the gear and induce the cracks growth in the gear tooth. Therefore, it is of great importance to investigate the stress intensity factors (SIFs) for the crack to predict the fatigue damage for the involute spur gears.
Gu and Wu 8 predicted the SIFs for surface cracks in plates of finite width and thickness using the new empirical formulas. Dong et al. 9 established the extended finite element (FE) method to directly assess SIFs. Beretta et al. 10 analyzed the crack propagation mechanisms in welded rails. Liu et al. 11 established a three-dimensional (3D) elasto-plastic FE model to calculate the SIFs of wheels and investigated the influences of wheel diameter, vertical loading amplitude, initial crack size, location, and orientation on SIF ranges. Fletcher et al. 12 established a 3D rail model with an inclined surface crack and investigated the influences of the surface Coulomb friction, the crack inclination, and the crack depth on crack growth rates. Deng et al.13–15 analyzed the influences of radial load, surface traction, raceway groove curvature radius, and the distribution of cracks on crack growth rates and crack growth angles in a bearing ring using an elliptical hole to simulate crack.
In summary, these studies on SIFs and crack propagation mainly take plate, wheel/rail, and bearing as the research object. While it is also very meaningful to research the SIFs of gear.
Wu et al. 16 established a two-dimensional (2D) crack propagation model of spur gear and discussed the influences of tooth crack on the vibration response of a gearbox with spur gears. Dong et al. 17 established a 3D model of gear with an elliptical crack in tooth root and discussed the influences of load, crack length, modulus, tooth number, modification coefficient, and crack angle on SIFs in crack tip. Lin et al. 18 established a 3D FE model of cylindrical gear including a crack in tooth root and investigated the variation law of the crack propagation life with change in load magnitude, crack size, crack location, and crack orientation.
In summary, these studies mainly adopted 2D or 3D graphic to simulate the initial crack to study SIFs and fatigue crack propagation of gear. However, the crack in the engineering practice is a 3D entity, so it is necessary to adopt the 3D entity to simulate the crack. While research that adopts a 3D entity to simulate the initial crack in gear is almost blank. The aim of this article is to use 3D elliptical cylinder to simulate the initial crack in gear tooth root and establish the fatigue propagation FE model of involute spur gear to calculate the SIFs of gear. Finally, the influences of several parameters, such as torque, friction coefficient, crack depth, crack initial location, and crack shape, on mode I, mode II, and mode III SIFs are investigated numerically.
SIF calculations
Based on the linear elastic fracture mechanics, the displacement field in the crack tip neighborhood can be calculated. The x-axis exists in the crack plane and points to the crack tip perpendicularly. The y-axis rotates anticlockwise, which is perpendicular to the crack surface, and is perpendicular to the x-axis at the same time. The z-axis is determined by the right-hand rule. u, v, and w represent the displacements along the x-, y-, and z-axis directions in the crack tip, respectively. Therefore, the descriptions of the displacement field are as follows 19

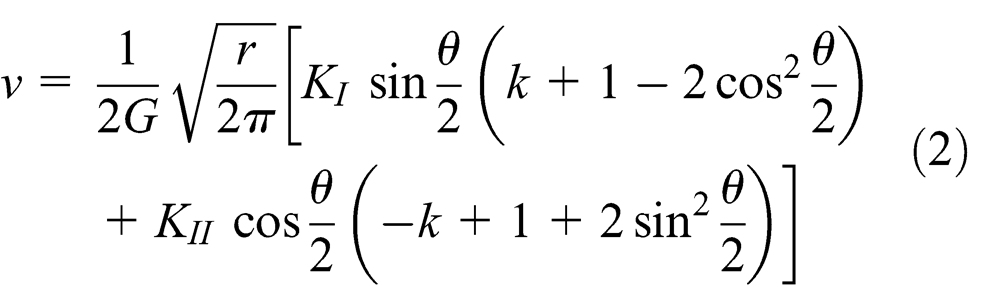

where u, v, and w are the displacements along the x-, y-, and z-axis, respectively; R and θ are the point coordinates in the crack tip; G is the elastic shear modulus; and KI, KII, and KIII represent mode I, mode II, and mode III SIFs, respectively.
For plane strain problem 19

For plane stress problem 19

where µ is the Poisson’s ratio.
According to boundary element method, opening displacement, sliding displacement, and tearing displacement, represented, respectively, by v, u, and w, can be obtained. Then the SIFs are derived as equations (6)–(8) 19


Establishment of FE model
In this article, a pair of involute spur gears is considered as the object and the geometry parameters are shown in Table 1. Geometry model is established in the Pro/E, and then it is imported into ABAQUS through the Pro/E and ABAQUS interfaces. The material is 20 CrMnTi with the properties of Young’s modulus E = 206 GPa and Poisson’s ratio µ = 0.3.
Geometry data of the example involute spur gear pair.

Detailed modeling procedures are as follows:
Defining parts. There are two pairs of tooth gearing in involute spur gears at most. Therefore, only three teeth are necessarily kept in both master and slave pulley to carry on contact analysis in order to save analysis time. The simplified 3D geometrical models are imported into ABAQUS.
Simulating the crack. The surface crack is modeled as an elliptical pore. To conveniently assembly, establish datum plane 1, which is composed by the major size 2a and the thickness 2c of the crack, and datum point 1, the coordinates of which are (0.32, 0, 0.2) and 0.32 is the crack depth, as shown in Figure 1. In the practical engineering, the driving pinion is easy to fail, so the crack just exists in the driving pinion in this article and is located at the middle point in the tooth width direction at the tooth root of the driving pinion. The datum plane 2 is in parallel with the datum plane 1, which composed of four points on the top of the tooth. The elliptical cylinder is moved from the datum point 1 to the datum point 2, where the von Mises stress is the maximum, as shown in Figure 2. Finally, the crack is obtained by the Boolean calculation between the driving pinion and the elliptical cylinder, as shown in Figure 3.
Defining contact and coupling. Generally, the surface having larger curvature is chosen as the master surface. Thus, the tooth surface of the driving pinion is picked as master surface and the tooth surface of the driven gear is defined as slave surface, as shown in Figure 4. Because the boundary conditions cannot be directly exerted to elements of gears in ABAQUS, the shaft hole of the gear is coupled with the control point of axis, as shown in Figure 5.
Defining the crack. The elliptical surface is defined as the crack front. The edge is defined as the crack tip, which is in parallel with z-axis. The direction in parallel with the major size is assumed as the crack extension direction, as shown in Figures 6 and 7.
Defining loads and boundary conditions. The driving pinion is constrained to only rotate around its own axis. While all freedom degrees of the driven gear are constrained. The torque is exerted on the driving pinion.
Meshing. Due to the complex geometry of the involute spur gears, the imported model cannot be meshed directly. To resolve this question, every tooth is partitioned into some regions, as shown in Figure 8. To get accurate results, the mesh around the surface cracks has been refined, as shown in Figure 9. The gears are meshed with eight-node hexahedron element (C3D8R).
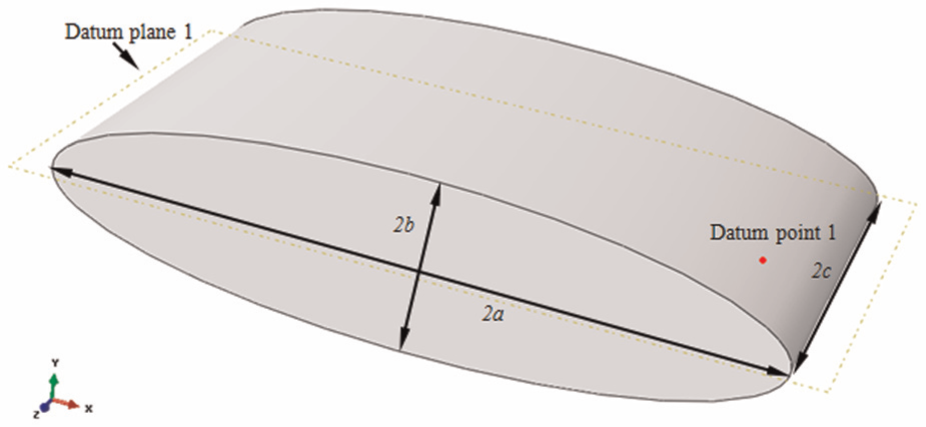
Elliptical crack size.
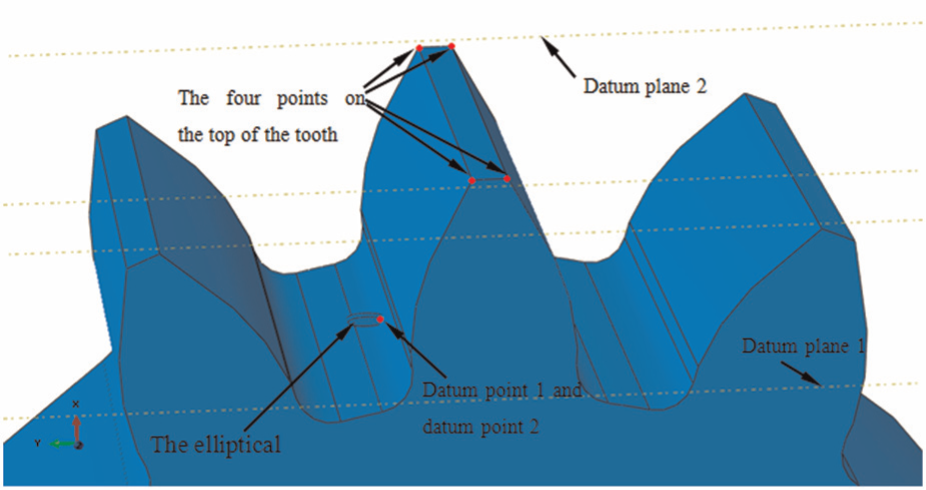
Location of the crack in the tooth root.

Gear with a crack.

Definition of contact pairs.
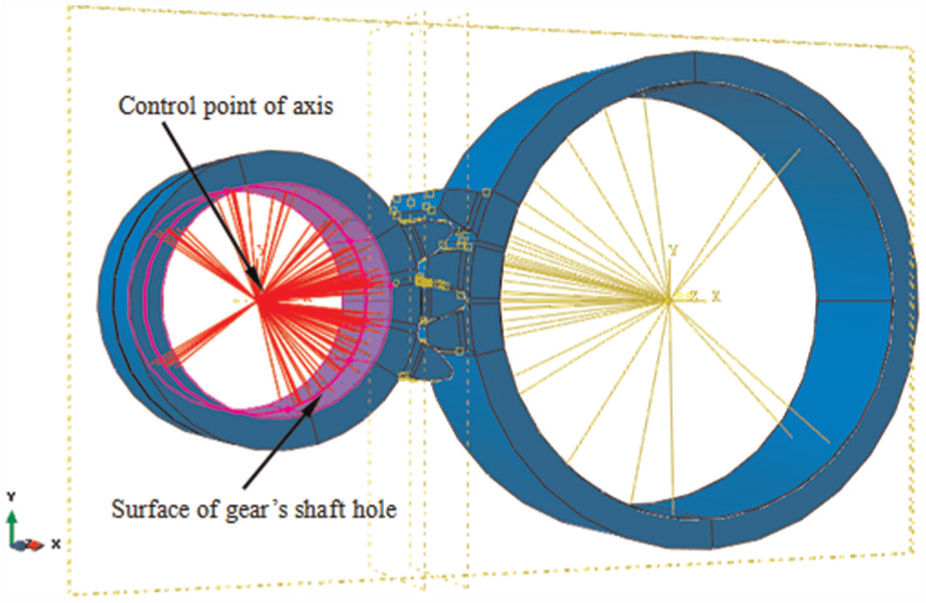
Definition of coupling.
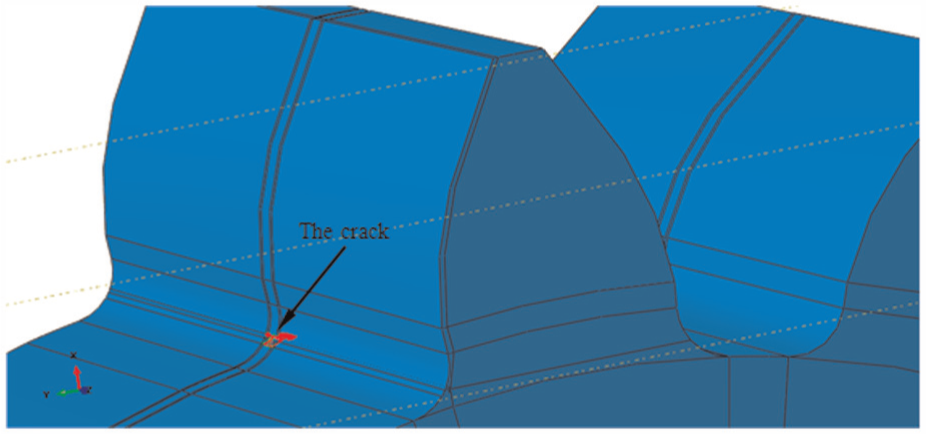
Crack in the gear.

Definition of surface crack.

Gear pair after partition.

Meshing the driving pinion.
Crucial location determination
To investigate the important location, based on the 3D FE model of involute spur gear without cracks, the von mises stress of the driving pinion tooth at the tooth root during a meshing cycle of the driving pinion is analyzed, as shown in Figure 10, in which the abscissa presents the rotation angle of the driving pinion. (In the meshing process, the driving pinion rotates continuously. The rotation angle of the driving pinion means the angle that the driving pinion rotates around its own axis in a certain time.) A whole meshing cycle of the driving pinion is from 0° to 22.5° including double-tooth pair meshing zone (from 0° to 12.15°) and single-tooth pair meshing zone (from 12.15° to 22.5°). The double-tooth pair meshing means that two teeth in every gear mesh at the same time, as shown in Figure 11. The single-tooth pair meshing means that only one tooth in every gear meshes, as shown in Figure 12. From Figure 10, it can be seen that the von mises stress at the driving pinion tooth root in the single pair tooth contact is larger than that in the double-pair tooth contact. When the rotation angle is 22.5°, the von mises stress at the driving pinion tooth root is the largest. The von mises stress is the combination of the stress components, which have influences on crack propagation. Therefore, the driving pinion rotation angle of 22.5° is considered as the crucial location for studying the SIFs.

von mises stress at the tooth root of the driving pinion in a meshing cycle.

Double-tooth pair meshing of the gears.
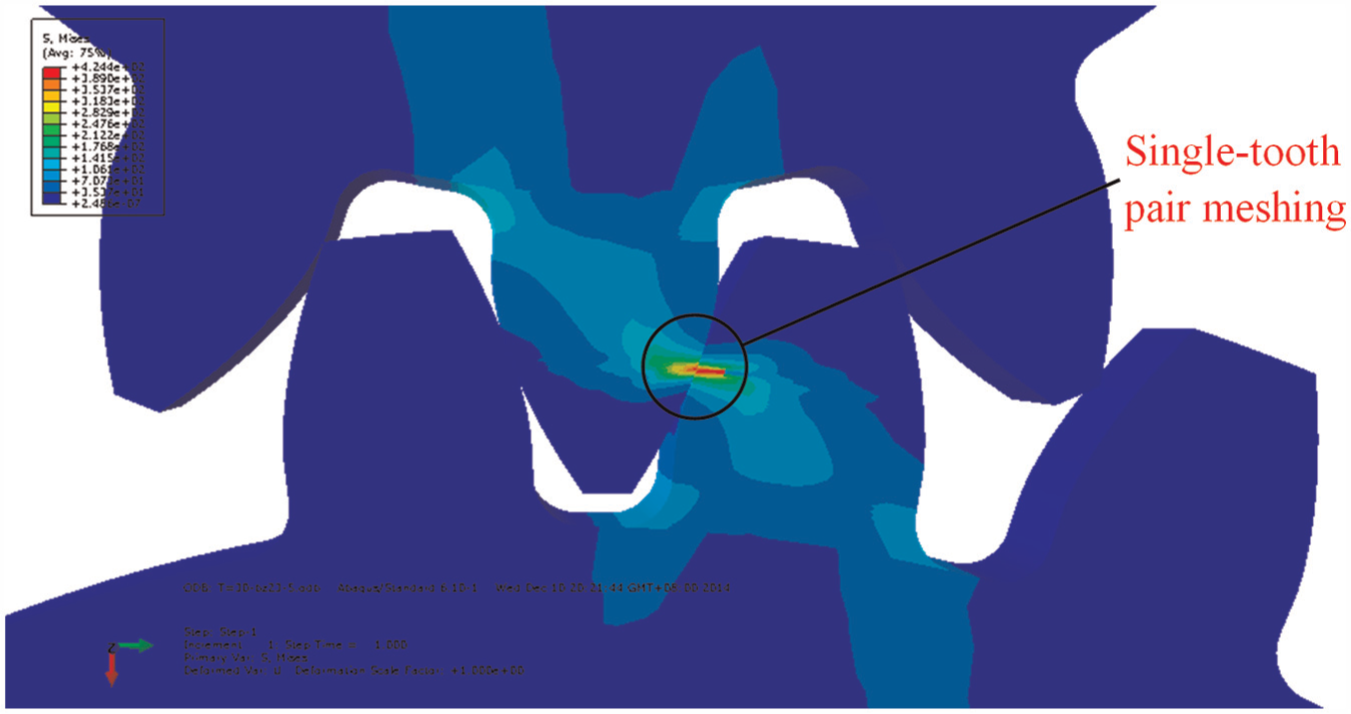
Single-tooth pair meshing of the gears.
Validation of FE model
The SIF is used to validate the FE mode. Lin et al. 18 established a model of cylindrical gear with crack in tooth root and mode I SIF of crack tip calculated in this model is shown in Figure 13. Figure 14 provides the simulated results in this study. From Figures 13 and 14, it can be found that the obtained mode I SIF in this study has the similar variation trend with that presented in Lin et al., 18 although their values are not the same. The difference is attributable to the different load. The above analysis suggests that the FE model in this article is reliable.

Distribution of mode I SIF along crack tip in Lin et al. 18
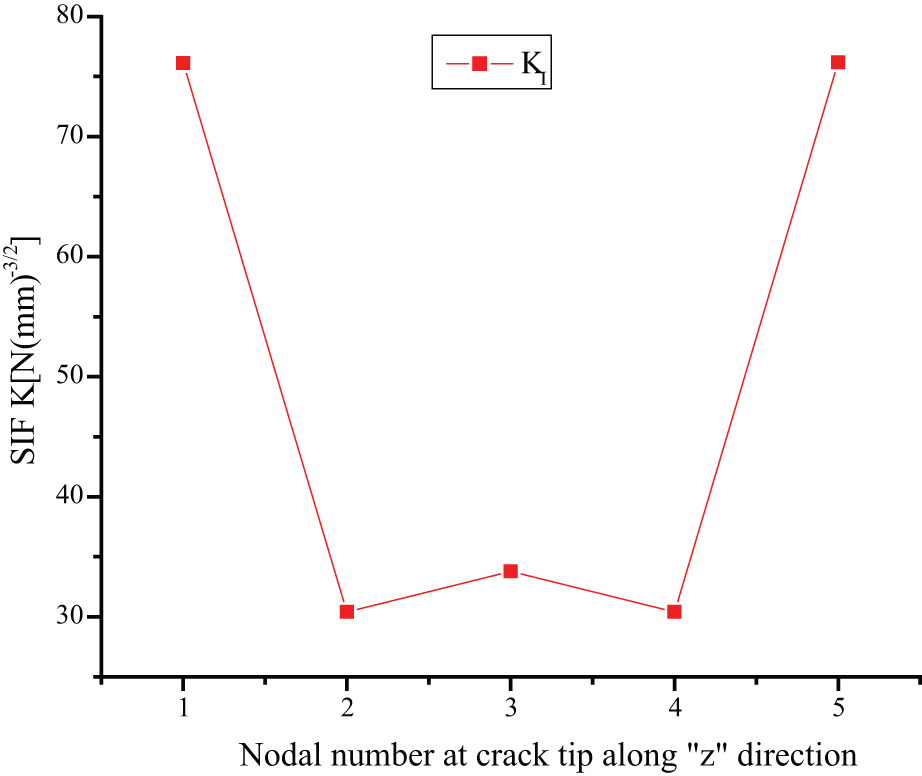
Distribution of mode I SIF along z-direction in this article.
Results and discussion
Based on this 3D FE model, SIFs at the driving pinion tooth root are calculated. Figure 15 presents the variation in SIF along z-direction, and the locations of calculated SIF of crack tip are performed on the horizontal axis. From Figure 15, it can be seen that the distribution of mode I SIF in the crack tip is similarly parabolic. According to equation (6), mode I SIF will become large when the opening displacement at the crack tip becomes large. Therefore, the opening displacements at the endpoints are larger than those at the middle part. The reason for this is that the concentrated stress contributes largely to the opening displacements at the endpoints but less to the opening displacements at the middle part. The distribution of mode II SIF is also similarly parabolic. According to equation (7), mode II SIF will become large when the sliding displacement at the crack tip becomes large. Therefore, the sliding displacements at the endpoints are larger than those at the middle part. The reason for this is that the concentrated stress contributes largely to the sliding displacements at the endpoints but less to the sliding displacements at the middle part. The distribution of mode III SIF is similarly tangent curve. According to equation (8), mode III SIF will become large when the tearing displacement at the crack tip becomes large. Positive or negative symbol represents the direction of tearing displacement. It can be seen that the tearing displacements at the endpoints are reverse, and the tearing displacements at the endpoints are larger than those at the middle part. The reason for this is that the concentrated stress contributes largely to the tearing displacements at the endpoints but less to the tearing displacements at the middle part. It can also been seen from Figure 15 that mode I SIFs are larger than mode II and mode III SIFs, especially at the middle points mode II and mode III SIFs are nearly 0. It indicates that the crack initiation is mainly dominated by the open mode.

Distribution of SIF along z-direction.
Influence of torque on SIF
The influences of the torque on mode I, mode II, and mode III SIFs are shown in Figures 16–18. It can be seen from Figure 16 that with the increase in torque, mode I SIFs at crack tip gradually increase, and the difference of mode I SIFs at endpoints and those at the middle part become larger. Moreover, as the torque increases, opening displacements at the crack tip become large, and the effects of stress concentration on the endpoints are more obvious. In Figure 17, with the increase in torque, mode II SIFs at the endpoints increase gradually and maintain the parabolic distribution, but it is obvious that mode II SIFs in the middle part of crack tip keep nearly 0. Of course, the difference in SIF values between endpoints and the middle part of crack tip becomes larger. The reason is that the increasing torque mainly contributes to sliding displacements at endpoints of the crack tip and less to those in the middle part. From Figure 18, it can be seen that with increasing torque, the value of mode III SIFs at endpoints increases gradually and those in the middle part except middle point increase slightly but that at middle point keeps 0. The increasing torque mainly contributes to tearing displacements at endpoints of the crack tip relative to those in the middle part, especially to that at middle point. Moreover, the increment of mode I SIF is larger than those of mode II and mode III SIFs, which implies that mode I calculation is the most sensitive to torque. Thus, the torque is mainly contributable to opening mode and less contributable to sliding and tearing modes for the crack initiation.

Influence of torque on mode I SIF.

Influence of torque on mode II SIF.

Influence of torque on mode III SIF.
Influence of friction coefficient on SIF
The influence of friction coefficient on mode I, mode II, and mode III SIFs is shown in Figures 19–21. It can be seen from Figure 19 that the values of mode I SIF increase slightly with increasing friction coefficient. However, Figures 20 and 21 show that mode II and mode III SIFs have no obvious increase as friction coefficient increases. It can be found that mode I SIF is the most sensitive to friction coefficient.

Influence of friction coefficient on mode I SIF.

Influence of friction coefficient on mode II SIF.
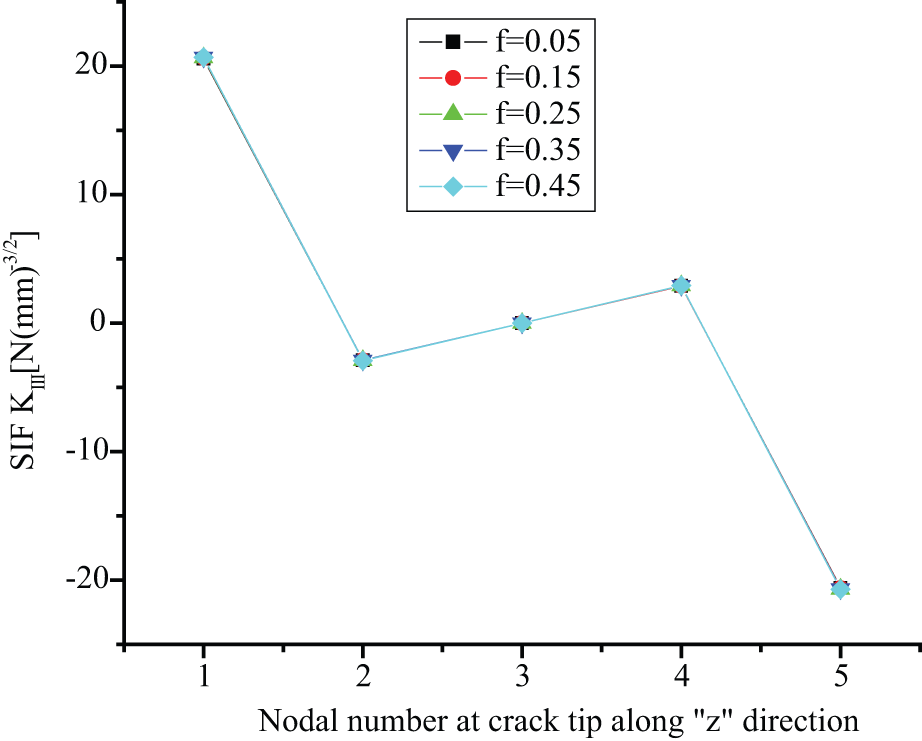
Influence of friction coefficient on mode III SIF.
Influences of crack depth on SIF
The influences of crack depth on mode I, mode II, and mode III SIFs at the crack tip are shown in Figures 22–24. From Figures 22–24, it can be found that first, mode I, mode II, and mode III SIFs have obvious reduction as the crack depth increases, but mode III SIF at crack middle point still keeps 0, which means that there is no tearing displacement at crack middle point. Second, the reduction in the SIF values at crack endpoints is larger than those in crack middle part, especially to mode II and mode III SIFs, which implies that the SIFs at crack endpoints are more sensitive to the crack depth relative to those in crack middle part. Third, the values of mode I SIF are still the maximum relative to those of mode II and mode III SIFs. It indicates that the crack initiation is mainly dominated by the open mode.
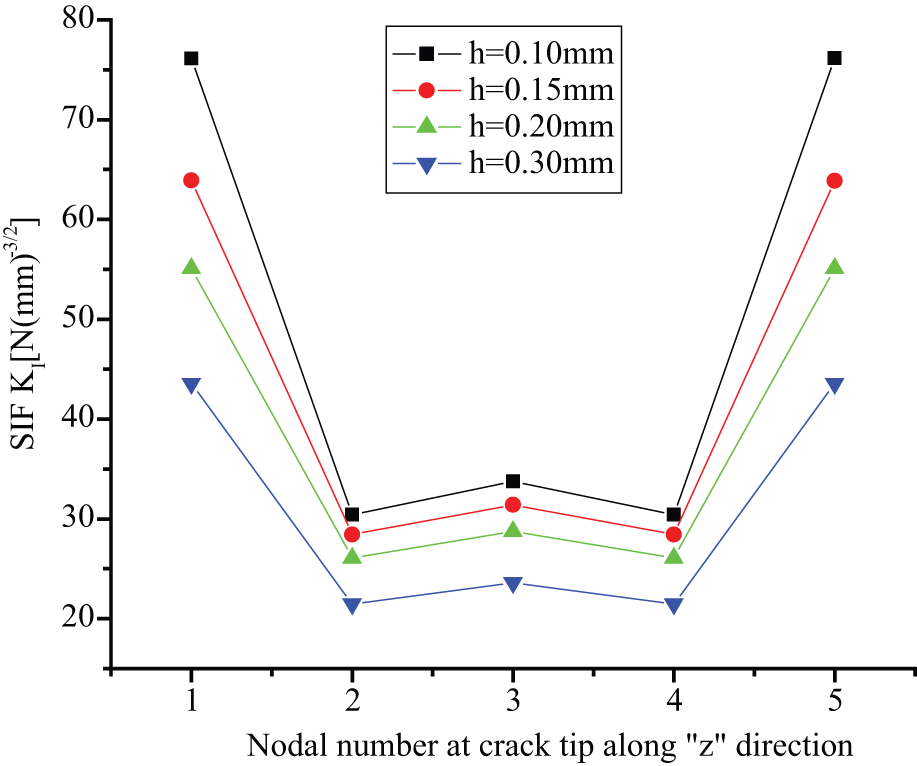
Influence of crack depth on mode I SIF.
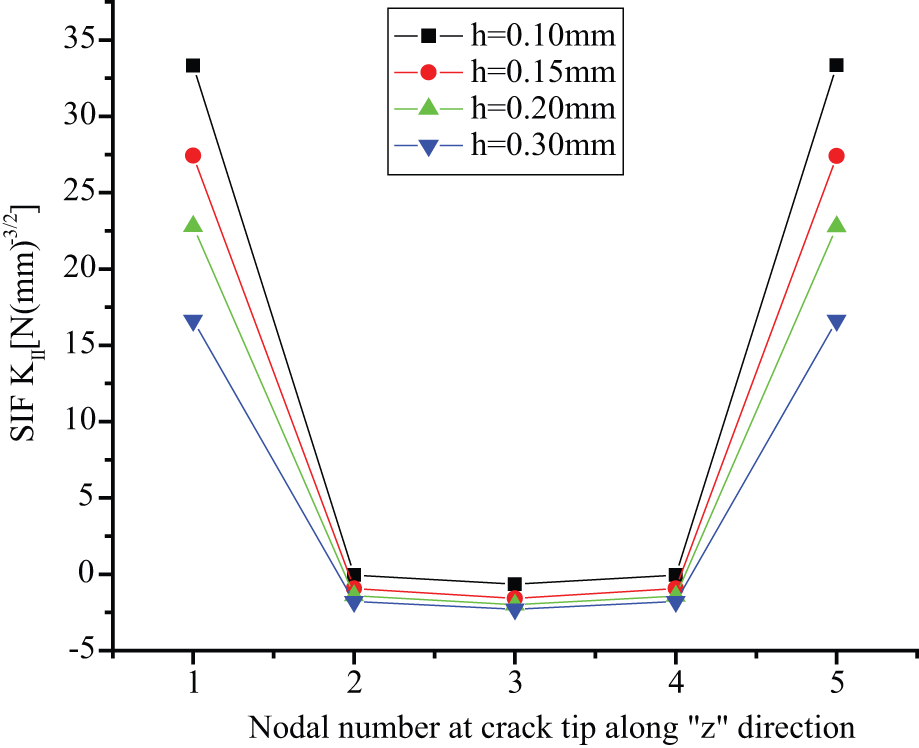
Influence of crack depth on mode II SIF.

Influence of crack depth on mode III SIF.
Influence crack location on SIF
To investigate the influence of crack initial location on SIF at the crack tip, choose the endpoint of tooth width as the reference point and select five different locations of crack (the distances to the reference point are 8, 10, 12, 14, and 16 mm, tagging as 1–5 18 ), as shown in Figure 25. The influence of crack initial location on mode I, mode II, and mode III SIFs at the crack tip is shown in Figures 26–28. It can be seen from Figure 26 that when the crack initial location changes from location 1 to location 4, mode I SIF at point 1 increases first and then reduces. Those at other points have a little change. When the crack initial location is at location 5, mode I SIF reduces sharply. From Figure 27, as the crack initial location changes, mode II SIF at point 1 first reduces and then increases, and finally reduces sharply. Mode II SIF at point 5 first increases and then reduces, and finally increases. Mode II SIFs at other points have little change. Figure 28 shows that as the crack initial location changes from location 1 to location 4, mode III SIF at point 1 first increases and then reduces. Those at other points have a little change. When the crack initial location is location 5, mode III SIFs at point 1 to point 4 are nearly 0 and that at point 5 is less relative to that in other location.

Definition of crack initial location.
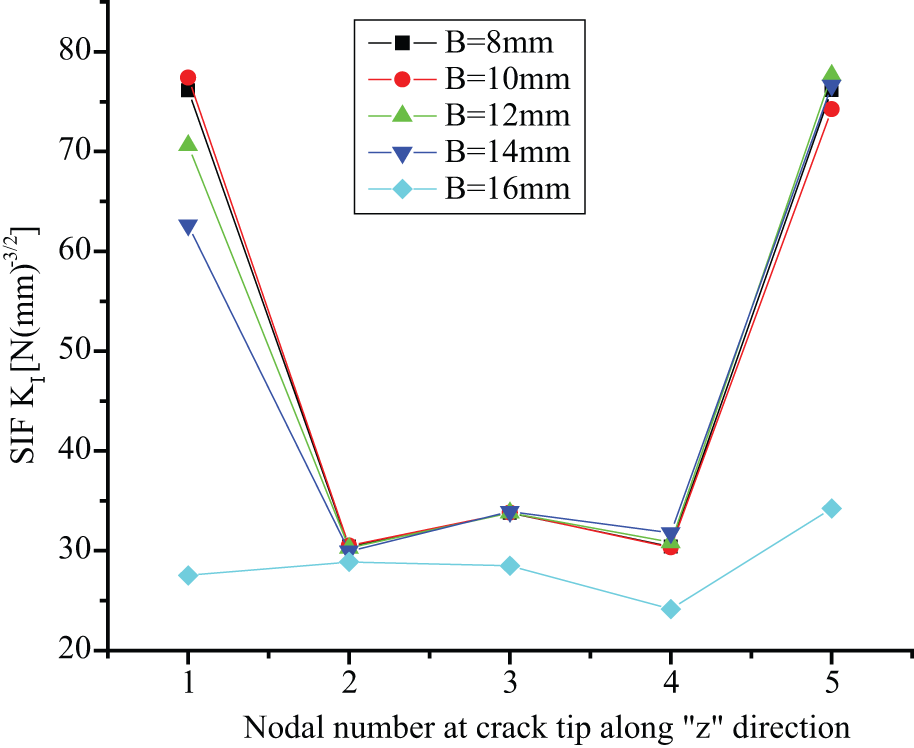
Influence of crack initial location on mode I SIF.

Influence of crack initial location on mode II SIF.

Influence of crack initial location on mode III SIF.
Influence of major size on SIF
The surface crack is modeled as an elliptical pore. The shape of elliptical cylinder is decided by major size 2a, the minor size 2b, and the thickness 2c, as shown in Figure 1. The major size increasing means that the angle between both crack fronts reduces accordingly. The influence of the major size on mode I, mode II, and mode III SIFs at the crack tip is shown in Figures 29–31. It can be seen from Figures 29–31 that mode I, mode II, and mode III SIFs increase as the major size increases, except that mode III SIF at the crack middle point still keeps 0. That is, as the angle between both crack fronts reduces, opening displacement, sliding displacement, and tearing displacement increase accordingly. When the major size increases from 0.4 to 0.6 mm, the increment of SIFs is the largest. Moreover, the values of mode I SIF are still the maximum relative to those of mode II and mode III SIFs. It indicates that the crack initiation is mainly dominated by the open mode.

Influence of major size on mode I SIF.

Influence of major size on mode II SIF.
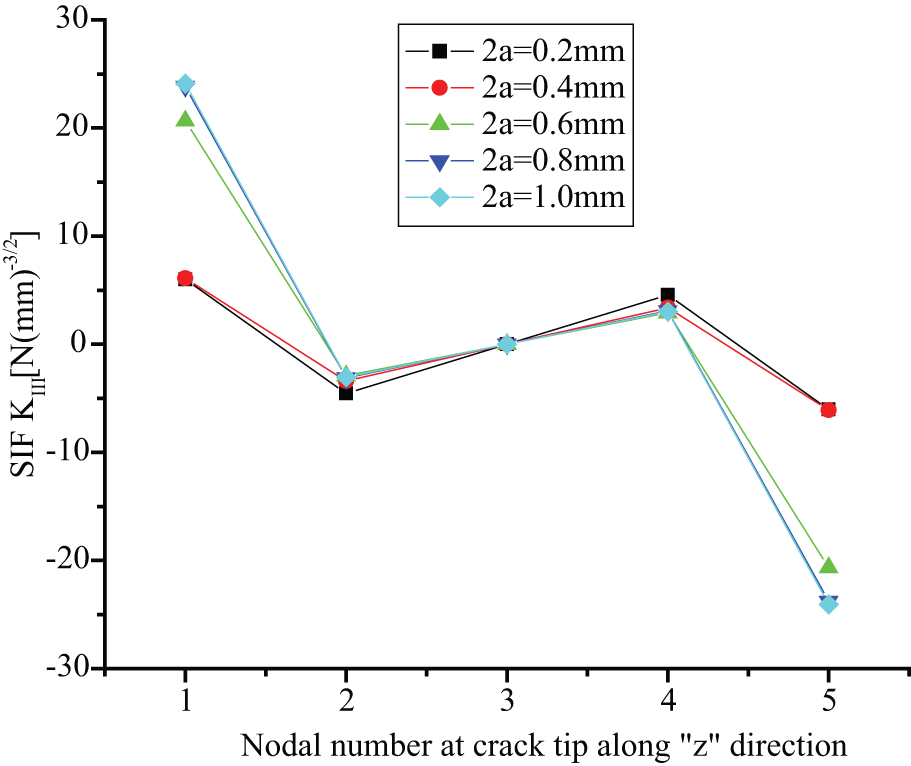
Influence of major size on mode III SIF.
Influence of minor size on SIF
The minor size increasing means that the angle between both crack fronts increases accordingly. The influence of the minor size on mode I, mode II, and mode III SIFs at the crack tip is shown in Figures 32–34. Figure 32 shows that mode I SIFs have obvious reduction as the minor size increases. That is, as the angle between both crack fronts increases, opening displacement has reduction accordingly. Figure 33 shows that first, as the minor size increases from 0.06 to 0.10 mm, mode II SIFs at crack endpoints reduce but those in crack middle part increase. Second, as the minor size increases from 0.10 to 0.20 mm, mode II SIFs have obvious reduction. Third, as the minor size increases from 0.20 to 0.30 mm, mode II SIFs gradually reduce. From Figure 34, it can be seen that as the minor size increases, the value of mode III SIF at the crack middle point still keeps 0, which means that the minor size has no contribution to that at crack middle point. When the minor size increases from 0.06 to 0.10 mm, the values of mode III SIF in crack tip increase except that in the middle point. When the minor size increases from 0.10 to 0.30 mm, the values of mode III SIF in crack tip reduce except that in the middle point. When the minor size increases from 0.20 to 0.24 mm, the reduction in SIFs is the largest. Moreover, the values of mode I SIF are still the maximum relative to those of mode II and mode III SIFs. It indicates that the crack initiation is mainly dominated by the open mode.
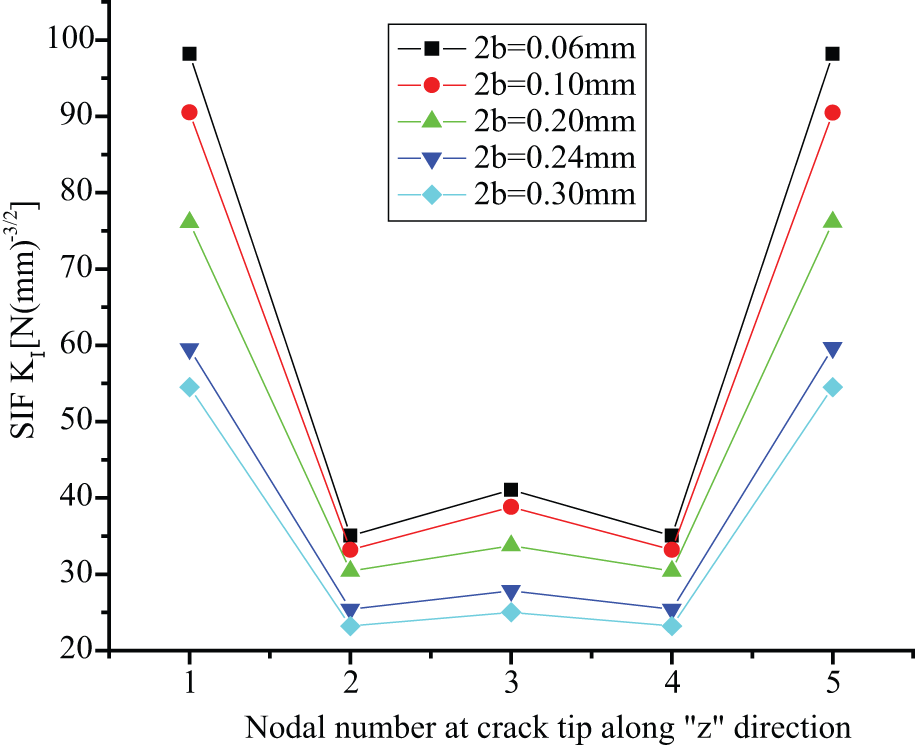
Influence of minor size on mode I SIF.

Influence of minor size on mode II SIF.

Influence of minor size on mode III SIF.
To sum up, the influences of several parameters, such as torque, friction coefficient, crack depth, crack initial location, and crack shape, on mode I, mode II, and mode III SIFs are investigated numerically. The results of the study help to better understand the crack propagation mechanisms on the involute spur gear tooth. Also, the obtained results provide the basis for gear fatigue life prediction and gear fatigue fracture prevention in the practical engineering.
Conclusion
To study mode I, mode II, and III SIFs of involute spur gear, a realistic 3D model of the involute spur gear containing a surface crack is established using the ABAQUS software. The surface crack is modeled as an elliptical pore. Then, based on the model, several parameters, such as torque, friction coefficient, crack depth, crack initial location, and crack shape, are varied to study their effects on mode I, mode II, and mode III SIFs of involute spur gear. The results obtained are presented as follows:
The distributions of mode I and mode II SIFs in the crack tip are similarly parabolic, and the distribution of mode III SIF is similarly tangent curve. The SIF values of mode I are larger than mode II and III SIFs. This suggests that the open mode mainly dominates the crack initiation.
With an increase in the torque, the SIF values of mode I increase. The values of mode II SIF at endpoint increase but those in middle part keep unchanged. The value of mode III SIF at the middle point keeps 0, and those in other points have obvious increment.
Mode I, mode II, and mode III SIFs are not sensitive to the coefficient of friction, basically remaining unchanged when the friction coefficient changes.
As the crack depth increases, the values of SIFs have obvious reduction, except that mode III SIF at crack middle point still keeps 0.
The values of SIFs have a little change as the crack initial location changes, especially when the crack initial location is at the end of gear width the values of SIFs reduce sharply.
Mode I, mode II, and mode III SIFs increase as the major size increases, except that mode III SIF at the crack middle point still keeps 0.
Mode I SIFs have obvious reduction as the minor size increases. Mode II SIFs at crack endpoints reduce as the minor size increases, while those in the middle part increase first and then reduce. The values of mode III SIF at endpoints increase first and then reduce, that in the middle point keeps 0, and those in the middle part except that in the middle point gradually reduce.
Footnotes
Academic Editor: Filippo Berto
Declaration of conflicting interests
The authors declare that there is no conflict of interest.
Funding
The authors would like to thank the Natural Science Foundation of China (No. 51105287), Innovative Research Team Development Program of Ministry of Education of China (No. IRT13087), and High-End Talent Leading Program of Hubei Province (No. 2012-86) for the support given to this research.