
Abstract
This study focused on investigating the influence of longitudinal vibrations, the condensation section temperature, and the inclination angles on the heat transfer performance of grooved cylindrical copper heat pipes with lengths of 600 and 150 mm and an outer diameter of 8 mm. The inclination angles of the tested heat pipes were 0°, ±45°, and ±90°. Longitudinal vibrations with frequencies of 3, 4, 5, 6, and 9 Hz and amplitudes of 2.8, 5, 10, 15, 20, and 25 mm, which resulted in accelerations between 0.1 and 1.01 g, were experimentally tested. The condensation section temperatures were set at 20°C, 30°C, and 40°C. A heating jacket and a cooling sleeve were installed at the evaporation and condensation sections of the test cell to simulate a constant heat flux and a constant temperature boundary, respectively. The results showed that with the heat pipe placed with the condensation section on top and the evaporation section on bottom, a fairly low and constant thermal resistance (approximately 0.25 K/W for the 600-mm heat pipe and 0.75–1.2 K/W for the 150-mm heat pipe) was obtained, both with and without heat pipe vibration and regardless of the condensation section temperature.
Introduction
Heat pipes are superior passive heat dissipation devices. When the evaporation section of a heat pipe is heated, the thermal energy will vaporize the working fluid around the pipe wall and increase the vapor pressure, which enables the working fluid to flow to the condensation section via vapor flow. The vapor at the condensation end then releases the latent heat as it condenses into a liquid, which, through the wick structure, backflows to the evaporation section via capillary action and completes the cycle. In this cycle, no external driving force is required, but because the latent heat of the phase change results in heat transmission, a large amount of heat can be transmitted quickly. Currently, heat pipes have been applied for the dissipation of heat produced by various electric appliances, including central processing units (CPUs), light-emitting diode (LED) lamps, solar cell applications, and so on. The study of heat pipes is primarily focused on varying the internal capillary structure to enhance heat transfer and on the thermal characteristics of flat and loop heat pipes. Comprehensive studies on applications and the performance of heat pipes and the effects of various parameters can be found in the literature.1–8
There has been very little research concerning the effects of vibration on heat pipes. Huber and Bowman 9 used a bench-top shaker to cause vibrations in the longitudinal axis of a wrapped screen wick heat pipe and measured the capillary limit at vibrational frequencies of 10, 30, and 50 Hz. At each of these frequencies, tests were run at vibrational amplitudes of 0.2 and 2.0 g. It was shown that longitudinal vibrations caused a decrease in the capillary limit of a wrapped screen wick copper water heat pipe. The decrease was more noticeable at specific vibrational amplitudes and frequencies. Huber and Bowman’s study suggested that heat pipes of other designs should be experimentally investigated. In particular, axially grooved wick heat pipes should be investigated because they do not contain the screen, which could change the effects of vibrations on the system. In 2012, Alaei et al. 10 presented the effects of low-frequency vibrations (0, 10, 20, and 30 Hz with constant mechanical vibration amplitude of 2 mm) in a horizontal heat pipe and showed that the low-frequency vibrations impose a significant effect on the thermal performance as the best performance was achieved with the thermal resistance 0.05 K/W in the frequency 25 Hz. In 2013, Alaei et al. 11 again investigated the effects of low-frequency vibrations (0, 10, 20, and 30 Hz with constant mechanical vibration amplitude of 2 mm) in a vertical heat pipe. The thermal resistance was investigated under different heat transfer rates, filling ratios, and frequencies. The results indicated that the best performance was obtained with the thermal resistance 0.064 K/W in the frequency 30 Hz.
Chen et al. 12 investigated the influence of horizontal longitudinal vibrations and the condensation section temperature on the heat transfer performance of a grooved cylindrical copper heat pipe. Longitudinal vibrations with frequencies of 3, 4, 5, 6, and 9 Hz and amplitudes of 2.8, 5, 10, 15, 20, and 25 mm, which would give accelerations in the range of 0.1–1.01 g, were experimentally tested. It was shown that when the heat pipe started to vibrate horizontally in the longitudinal direction, this vibration caused an increase in the heat transfer of the heat pipe that was directly proportional to the input vibration energy below 500 mm2 Hz2. When the value of the vibration energy exceeded this value, the heat transfer enhancement per unit vibration energy decreased rapidly. Along with the decrease in the condensation section temperature, the average temperature of the heating section decreases. The influence of the condensation section temperature on the maximum heat transfer is much greater than that of the vibrations.
Within this context, the objective of this study, which is a follow-up to the work by Chen et al., 12 is to investigate how longitudinal vibrations and the condensation section temperatures affect the thermal performance of heat pipes with different inclined angles.
Research methods
Experimental test cell
The designed experimental test cell can be divided into the heat pipe and the heating, cooling, vibrating actuation, and data retrieval systems, with the integrated equipment shown in Figure 1. A photograph of the integrated equipment and an illustration of the experimental test cell are shown in Figures 2 and 3, respectively.

Integrated experimental equipment. 12

A photograph of the experimental equipment. 12
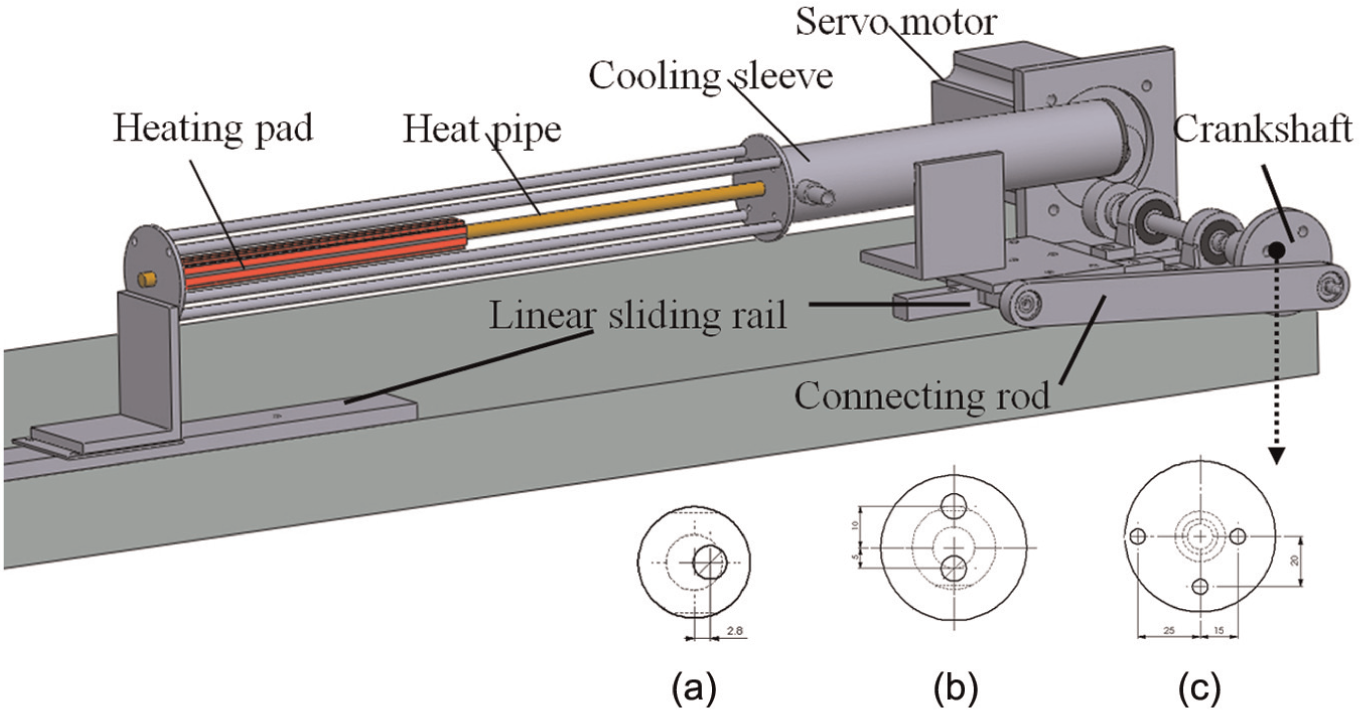
Experimental test cell illustration. 12 Crank endplate design versus desired vibrational amplitude (r): (a) r = 2.8 mm, (b) r = 5, 10 mm, and (c) r = 15, 20, 25 mm.
Heat pipe
The heat pipes under study were 600-mm-long and 150-mm-long grooved cylindrical pipes with an outside diameter of 8 mm. The material of the grooved heat pipe is copper. A total of 68 grooves, each with 200 µm width and 250 µm depth, were evenly shaped on the circumference of the heat pipe with a vacuum range of 10−1 torr. Distilled water was used as the working fluid.
Heating system
One-third of the total length of the heat pipe at one end was the evaporation section, which was equipped with a copper block, a heating pad, thermal paste, and insulation materials, as described below.
1. Copper block
The heat pipe used in the experiment was a cylindrical tube. To evenly heat the evaporation section, a 12 mm (W) × 12 mm (H) × 190 mm (L) rectangular copper block with an inside hole diameter of 8 mm was used. Ten thermocouples were placed on the heat pipe, with five each on the upper and lower parts; thus, there were five holes in each part of the copper block to allow the thermocouples to pass through the block and contact the heat pipe directly. In addition, to enable contact between the heating pad and the copper block, there was a 1-mm-wide and 0.5-mm-deep groove in which the thermocouple was placed.
2. Heating pad
The internal layer of the heating pad was composed of mica wound with tungsten filaments, with a thin stainless steel sheet shield on the outside. Mica was inserted between the outer and internal layers as insulation. The dimensions of the heating pads were 10 mm (W) × 2.5 mm (H) × 190 mm (L), and the four surfaces of the copper block at the heating end of the pipe were fitted with heating pads (one for each surface). A DC power supply was used during heating.
3. Thermal paste
Thermal paste with a thermal conductivity of 0.9 W/m K was used within the temperature range of −100°C to +200°C to fill the gap between the heat pipe and heating copper block and the gap between the heating copper block and heating pad to minimize the thermal contact resistance.
4. Insulation material
To minimize heat loss, insulating cotton and tape were applied to the external walls of the evaporation section, cooling system, and adiabatic section.
Cooling system
The cooling system mimicked the isothermal boundary at the condensation section and was composed of a cooling sleeve with an outside diameter of 43 mm, an inside diameter of 31 mm, and a cooling water flow length of 220 mm. Both ends of the water sleeve came with caps with 8-mm-diameter holes for the heat pipe to pass through. O-rings were used to keep them watertight. Additionally, rubber gaskets were inserted between the cooling water sleeve and its caps to keep the system watertight. The condensation section, which accounted for one-third of the length of the heat pipe, was encased in this water sleeve. There were 10 thermocouples in the water sleeve, which passed through the sleeve caps and were sealed, to detect the temperature of the condensation section. A thermo-regulated bath RCB-412 with ±0.05°C to±0.15°C precision and 7 L/min flow rate was used during cooling.
Vibration actuation system
To apply vibrations with specific frequencies and amplitudes, a servo motor was used (for details, see Figure 3). Its output was via a plastic gear at a 1:1 ratio that was connected to the crankshaft through a universal joint to transfer the motion. The overall system was composed of a servo motor with a driver, plastic gear, crankshaft, connecting rod, and linear sliding rail, as described below.
1. Plastic gear
To obtain the output power at a 1:1 gear ratio from the servo motor, two 20-tooth gears were used in the experiment.
2. Crankshaft
A series of holes with diameters of 6 mm were drilled at distances of 2.8, 5, 10, 15, 20, and 25 mm from the center of the crankshaft to allow application of different vibration amplitudes.
3. Connecting rod
A similar mechanism as that for an engine in reciprocal motion was used in this experiment. The functions of the sliding block, connecting rod, and crankshaft in the experiment were similar to those of the piston, connecting rod, and crankshaft in an engine. When the ratio of the length of the connecting rod to the distance shifted from the center of the crankshaft was closer to 10, the speed output conformed more closely to simple harmonic motion 13 ; thus, the length of the connecting rod was set at 200 mm in this study.
4. Linear sliding rail
A linear sliding rail, manufactured by ITK, was applied. Via pre-compression, the rail was capable of loading in all directions and maintaining precise movement left-to-right or up-and-down, without deviation.
Data retrieval system
This system was able to retrieve the output signal from the thermocouples and transform it via data processing for recording. Type-K thermocouples were adopted in this experiment to measure the surface temperature of the heat pipe with an accuracy of ±0.1°C, where one thermocouple was placed every 40 mm along the horizontally set heat pipe, with a total of 14 thermocouples being separately placed at corresponding locations on the top and bottom, for a total of 28 thermocouples. There were 10 thermocouples in the evaporation section, 8 in the adiabatic section, and 10 in the condensation section. The relative positioning is shown in Figure 4. Additionally, one thermocouple each was set at both the inlet and the outlet of the cooling water sleeve to monitor the temperature variation of the cooling water. For the need of different applications, the inclination angles θ are 0°, ±45°, and ±90°.

Layout of the thermocouples.
Experimental procedure
The heat pipe was placed on the experimental table, according to the designed inclination angle. First, a static experiment without applied vibration was performed as a reference. Then, vibrations of various frequencies and amplitudes and different condensation section temperatures were tested. The parameters of experiment were the following:
Longitudinal vibration frequency (f): 3, 4, 5, 6, and 9 Hz;
Vibration amplitude (r): 2.8, 5, 10, 15, 20, and 25 mm;
Acceleration: 0.1–1.01 g (rf2 in simple harmonic motion);
Condensation section temperature (Tc): 20°C, 30°C, and 40°C.
Inclination angles (θ): 0°, ±45°, and ±90°.
The experimental procedure was as follows:
The temperature of the circulated water from the thermo-regulated bath was set to the desired condensation temperatures, that is, to 20°C, 30°C, or 40°C.
The crankshaft endplate was designed to possibly alter the stroke of the heat pipe, corresponding to the desired vibration amplitudes, as shown in Figure 3.
The temperature was monitored until it stabilized, and then the experiment was started.
The servo motor and its controller were turned on, and the speed of the servo motor was adjusted to the desired level.
The recording of the temperature variation began, and the power supply was adjusted to the first increment to heat up the evaporation section.
When the overall temperature of the heat pipe reached stable, the input power was raised with an increment to the next increment, and the next experiment was conducted.
Step 6 was repeated until the capillary limit is reached.
Determination of the heat transfer performance of a heat pipe
The heat transfer performance of heat pipes is usually measured using the maximum heat transfer rate (Qmax) or the thermal resistance (R), which is the ratio of the temperature difference to the input power. Typically, the temperature of the adiabatic section or the condensation section (
In this study, evaporation section and condensation section temperatures were calculated, using the arithmetic averages of the thermocouples in that given region. First, the condensation section temperature was fixed. Then, the input power of the evaporation section was raised incrementally, and the variations of the stabilized evaporation section temperature (
Utilizing equation (1), we can obtain the relationship between the input power and the thermal resistance for each set of experiments. The regression lines of the two sets of data (within and outside the stable thermal resistance regions) can then be solved to determine the maximum heat transfer rate.
Experimental uncertainty
Uncertainties in the measured quantities for this study were estimated to be ±0.1°C in the temperature measured by thermocouples, ±0.05 W in the heat input measured by an electronic watt meter. Following the uncertainty propagation analysis, the uncertainties for the deducted experimental results thermal resistance were estimated as follows: 0.26%–2.59% for the thermal resistance and 0.03%–2.5% for the heating power. These errors are believed to be inconsequential to the results of the experiment.
Results and discussion
Heat transfer phenomena of the 600-mm heat pipe
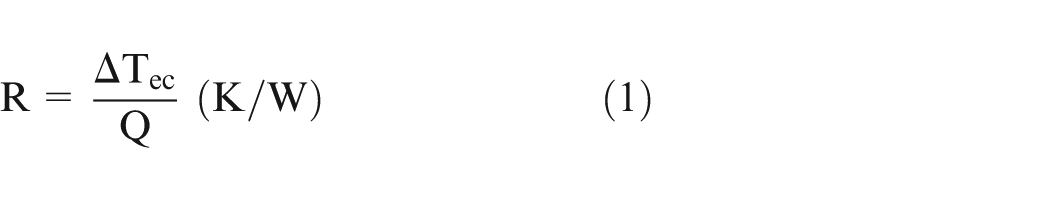
Figure 5 shows the temperature variation of the evaporation section (Te) and the temperature variation at various points along the heat pipe as a function of the heating power. The temperature of the condensation section was 20°C, and the heat pipe inclination angles were 0° (horizontal), 45°, and −45°; the heat pipe was stationary (static). The x-axis of the upper panel in Figure 5 denotes the experimental time, and the y-axis denotes the corresponding temperature at various points along the evaporation section. On the lower panel, the x-axis denotes the thermocouple measurement points (from CH1 to CH14, CH: thermocouples position), and the y-axis denotes the corresponding temperature measurements.
Temperature variation (Te) of the evaporation section and the temperature distribution of the 600-mm heat pipe (Tc = 20°C; static): (a) angle 0°, (b) angle+45°, and (c) angle −45°.
Figure 5(a) shows the heat transfer results when the heat pipe was horizontal and the vibrational state was static. The evaporation section temperature increased when the input power to the evaporation section was gradually increased. When the input power was 5–20 W, the heat pipe’s temperature reached a steady state after 10–30 min. Beginning with an input power of 22 W, as the power input increased, the amplitude of the temperature rise of the evaporation section tended to increase and took longer to reach a steady state (from 50 min to 1 h and 50 min for various positions). Despite the temperature of the evaporation section being high, there was only a modest temperature rise in the insulation section, with measurement points CH13 and CH14 (the two closest to the cooling water inlet) maintaining their temperatures at approximately 20°C.
Figure 5(b) shows the heat transfer results when the heat pipe’s inclination angle was +45° and the vibrational state was static. The temperature of the evaporation section increased as the heat input to the evaporation section was gradually increased. When the input power varied from 20 to 180 W, the heat pipe’s temperature reached a steady state in 10–30 min. Compared with Figure 5(a), when the inclination angle increased (with the condensation section on top), the heat pipe was still able to effectively maintain a proper evaporation section temperature under a higher input power. For example, after the steady state with an input power of 40 W was reached, the evaporation section’s highest temperature in Figure 5(b) was approximately 150°C less than the corresponding highest temperature in Figure 5(a).
Figure 5(c) shows the heat transfer results when the heat pipe’s inclination angle was −45° and the vibrational state was static. The temperature of the evaporation section increased as the input power to the evaporation section was gradually increased. When the input power varied from 2 to 20 W, the heat pipe’s temperature reached a steady state in 1 h to 1 h and 30 min. After the evaporation section’s temperature increased significantly, the heat insulation temperature also increased slightly; however, the cooling section temperature remained approximately 20°C. Compared with Figure 5(b), as the inclination angle decreased (with the condensation section on the bottom), the heat pipe could not effectively maintain a proper evaporation section temperature with a low input power. After the steady state with an input power of 20 W was reached, for example, the evaporation section’s highest temperature in Figure 5(c) was at least 150°C greater than the corresponding highest temperature in Figure 5(b) and was even greater than the corresponding highest temperature in Figure 5(a).
Figure 6(a) shows the heat transfer results when the heat pipe’s inclination angle was horizontal and the longitudinal vibrational amplitude was 5 mm (f = 3 Hz); the temperature of the evaporation section increased when the input power to the evaporation section was gradually increased. When the input power was 5 or 20 W, the temperature of the heat pipe reached a steady state in 10–30 min. Beginning at an input power of 22 W, as the power input increased, the amplitude of the evaporation section temperature rise tended to increase, and the section took longer to reach a steady state (from 50 min to 1 h and 40 min, depending on the scenario). Compared with Figure 5(a), in which the input power was 5–20 W, the steady-state temperatures were approximately similar. Beginning at an input power of 22 W, the steady-state temperature in Figure 6(a) was 3°C–7°C less than the steady-state temperature in Figure 5(a).

Temperature variation (Te) of the evaporation section and the temperature changes at various measurement points of the 600-mm heat pipe (Tc = 20°C, r = 5 mm, and f = 3 Hz): (a) angle 0°, (b) angle +45°, and (c) angle −45°.
Figure 6(b) shows the heat transfer results when the heat pipe’s inclination angle was +45°; the temperature of the evaporation section increased as the input power to the evaporation section was gradually increased. When the input power varied from 20 to 180 W, the temperature of the heat pipe reached a steady state in 10–30 min. Compared with Figure 6(a), the heat pipe was able to effectively maintain a proper evaporation section temperature under a higher input power. When the input power was 40 W, the steady-state evaporation temperature in Figure 6(b) was at least 140°C less than the steady-state evaporation temperature in Figure 6(a).
Figure 6(c) shows the heat transfer results when the heat pipe’s tilt angle was −45°; the temperature of the evaporation section increased as the input power to the evaporation section was gradually increased. When the input power varied from 2 to 20 W, the heat pipe’s temperature reached a steady state in 1 h to 1 h and 30 min. Compared with Figure 6(b), the heat pipe could not effectively maintain a proper evaporation section temperature under low input power. When the input power was 20 W, the steady-state evaporation temperature in Figure 6(c) was at least 150°C greater than the steady-state evaporation temperature in Figure 6(b). The results of the conditions with other vibration frequencies and amplitudes were similar to the above-mentioned conditions and thus will not be described in detail.
Figure 7(a) shows the relationship between the heating input power (Q) and the thermal resistance (R) when the heat pipe’s inclination angle was horizontal; the x-axis denotes the input power, and the y-axis denotes the corresponding thermal resistance under various vibrational amplitudes. To collate the various steady-state results in Figure 5, we derived the temperature difference (

The relationship between the input power (Q) and the thermal resistance (R) of the 600-mm heat pipe: (a) angle 0°, (b) angle +45°, and (c) angle −45°.
Figure 7(b) shows the relationship between the input power and thermal resistance under different vibration amplitudes when the heat pipe’s inclination angle was +45°. When the input power increased from 20 to 180 W, the thermal resistance was approximately 0.25 K/W, and the amplitude did not affect the thermal resistance. Figure 7(c) shows the relationship between the input power and thermal resistance under different vibration amplitudes when the heat pipe’s inclination angle was −45°. When the input power was 2 W, the thermal resistance was as high as 12 K/W, and the amplitude did not affect the thermal resistance.
Figure 8 shows the relationship between the input power and thermal resistance of the 600-mm heat pipe under different inclination angles, condensation section temperatures, and acceleration states. A positive inclination angle indicates that the condensation section was on the top; a negative inclination angle indicates that the condensation section was on the bottom. When the inclination angle was horizontal (Figure 8(c)), the maximum heat transfer of a heat pipe increases as the working temperature of the heat pipe increases. It is clear that increasing the temperature of the condensation section can result in higher heat transfer capacities for the heat pipe.

The relationship between the input heating power (Q) and thermal resistance (R) for the 600-mm heat pipe (θ = 0°, ±45°, and ±90°): (a) θ = 90°, (b) θ = 45°, (c) θ = 0°, (d) θ = −45°, and (e) θ = −90°.
When the inclination angle was 45° (Figure 8(b)), a no dry-out condition occurred in the heat pipe as the input power increased. In addition, all of the thermal resistances were close to 0.25 K/W, regardless of the vibration conditions and condensation section temperature. When the inclination angle was 90° (Figure 8(a)), the experimental results were similar to those obtained at a 45° inclination angle; a no dry-out condition was observed, and the thermal resistance was close to 0.25 K/W. Therefore, by placing the equipment at the proper angle (with the condensation section on top and the evaporation section on bottom), a low heat pipe thermal resistance can be obtained, a resistance which will be almost constant regardless of the vibration condition and condensation section temperature.
When the inclination angle varied between −45° and −90° (Figures 4(d) and 8(e)) and Tc = 20°C, the thermal resistance decreased as the input power increased. When Tc = 30°C or 40°C, the thermal resistance increased first and then decreased as the input power increased, which resulted in an extreme value for the thermal resistance (when the input power was 6–8 W). Overall, the thermal resistance value decreased as the condensation section temperature increased. Despite the thermal resistance changing as the input power and the condensation section temperature changed (due to the fairly high thermal resistance), the heat pipes lost their ability to act as heat dissipation channels at inclination angles of −45° or −90°.
To summarize the above discussion, we know that when the inclination angle was horizontal, the heat pipe could enhance its ability to transfer heat by taking advantage of the relationship between its capillary structure and acceleration. When the inclination angle was positive, the working fluid, relying on gravity, transferred the condensation section’s cooling fluid to the evaporation section and cooled it. Inside the heat pipe, the evaporation steam flow rapidly mixed with the cooling fluid, which improved its heat transfer capability. When the inclination angle was negative, the working fluid could not circulate naturally via gravity; therefore, the necessary amount of working fluid could not travel to the evaporation section, even when the vibration acceleration increased. There was no heat exchange between the evaporation section’s steam flow and the cooling fluid, which substantially degraded the heat transfer capability.
Heat transfer phenomena of the 150-mm heat pipe
In the previous section, we learned that when the inclination angle was negative (when the condensation section was on the bottom), the 600-mm heat pipe’s working flow could not use vibrations to overcome the influence of gravity and reach the evaporation section from the condensation section on the bottom, even when the maximum vibrational acceleration allowed was used. In this section, therefore, we describe the heat transfer results for the 150-mm heat pipe with the axial vibration at different inclination angles. The basic temperature change trends were similar to those of the 600-mm heat pipe. Therefore, the results are not discussed in detail here.
Figure 9 shows the input power and heat pipe thermal resistance for the 150-mm heat pipe at different inclination angles (condensation section Tc = 30°C, under various accelerations). When the inclination angles were 0°, 45°, and 90°, the thermal resistances were 1.2, 1, and 0.75 K/W, respectively. We found that when the inclination angle was positive, the thermal resistance decreased as the inclination angle became greater. When the inclination angles were −45° and −90°, the thermal resistances were 8.5 and 9.5 K/W, respectively. Thus, the heat pipe was no longer serving as a heat dissipation channel, and the thermal resistance values were not affected by adding longitudinal vibration. This result again shows that under the experimental conditions, the heat pipe’s inclination angle is the dominant factor affecting heat pipe heat transfer. If we use the proper inclination angles (with the condensation section on the top and the evaporation section on the bottom) of the heat pipe, we can obtain a fairly low thermal resistance regardless of the vibration conditions or condensation section temperature.

The relationship between the input heating power (Q) and thermal resistance (R) for the 150-mm heat pipe (θ = 0°, ±45°, and ±90°).
Conclusion
The conclusions for this study are listed below:
When the length of the heat pipe was 600 mm and its inclination angle was horizontal, the thermal resistance decreased to a minimum value of 0.25 K/W as the applied heat load was increased to 10–30 W. However, continuously increasing the heating power resulted in dramatically nonlinear thermal resistance increases. We also found that in addition to the amplitude increases, the thermal resistance decreased, which delayed the occurrence of heat pipe dry-out. When the inclination angles were 45° and 90°, the no dry-out condition occurred as the input power increased, and the average thermal resistance was approximately 0.25 K/W, regardless of the vibration condition or condensation section temperature. When the inclination angle was −45° or −90°, high thermal resistance prevented the heat pipe from serving as a heat dissipation channel, although the heat resistance values changed as the input power and condensation section temperature changed.
When the length of the thermal pipe was 150 mm and the inclination angles were 0°, 45°, and 90°, the thermal resistances were 1.2, 1, and 0.75 K/W, respectively. When the inclination angle was positive, the thermal resistance value decreased as the inclination angle increased. When the inclination angles were −45° and −90°, the thermal resistances were fairly high, and the values were not affected by axial vibration.
When the inclination angles of the 150-mm and 600-mm heat pipes were negative (when the condensation section was on the bottom), the working flow could not use the vibration to overcome the influence of gravity and move from the condensation section to the evaporation section, even under the maximum allowed vibration acceleration.
A fairly low heat pipe thermal resistance was obtained when the heat pipe was positioned at the proper inclination angles (with the condensation section on the top and the evaporation section on the bottom); additionally, the thermal resistance value was almost constant (approximately 0.25 K/W for the 600-mm heat pipe and approximately 0.75–1.2 K/W for the 150-mm heat pipe), regardless of the vibration conditions or the condensation section temperature.
Footnotes
Appendix 1
Declaration of conflicting interests
The authors declare that there is no conflict of interest.
Funding
This study was support by the National Science Council of ROC through Grant No. NSC 100-2221-E-218-048-MY2.