
Abstract
Large quantities of micro-scale pores are observed in the matrix of closed-cell aluminum alloy by scanning electron microscope, which indicates the dual-scale pore characteristics. Corresponding to this kind of special structural morphology, a new kind of dual-scale method is proposed to estimate its effective thermal conductivity. Comparing with the experimental results, the article puts forward the view that the prediction accuracy can be improved by the dual-scale method greatly. Different empirical formulas are also investigated in detail. It provides a new method for thermal properties estimation and makes preparation for more suitable empirical formula for closed-cell aluminum alloy.
Introduction
The closed-cell metal foam has been applied in the thermal insulation field due to its high specific surface area, high porosity, low thermal conductivity, and excellent mechanical properties. But owing to complicated structure characteristics, its thermal conductivity prediction models considering porosity effect only often show large magnitude of error. It is still not very simple for its thermal conductivity to be estimated accurately. Corresponding to different structure type, many empirical formulas for porous media have been proposed in the past. The successful examples include the Maxwell model fit for the dilute granule type porous media, 1 the Maxwell–Eucken model applied to matrix type, 2 and the Beherm model suitable for the fiber porous material. 3
The closed-cell metal foam belongs to a kind of granular porous media in which the void volume is occupied by gaseous components. According to Carson and Sekhon’s 4 research, it could be also classified as “internal porosity” material that consists of large quantities of isolated pores. Heat flux is mainly conducted through continuous metal matrix networks. For this case of sphere pores distributed in the matrix, the most representative researches include the Series Model, 5 Maxwell–Eucken models, 6 and Effective Medium Theory (EMT) equation. 7 The well-known conductivity bounds presented by Hashin and Shtrikman 6 were mathematically equivalent to the two forms of the Maxwell–Eucken formulas. It is proposed that the effective thermal conductivity bounded region may be divided into internal porosity and external porosity regions. 4 For the random dispersion of two components, the effective conductivity is modeled well by the EMT equation. 8
However, the aforementioned models are only applicative in single porosity situation, namely, the porous media with relatively uniform pore distribution. The dual-porosity model has already been successfully used in explaining the soil infiltration mechanism. Under some heat transfer problem, such as bi-dispersed wick media, 9 it was also applied. The essence of dual-porosity model lies in the simplification as double pore-scale levels for some porous media, which consist of both kinds of pores: macro-pores and micropores. Generally, micropores are contained within matrix or large particles. The soil in nature is the representative of this kind of interesting structure.
In our research, by Scanning electron microscope, many micropores are found in the matrix of closed-cell metal foam. Corresponding to this special kind of structural morphology, the dual-scale method is used to predict the thermal conductivity of closed-cell aluminum foam in order to reduce the forecasting errors.
Experiment measurement
The closed-cell Al-Si aluminum alloy (ZLD102) is fabricated by the carbon dioxide (CO2) foaming method, in which the silicon content is almost 10%−12%.The CO2 is sealed in the closed-cells, in which thermal conductivity is about 0.014 W/(m·K).
The closed-cell aluminum foam samples are processed into cylinders 56 mm in diameter and 10 mm in length. The Unitherm TM Model 2022 thermal conductivity tester, a kind of guarded heat flow meter, is used to measure the thermal conductivity of various samples with medium to low thermal conductivity. These tests are conducted in accordance with American Society for Testing and Materials (ASTM) standards E-1530. In order to meet the test requirements, the surface of both ends of cylinder are coated by phonetic resin in order to reduce the interface contact thermal resistance. The testing temperature difference between the top and bottom surfaces is controlled to be 30°C. Compared with standard sample’s thermal conductivity, it is very convenient to obtain the ones for the test samples. It is estimated that the experiment error ranges within 10%. It mainly originates from two aspects: one-dimensional assumption during measured process and interface contact thermal resistance both in the top and the bottom surface. Since the size of the used samples do not lie between 0.5 and 5 mm, 1 the contribution of the convection effect could not be negligible. But due to the testing condition approaching the normal temperature range, the radiation heat transfer effect is thus small.
After the tests, the samples are divided in halves by spark-erosion wire cutting, with the surface modification technique applied to produce the optical contrast effect between pore and matrix.
The digital photograph of longitudinal sections, as presented in Figure 1, are taken by high resolution camera or scanning electron microscopy. Then by the MATLAB software, scanning photograph would be transformed into binary data files, whose pixel matrix is 1290 × 256. In Figure 1, the black part represents the pores, whereas the white part represents the aluminum matrix. In order to ascertain the micropore distribution in matrix, the cold field emission S-4800 scanning electron microscopy is used to get the local structure information from local matrix surface. By magnifying these photographs 3000 times, many micropores thus could be observed, as shown in Figure 2. The diameter of these micropores ranges from 1 to 5 µm, and their porosity ranges from 8% to 12%. These micropores may have a significant impact on heat flow through the matrix network. Hence, the matrix of aluminum foam also shows “porous” characteristics, and its real thermal conductivity is, in fact, lower than that of pure aluminum.

Schematic diagram of sample profile A2 (porosity 81.8%, no magnification).

Schematic diagram of local matrix surface from sample A2: (a) 1000 times magnified and (b) 3000 times magnified.
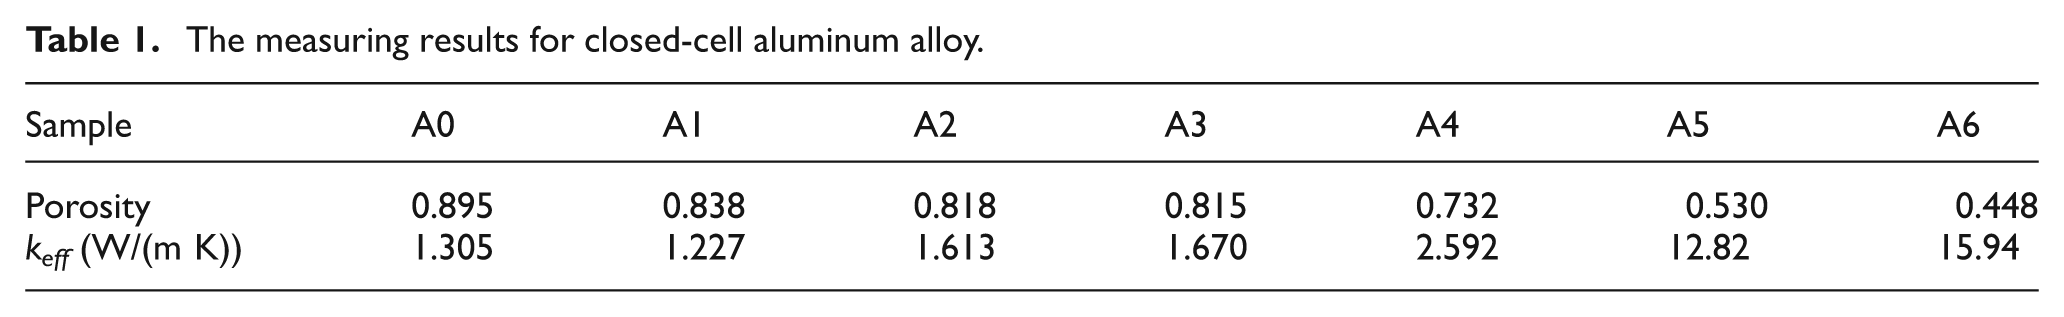
As the thermal conductivity of metal matrix and gas in pore differs almost 10,000 times, quantities of micropores within the metal matrix might play an important role in the effective thermal conductivity and need to be considered, else computation result will be higher than measured data. Therefore, it is still difficult to provide credible prediction by the reference to the available theoretical models for effective thermal conductivity of metal foam. With numerical heat transfer developed, it is possible to compute the thermal properties directly by solving the heat conduction differential equation based on detailed structure information. However, limited by measurement accuracy of scanning microscope, the corresponding information in the matrix is usually difficult to be included, which might lead to unforeseen computation error. Seven closed-cell aluminum foam samples are analyzed, as depicted in Figure 1 and Appendix 2. The measured results of thermal conductivity are displayed in Table 1.
The measuring results for closed-cell aluminum alloy.
Physical model
Assuming that the natural convection and radiation in the cells is neglected, only heat conduction is considered. Therefore, the case can be simplified as two-dimensional heat conduction problem in the mixture, whose main governing equation is described by Poisson’s equation

The finite-difference numerical method is introduced (the inner-node method). In the steady state, an energy balance was applied to each node, which is represented in an algebraic equation for the temperature of each node where top and bottom surface temperatures are denoted respectively by T1 and T2, assuming that the other two side surfaces are isothermal. The Gauss–Seidel iteration method turns out to be suitable for solving the coefficient matrix that involves all nodal equations. Then, heat flux along the direction of the imposed temperature gradient could be calculated. The thermal conductivity of aluminum foam sample is described by the equation below

Where keff is the effective thermal conductivity (W/(m·K)), Q the heat flux along the temperature gradient (W/m2), A the surface area perpendicular to direction of heat flux (m2), and L the height of sample (m).
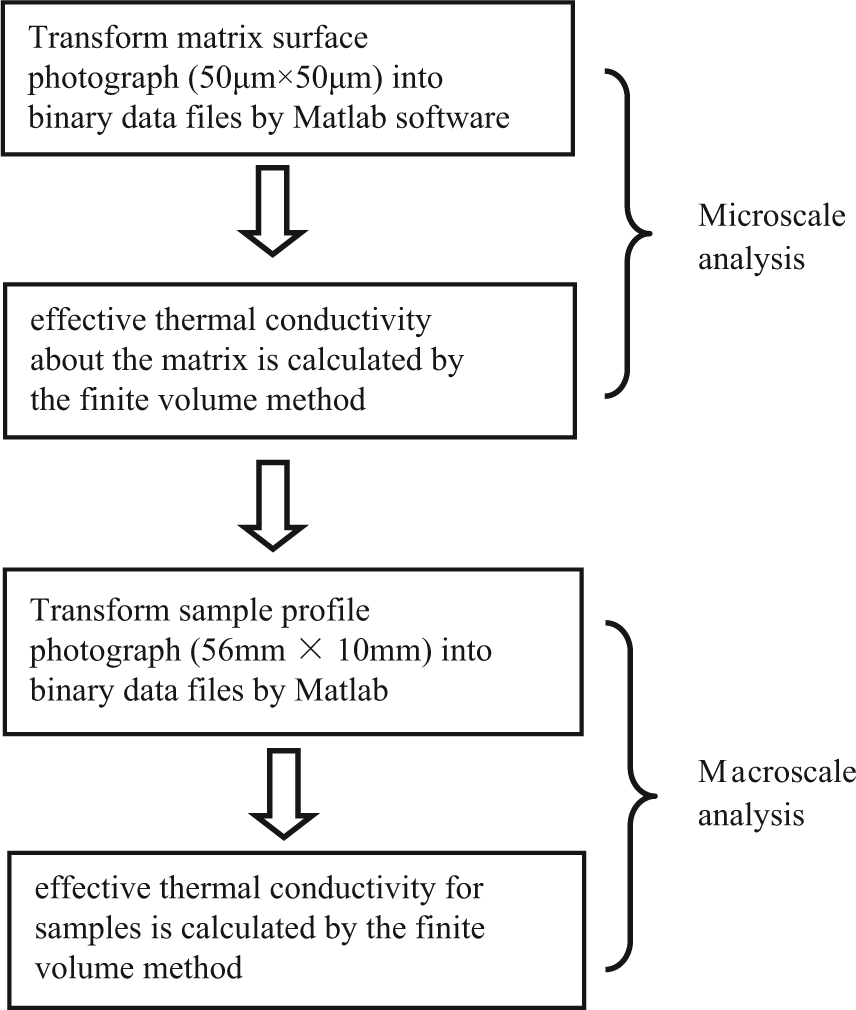
In order to consider the influence of micropore, the numerical procedure of dual-scale method, as shown in Figure 3, includes two steps: in the first step, when the matrix surface photograph (size: 60 µm × 50 µm) is magnified to 3000 times, as shown in Figure 4, the effective thermal conductivity of the matrix is calculated by the finite volume method. In Figure 4, the micropore porosity of the matrix is calculated to be about 10% by MATLAB graphical analysis module; in the second step, the thermal conductivity of aluminum matrix is replaced by the calculated value in the first step. Then, according to the sample profile photograph (size:10 mm × 50.8 mm), the effective thermal conductivities about the aluminum alloy samples were figured out by the finite volume method again. In the numerical analysis, the matrix thermal conductivity is set as 100.7 W/(m·K) owing to the influence of silicon, and thermal conductivity of gas in pore is about 0.014 W/(m·K). If the micropore effect is considered, real matrix thermal conductivity is close to almost 60 W/(m·K) through the first calculation step for the sample A2, with 10% microporosity.
The numerical procedure for the dual-scale method.
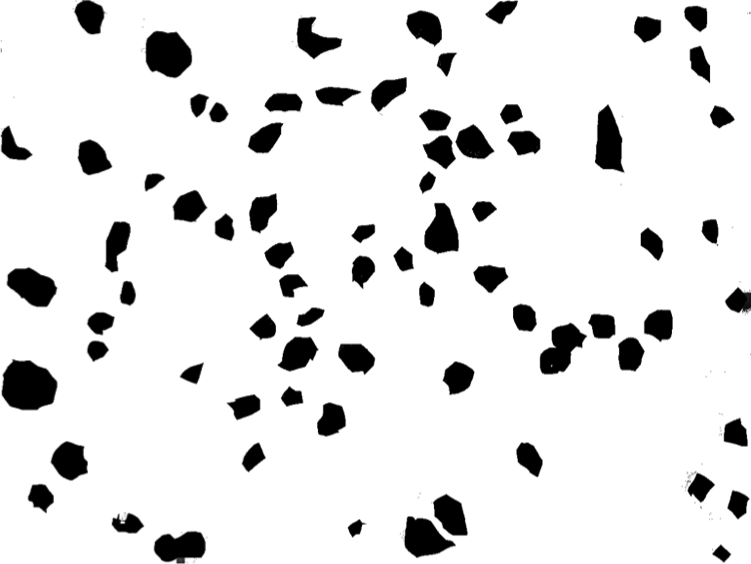
The micropore distribution of metal matrix for the sample A2 obtained by MATLAB.
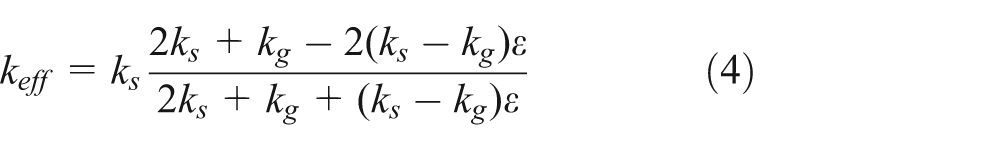
Finally, based on the application of the numerical procedure described above, some empirical formulas for closed-cell aluminum foam, frequently used, are investigated, known as the Series Model, Maxwell–Eucken model I, Maxwell–Eucken model II, and EMT model:
Series Model
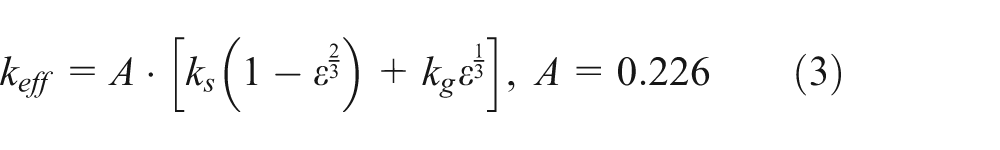
Maxwell–Eucken model I
Maxwell–Eucken model II
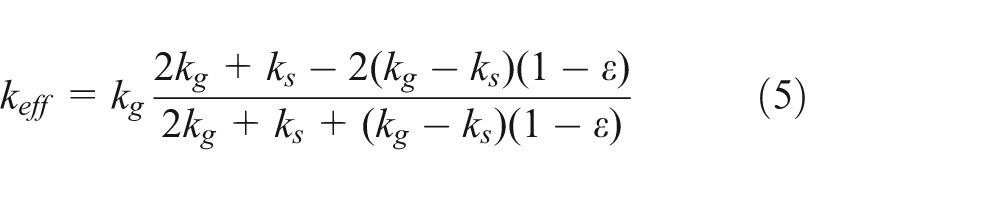
EMT model

The Series Model is also called as the Misnar modified model. 10 It is also found that the relative thermal conductivity ratio (keff/ks) calculated by the Maxwell–Eucken model II is very low as the pore porosity is not equal to zero because the thermal conductivity between metal matrix and gas in pore differs by almost 10,000 times. Therefore, the Maxwell–Eucken model II is not considered by our work.
There is no doubt that the empirical formula shows some convenient merits. However, other problems do exist in these models when describing the thermal conductivity of closed-cell aluminum foam. First, the errors of different models lack the support of systematic research. Second, many empirical formulas have empirical constant, which are given by statistical fitting method and thus show no clear physical meaning.
Experimental and computation results
As shown in Table 2, thermal conductivity of closed-cell aluminum alloy bears complicated relation to the porosity. If the porosity is lower than 80%, thermal conductivity will increase rapidly with the decrease of the porosity, and if the porosity lies between 80% and 90%, the thermal conductivity shows strange function in relation to the porosity. The forecasting errors mainly come from two kinds of sources: (1) lacking of overall three-dimensional structure information and (2) the influence of microstructure related to pore and matrix distribution. The latter could be shown clearly via the A2 and A3 samples. Both samples have almost the same porosity, but different measured thermal conductivity.
Comparison between measured data and numerical method.
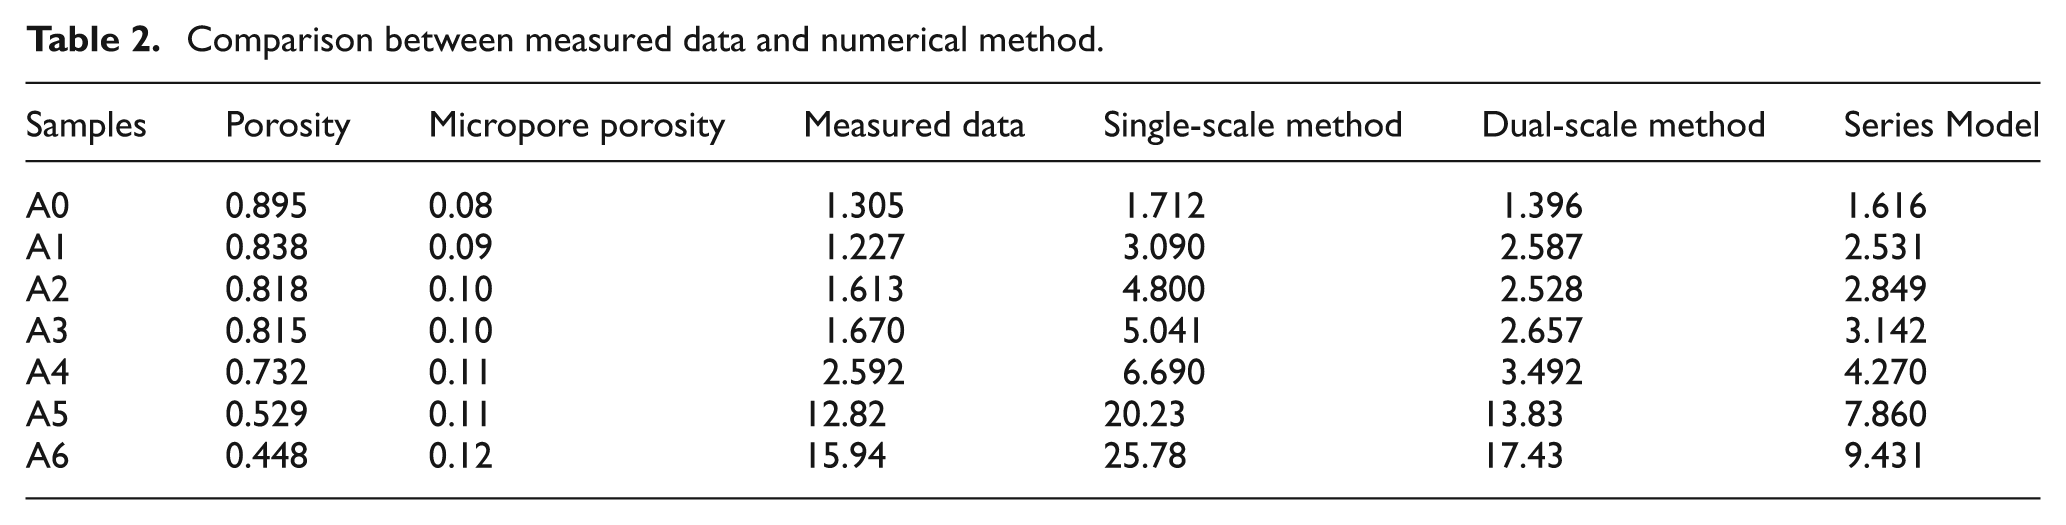
Thermal conductivities for some closed-cell aluminum alloy samples are analyzed by both the single-scale method and the dual-scale method, as displayed in Table 2. Calculation results show that the single-scale method proves to be acceptable for high porosity sample A0. In contrast, the results for the lower porosity samples (<85%), predicted by the single-scale method, are almost twice larger than measured ones sometimes. If the dual-scale method is applied, more accurate results will be obtained, in which the computation errors are less than 60% except for sample A1. Especially, for the samples with porosity lower than 70%, the numerical results are in good agreement with measured ones.
For high-porosity samples, the percent of matrix is relatively low, which indicates that the matrix has little effect on heat conduction process, and thus single-scale method is valid. With the decrease of porosity, the matrix plays a more and more important role on heat conducting process. The influence of micro-pore in the matrix will be gradually manifested. This study also shows that if the porosity ranges between 80% and 85%, the errors from both numerical methods are all over 50%, which may be caused by structure information loss due to two-dimensional simulation.
Besides, the empirical formulas are also investigated. Figure 5 shows the relation between relative thermal conductivity and porosity. For medium porosity samples (lower than 70%), results from the Series Model seem to deviate from measured data largely, but computation errors from chart 3 in fact are not very large relatively, compared with samples whose porosity ranges between 80% and 85%. This is because of high effective thermal conductivity for closed-cell aluminum alloy with medium porosity. Obviously, the EMT model is more suitable than the Series Model for medium porosity samples. As porosity is higher than 70%, although computation error seems to be larger than 50%, relative thermal conductivities calculated by the Series Model are in good agreement with measured data, which also proves that the Series Model is somewhat effective for these samples. In general, the dual-scale method is much superior to the Series Model, which could be clearly seen from the comparison among results in Table 3. From Figure 5, it can be seen that the prediction results by the Maxwell–Eucken model are much higher than the measured ones for all samples.

Comparison of equations (3), (4), (6), simulation and measured data.
Prediction error by different numerical methods.

Conclusion and discussion
Because of the measurement limitation, this research is mainly based on two-dimensional profile information. For more accurate prediction, more detailed structure information will be needed. The key of this problem lies in how to compromise between the complication and the feasibility of the research. Although the three-dimensional simulation can provide the most reliable solution, yet other difficulties, such as excessive time-consumption, storage demand, and so on would be met. In order to manifest the micropore effect, it will lead to massive information storage problem if the three-dimesional profile is applied. Measured in the unit of micron (1 µm), 10,000 × 10,000 × 10,000 data file for the 1 cm3 sample will be actually needed. Furthermore, granted that the length of the sample be within this range (<1 cm), scale effect problems may arise, which means the thermal conductivity is related to the length scale of the sample. Therefore, it does not follow the pattern “the more complicated, the better.” This is the reason why multi-scale method is very suitable for dealing with this kind of dilemma. This work also lays foundation on exploring more suitable empirical formula for closed-cell aluminum alloy in the future, which should consist of both macroporosity and microporosity.
Footnotes
Appendix 1
Appendix 2
Academic Editor: Dong Liu
Declaration of conflicting interests
The authors declare that there is no conflict of interest.
Funding
We gratefully acknowledge the Jiangsu University of Science and Technology Foundation (35011001), and the financial support of the National Nature Science Foundation of China (21106058) and (51206062).