
Abstract
A machine vision–based geometric dimension measurement system for multitarget industrial workpieces is proposed to improve the efficiency and accuracy of conventional manual inspection. The system integrates image acquisition, dimensional calibration, image preprocessing, subpixel edge extraction, morphological refinement, and parameter measurement into a complete noncontact inspection framework. High-resolution workpiece images are captured by an industrial camera, followed by grayscale transformation and guided filtering to suppress noise while preserving edge details. Subpixel edge extraction based on gradient analysis and Zernike moments is then applied to improve contour localization accuracy. Morphological processing and connected-domain labeling are further used to separate multiple targets and calculate geometric parameters including edge length, contour perimeter, and aperture size. A calibration strategy is established to convert pixel coordinates into physical dimensions through a standard reference block. Experimental results demonstrate that the proposed system achieves stable repeatability, high consistency with manual measurement, and significantly improved inspection speed. Compared with conventional manual inspection, the proposed framework provides a practical and efficient solution for multi-target dimensional measurement in industrial environments.
Introduction
With the advent of Industry 4.0, higher levels of automation and intelligence in manufacturing systems have become essential for modern industrial development. Machine vision, which enables machines to replace human visual judgment in inspection and recognition tasks, has gradually become one of the core enabling technologies in intelligent equipment and automated production systems. Traditional dimensional inspection methods for mechanical components, such as calipers, gages, and profilometers, remain widely used in industrial quality control. However, these contact-based methods are often limited by low efficiency, operator dependence, and insufficient adaptability to high-throughput production environments, particularly in high-precision manufacturing scenarios where both speed and repeatability are critical. Machine vision detection technology measures object dimensions through digital image analysis of target components.1,2 Compared with conventional measurement approaches, it offers non-contact operation, high speed, and strong integration capability with automated production lines. 3 Nevertheless, the performance of machine vision systems strongly depends on imaging conditions, feature extraction robustness, and calibration accuracy, which remain major challenges in practical industrial applications.
Existing studies on machine vision-based dimensional measurement can generally be categorized into three main directions.4–6 The first focuses on high-precision geometric parameter measurement of standard industrial parts. For example, Jiao et al. 7 proposed a subpixel flange measurement method that improved edge localization accuracy, while Dai et al. 8 developed a thread parameter extraction method capable of accurately identifying external thread profiles. Zhou and Yu presented a chisel edge wear measurement method of high-speed steel twist drills based on machine vision, demonstrating the applicability of subpixel visual analysis in industrial tool monitoring. 9 Although these methods achieve high precision under controlled imaging conditions, they are usually designed for specific geometries and show limited adaptability when applied to parts with variable structural features. The second category concerns application-oriented measurement systems for industrial product inspection. Wang et al. 10 developed a black fungus grading control system, Liu et al. 11 proposed an apple weight estimation method, and Wei and Wang 12 designed a pearl shape detection framework. These studies demonstrate the practical value of machine vision in automated classification and quality evaluation. However, most of these systems focus on agricultural or consumer products with relatively simple contour characteristics, and their methods are less suitable for mechanical workpieces requiring higher dimensional tolerance control. The third category addresses complex industrial feature recognition and multi-feature measurement tasks. Huang et al. 13 proposed screw-hole measurement based on line and circle detection, while Chen et al. 14 designed a feature parameter measurement system for circular parts to improve concentricity evaluation efficiency. Yang et al. 15 combined connected domain analysis with neural networks for multi-type workpiece localization, and Liu et al. 16 applied machine vision to weld area detection. Although these methods improve automation capability, many rely on predefined feature assumptions or multiple processing stages, which increases computational complexity and reduces robustness in practical deployment.
Although machine vision has been widely applied in industrial dimensional inspection, most existing studies mainly focus on single-object measurement, specific feature extraction, or laboratory-controlled scenes. In many practical industrial applications, however, multiple workpieces appear simultaneously under varying illumination, material reflectivity, and positional uncertainty, which increases the difficulty of stable dimensional extraction. In addition, many previous studies emphasize algorithm design but provide limited discussion on complete engineering implementation, including hardware integration, calibration strategy, software deployment, and real-time industrial operation. To address these limitations, this paper develops a machine vision–based geometric dimension measurement system for multitarget workpieces under practical industrial conditions. Unlike existing studies focusing mainly on isolated algorithms, the present work integrates hardware configuration, calibration, guided filtering, subpixel edge extraction, morphological analysis, and software implementation into a complete measurement framework.
The main contributions of this study are summarized as follows:
(1) An intelligent machine vision measurement system is established to achieve automated, noncontact, and high-precision workpiece dimensional inspection.
(2) A complete image-processing pipeline combining guided filtering, subpixel edge extraction, and connected-domain analysis is designed for robust multi-target measurement.
(3) Experimental validation demonstrates that the system achieves high consistency with manual measurement while significantly improving inspection efficiency.
(4) The novelty of this work lies not only in algorithm application but also in the complete engineering integration of multi-target dimensional measurement under practical industrial constraints.
Composition of the measurement system
The overall system architecture includes hardware and software.
Hardware structure
The measurement system designed in this article consists of a bracket, light source system, lens, industrial camera, and computer (as shown in Figure 1). The computer is equipped with an operating system and software. The industrial camera is connected to the computer through a USB standard interface and captures images in real time. Placing the workpiece on a high platform is necessary to ensure that the workpiece is within the imaging range of the camera and is placed smoothly. The circular LED white light source is installed below the camera, with a black nonreflective screen as the shooting background. The calibration board is placed in the same plane as the surface of the target being photographed to eliminate as much external light interference as possible. This system requires that the random distribution of workpieces does not overlap when collecting images to be suitable for image analysis. Additionally, a certain color difference exists between the background color and the target to more accurately extract the workpiece boundaries.

System hardware structure.
To ensure sufficient dimensional measurement accuracy, the camera and lens configuration were selected according to the required spatial resolution. The industrial camera provides an image resolution of 2048 pixels × 1536 pixels, and the lens model is AFT-0850ZMP. Under the current field-of-view setting, the theoretical spatial resolution can be estimated by:

where R denotes the spatial resolution, FOV represents the effective field of view, and N is the number of pixels along the measurement direction.
Assuming the effective field of view is approximately 150 mm, the theoretical spatial resolution is approximately:

This resolution provides sufficient support for subsequent subpixel edge localization and dimensional conversion.
System software composition
The system software research group selected software produced by MathWorks in the United States as the image processing and algorithm design software for the machine vision measurement system.17–20 This software has a history of nearly 50 years since its successful development. Over the years, it has become an internationally renowned standard computing software through continuous improvement and upgrading by software developers and has a wide range of applications worldwide. The programming software was chosen as the image processing and algorithm design software for this project because it has a very elegant and convenient user interface that can complete most image processing and analysis work. It also has a very mature algorithm function library.
Figure 2 shows the measurement process of the industrial part size measurement algorithm. Before measuring the industrial part dimensions, first, the resolution, exposure time, and other control parameters of the visual system are set based on the state of the workpiece to ensure that the workpiece is fully collected. Then, a dot matrix is used to calibrate the machine vision system, establish a mapping relationship between image pixel coordinates and real-world coordinates, and obtain image calibration information. After completing system calibration, the feature points of the tested part are used as the pixel coordinate system origin, and an image of a certain part is collected as a standard image to establish a reference coordinate system. The measurement area based on the translation and rotation of the measurement coordinate system is adjusted compared to the reference coordinate system, ensuring that the relative position of the measured part in the measurement area remains unchanged. The collected data are transferred to the computer terminal for storage and processing. The contour features of the workpiece are obtained through image algorithm processing of the workpiece shell image, and the position, size, diameter, roundness, and other information of the threaded circular hole are analyzed and calculated. The pixel size is converted into the true size based on the obtained image calibration information. Finally, a report is generated and the results on the workpiece quality detection software of the industrial computer are displayed.

Software structure of the system.
System workflow
The image processing module includes several modules, such as image acquisition, grayscale transformation, filtering and noise reduction, edge extraction, morphological processing, parameter analysis. The image acquisition module can drive the industrial camera to transmit data to the computer. Image transformation can convert 24 b color images into 8 b grayscale images. The filtering and noise reduction module can remove noise and clutter through filtering operations. Edge detection can detect target edges through edge detection operators. Morphological processing can remove potential false targets. Finally, the parameter analysis module can measure and display the obtained parameters. In addition, the system has an automatic calibration module to obtain the standard size corresponding to each pixel. The composition diagram is shown in Figure 3.

The main structure of the algorithm.
The overall workflow of the proposed measurement algorithm follows a sequential processing mechanism. First, high-resolution images are acquired under fixed illumination conditions. Second, grayscale conversion and guided filtering are performed to suppress noise while preserving edge structures. Third, edge contours are extracted using gradient-based subpixel localization. Fourth, morphological operations remove small internal defects and improve contour integrity. Fifth, connected-domain labeling separates multiple workpieces. Finally, dimensional parameters are calculated through calibrated pixel-to-physical conversion. This workflow ensures that each processing stage contributes to improving robustness and dimensional accuracy under practical industrial conditions.
Unlike learning-based methods, the present system does not require training datasets. Instead, repeated calibration-image acquisition is performed to establish stable pixel-to-physical conversion coefficients.
Grayscale transformation
To accelerate computation and simplify the processing model, grayscale conversion is applied to the original images since industrial images are typically captured in RGB color format. According to the principle of human visual perception, the sensitivity of the human eye to different color components varies. Therefore, the weighted average method is adopted for grayscale conversion, which can be expressed as:

Here,
Filtering
Filters are chosen for processing to eliminate the random noise caused by the image acquisition process. 21 Traditional Gaussian filtering has the inherent drawback of losing edge details. Compared to bilateral filtering, which also has edge preservation characteristics, the time complexity of guided filtering is independent of window size; therefore, it has the characteristic of faster calculation speed and can overcome the “gradient reversal” artifacts that may be introduced by bilateral filtering. Thus, a guided filter with a good edge preservation effect is used instead of a Gaussian filter to denoise the image. A guided filtering schematic diagram is shown in Figure 4.
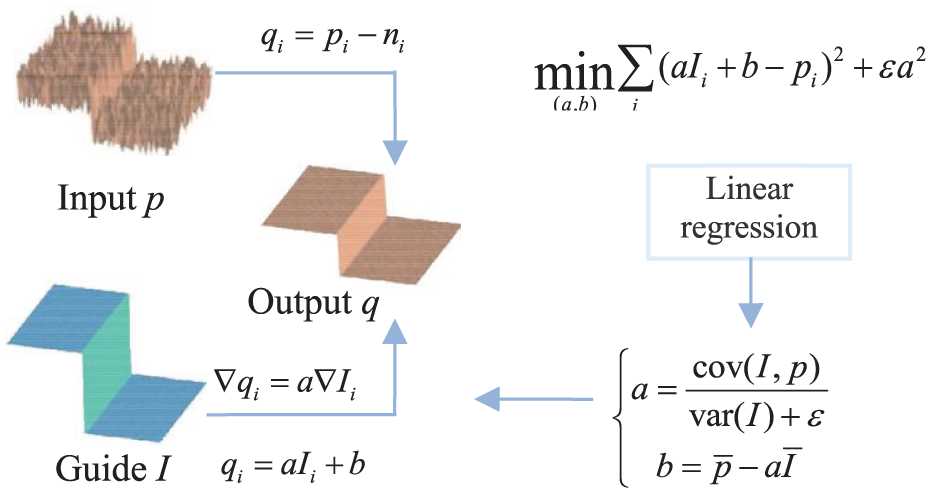
Guided filtering flowchart.
Edge detection
The difference is calculated in this article to obtain subpixel edges and the size and direction of the grayscale gradient of the filtered image. Then, the edges are refined through non-maximum suppression. Finally, the image is lagged and connected by a dual threshold setting to obtain the complete edge contour of the target image. Based on this, subpixel edges are extracted using Zernike moments (Figure 5).

Subpixel edge extraction process.
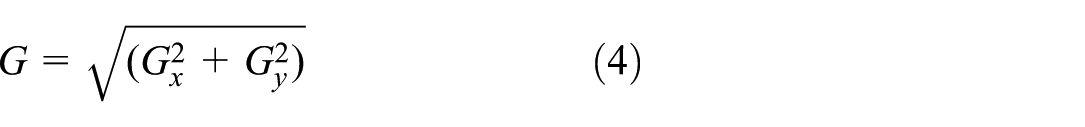
Gradient calculation
This paper uses the gradient concept in calculus to determine the image edges image by calculating the difference in pixel value changes around the pixel points to calculate the gradient intensity of an image. Assuming that
The matrix sizes of

The formula for the angle (table direction) is as follows:

Non-maximum suppression
This step involves reducing non-edges and preserving the pixel with the highest amplitude along a certain direction to obtain more accurate image edges. We traverse each pixel after obtaining the gradient size and direction to determine whether the pixel gradient size is the local maximum value in its neighborhood in the gradient direction. The specific process is shown in Figure 6: at point A on the edge, the gradient direction of A is perpendicular to the edge, and B and C are on the gradient direction of A. Therefore, A is compared with B and C to determine whether the gradient of A is a local maximum. If the gradient of A is a local maximum, then A enters the next step. Otherwise, it is determined that A is not an edge and is suppressed (set to 0).

Principle of non-maximum suppression.
Double threshold detection
We set two thresholds, Valmax and Valmin to select adaptive thresholds for different light sources and shooting environments. All pixels are traversed, and those with gradient sizes greater than Valmax are classified as “determined edge” pixels and retained. Pixels with gradient sizes smaller than Valmin are considered not to belong to the edge and are discarded. If pixels with gradient sizes between Valmin and Valmax are connected to “determined edge” pixels, they are considered part of the edge. Otherwise, they will also be discarded, as shown in the following figure.
If the horizontal line Valmax is the upper boundary required for detection, the pixels exceeding Valmax (as shown in point A in the figure) are processed as boundaries. If there is a pixel point between the horizontal line Valmax and the horizontal line Valmin (as shown in Figure 7, points B and C) and the linear curve where the pixel point is located has a boundary (i.e. point C), the pixel point is retained. The pixel is discarded when the linear curve where a pixel is located does not have a boundary (i.e. point B). If the horizontal line Valmin is the lower boundary of the detection requirement, the pixels below Valmin (as shown in point D in the figure) are discarded.

Principle of double threshold detection.
Subpixel edge extraction
Precise edge location can be obtained by calculating the edge parameters required for edge detection based on the rotation invariance of Zernike moments.
22
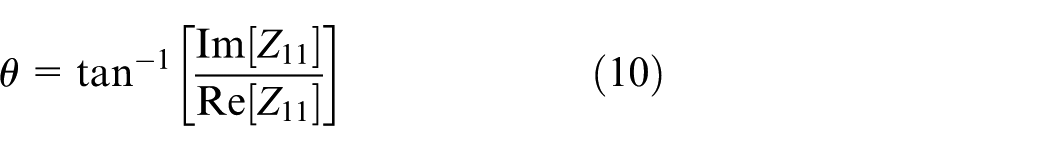
The relationship between the Zernike moment
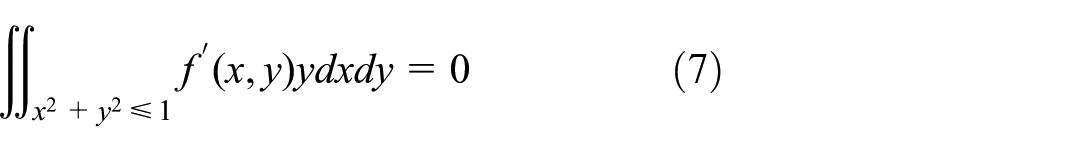
Figure 8 shows the ideal edge model. The straight-line L in the unit circle represents the ideal edge, and the grayscale values on both sides of straight-line L are h and h + k, respectively. K is the grayscale difference, l is the vertical distance from the origin to the edge, and φ is the angle between the l- and x-axes.

Ideal model for subpixel edge detection: (a) original edge image and (b) rotated edge image.
Calculating edge parameters using three Zernike moments, namely,
The following equation is obtained by maintaining moment invariance before and after rotation:

Because the image after rotation angle φ is symmetric about the x-axis, if the imaginary part

where
Morphological processing
Based on the analysis of image samples collected on site, it can be found that relatively fine textures or voids remain inside each target, which cause significant interference in subsequent target area detection.23–26 Therefore, morphological algorithms need to be used to remove the pores in binarized image targets.
The mathematical morphology includes two basic operations: corrosion and expansion. These two basic operations can be combined into various composite operations, such as open and closed operations.
Let

The overinflation operation expands boundary points outward, which can expand the boundary points of an object, merging all background points in contact with the object into that object.

Corrosion operations can remove objects smaller than structural elements and eliminate object boundary points, shrinking the boundaries inward.
The evolution of open and closed operations is based on the irreversibility of corrosion and expansion. The morphological opening and closing operations of


Open operations can eliminate small objects and smooth the boundaries of larger objects. They smooth images by eliminating isolated burrs, small points, and small bridges in images smaller than structural elements. Closed operations can fill gaps or holes smaller than structural elements, overlap short gaps, and provide connectivity.
Position labeling
Different targets can be labeled using the region labeling method for the images obtained from the above steps, and the connected pixels can be labeled with the same label to distinguish the different target connection regions. Then, the number of targets in the image can be counted, and the geometric parameters of each region can be analyzed. The specific steps are as follows:
(1) Starting from the top-left corner of the image, scan the image and add a new marker when encountering an unmarked target pixel (white pixel) P.
(2) Add the same marker when encountering pixels connected with P (i.e. with the same connecting component).
(3) The same markers are added to all the pixels connected to the marked pixels.
(4) Until all connected pixels are marked. In this way, a single connected target area is marked with the same tag.
(5) Return to step (1), search for new unmarked pixels, and repeat the above steps.
(6) The marked target image is in pseudo color, with different workpieces in different colors, as shown in Figure 9.

Multitarget size measurement results.
Therefore, the number and geometric parameters of the target workpiece can be calculated based on different markings.
Dimensional calibration
The dimensional calibration procedure directly determines the reliability of machine vision measurement. Since the proposed system is based on geometric conversion rather than learning-based regression, no training dataset is required. Instead, calibration relies on repeated acquisition of standard reference objects with known physical dimensions.
A standard calibration block with known length is placed in the same imaging plane as the measured workpiece. Multiple calibration images are acquired under identical optical conditions, and the average pixel length is used to reduce random fluctuation.
The calibration coefficient is defined as:
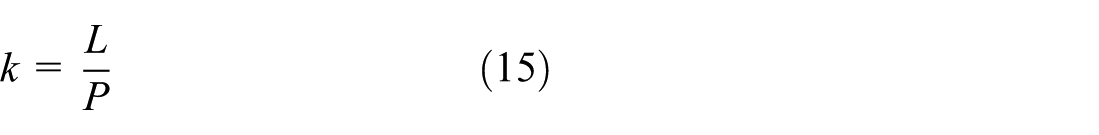
where, L is the actual physical length of the standard block, P is the corresponding pixel length, k is the physical size represented by one pixel.
After calibration, the actual dimension of the measured target is obtained by:

where, Pt is the measured pixel length of the target, M is the final physical dimension. Repeated calibration improves traceability and reduces random optical errors.
Experimental analysis
We built a testing platform and conducted experiments to verify the effectiveness of the method. The system structure is shown in Figure 10. The number of pixels for industrial cameras is 2048 × 1536, the lens is an AFT-0850ZMP, and the computer CPU is a Core (TM) i7-1185G7 @ 3.00 GHz, with 16 GB of RAM. To verify industrial applicability, two categories of test objects were selected: (1) Standard calibration blocks for dimensional reference establishment; (2) Real thin-sheet workpieces with regular geometric contours, including circular, square, triangular, diamond-shaped, and plastic industrial parts. The measurement tasks include: edge length extraction, aperture diameter measurement, contour perimeter estimation. Representative images and corresponding processing results are shown in Figures 9 to 11. For each workpiece, multiple measurements were conducted under identical imaging conditions, and the average measured value was calculated. The experimental results indicate that the dimensional values obtained by the proposed machine vision method are highly consistent with those measured by the reference instrument, with only small deviations observed within the acceptable tolerance range.

Physical structure of the measurement system.

The measurement system interface.
This experiment used a fixed-size calibration block as a benchmark and compared the lengths of parts using a micrometer to achieve verification.27–29 The calibration blocks were collected multiple times in the established image acquisition environment, and the error was reduced by taking the average value of the pixels. The thin sheet parts of different shapes were taken as the measurement objects, including shapes such as circles, squares, triangles, and diamonds.
The comparison between the measured values and the actual values of the method parameters in this article is shown in Table 1 (a bar chart comparison is shown in Figure 12). Its minimum scale is 0.1 mm. The images used are shown in the figure.
Lengths data.

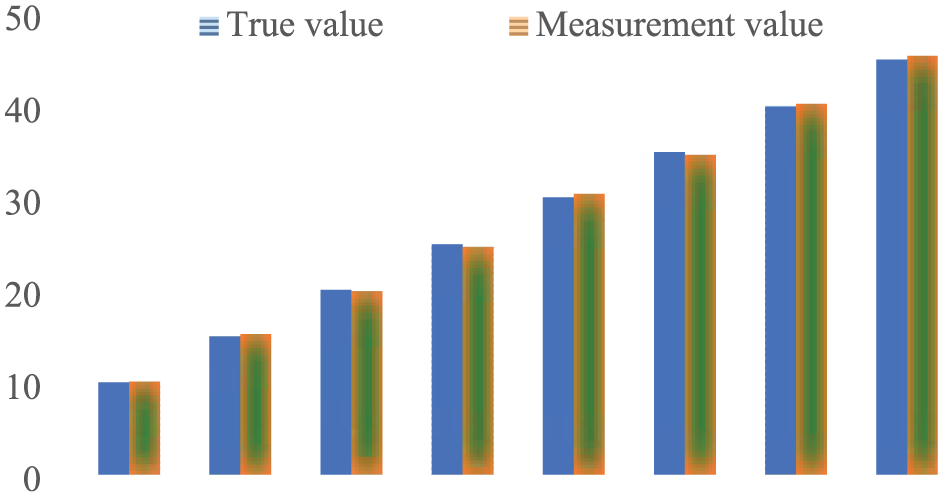
Bar chart of the measurement data.
Multi-length repeatability test
The measured objects used in this study are typical mechanical workpieces with regular geometric features commonly encountered in industrial dimensional inspection. The selected samples mainly consist of metallic components with flat surfaces, circular holes, and straight edges, which are suitable for evaluating contour extraction and dimensional calculation performance. The main measurement tasks include determining characteristic dimensions such as outer length, hole diameter, and spacing between reference features. These dimensions were selected because they represent common inspection requirements in mechanical manufacturing and allow direct comparison with conventional manual measurement methods.
We consider 8 nominal lengths, namely 10, 15, 20, 25, 30, 35, 40, and 45 mm, to comprehensively evaluate the measurement performance. For each nominal length, 20 repeated measurements are conducted in order to ensure statistical reliability and reduce random errors. Based on the acquired data, several key statistical metrics are calculated, including the mean error, standard deviation (STD), and root mean square error (RMSE), which are used to assess the accuracy and repeatability of the measurement system. The numerical results are presented in Table 1, while the corresponding visual analysis is illustrated in Figures 12 and 13, providing a clearer comparison of the measurement performance across different nominal lengths.

The mean measurement error with standard deviation versus nominal length.
The selected workpieces represent typical industrial inspection scenarios and provide practical validation for dimensional measurement under controlled laboratory conditions.
Thickness variation experiment
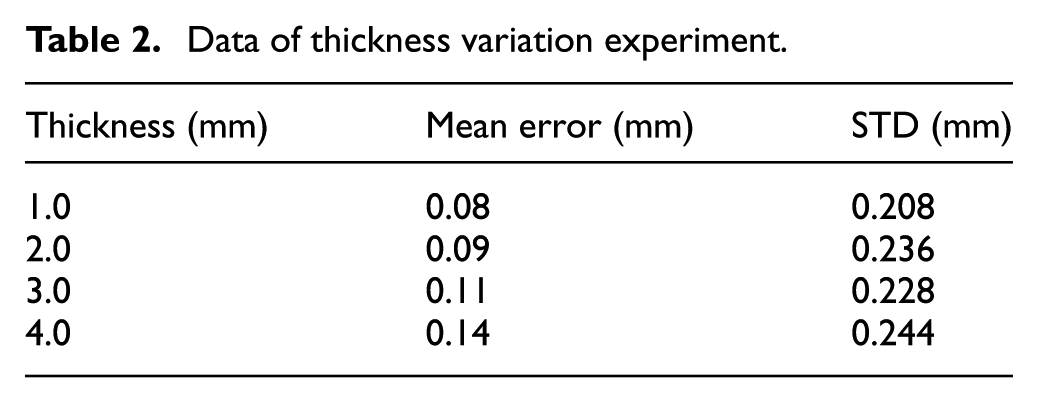
To further evaluate the influence of workpiece thickness on measurement accuracy, four thickness levels are selected for analysis. At each level, multiple measurements are performed, and the mean error along with the corresponding standard deviation is calculated. The statistical results are summarized in Table 2, while the distribution and variability of the data are visualized in Figures 14 and 15 for clearer interpretation.
Data of thickness variation experiment.

Distribution of measurements.

Mean measurement versus thickness.
From the tabulated results, it can be observed that the standard deviation of each group remains within a reasonable range, suggesting that the measurement fluctuations are controlled and the data stability is acceptable. This indicates that the measurement procedure is reliable, and the recorded data can be considered valid for further evaluation and comparison.
Accuracy analysis
The data presented in Table 1 demonstrate that the measurements obtained using the proposed method are largely consistent with those acquired through manual measurement, thereby satisfying the design requirements of the system. To further validate the accuracy and reliability of the detection system, a total of 100 plastic workpieces were randomly selected for testing. The evaluation procedure was divided into two stages. In the first stage, all samples were provided to human testers for manual inspection, during which the defective products were marked for reference. Subsequently, in the second stage, the same samples were re-examined using the developed defect detection system to conduct an objective comparison. The configuration parameters used during the automated inspection process are summarized in Table 3, which provides the basis for verifying the system’s detection capability and consistency with manual inspection results.
Basic data analysis.

Based on the information in Table 3, out of 100 samples, 96 qualified products passed machine testing, and 4 were unqualified. Compared to the data detected by the quality inspector in the early stage, the consistency rate of the test results was 100%.
Computational analysis
In addition, there are differences in the time required for machine and manual inspection, as shown in Table 4.
Comparison of machine and manual detection times.
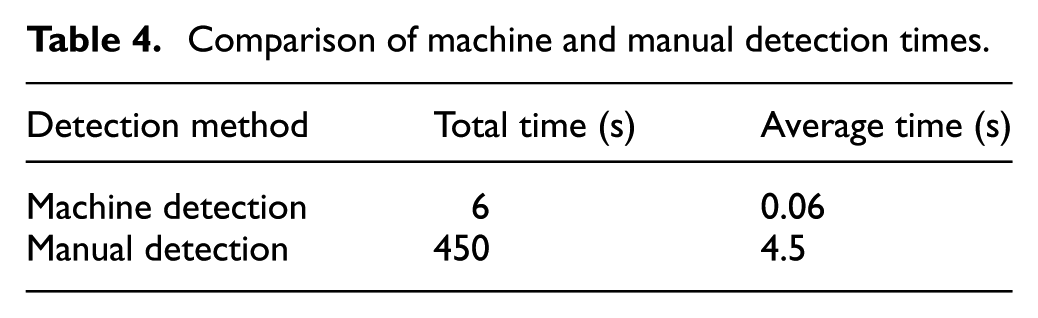
The data in Table 3 show that the average time taken by the machine vision system to detect a workpiece is 0.06 s, which is 1/75 of that of manual detection, greatly improving work efficiency.
In summary, machine vision-based measurement methods are consistent with manual measurement methods in terms of measurement accuracy; however, the measurement speed is greatly improved, meeting the system design requirements. The main reasons for these errors are as follows:
(1) Calibration error. Due to the direct impact of errors in the measurement process of standard blocks on the actual measurement accuracy, measurements can be repeated several times at regular intervals to reduce random errors in the measurement of test blocks to obtain their average value;
(2) Optical error. In actual optical systems, measurement errors are caused by the uneven field of view light intensity and external light interference, which affect the imaging quality of the charge-coupled device (CCD) and edge feature extraction. In addition, the imaging plane of the CCD camera cannot be completely parallel to the surface of the tested part, resulting in nonparallel measurement errors;
(3) The errors of the software algorithms. In measurement algorithms, the edge detection algorithm has certain errors.
Robustness discussion
The robustness of the proposed measurement method under varying material properties and operating conditions was further analyzed. In practical industrial applications, differences in surface reflectivity, texture characteristics, and illumination conditions may influence image quality and feature extraction performance. To reduce such effects, the proposed system adopts controlled illumination and grayscale preprocessing to enhance edge consistency before contour extraction. In addition, the calibration procedure is performed under fixed imaging geometry, which helps maintain measurement stability across repeated acquisitions. Although the individual image-processing methods employed in this study are based on mature machine vision techniques, the novelty of this work lies in their systematic integration into a complete multitarget dimensional measurement framework for practical industrial inspection. Compared with conventional single-object measurement studies, the proposed system emphasizes hardware-software coordination, calibration consistency, multitarget adaptability, and rapid dimensional extraction under engineering constraints. However, in more complex industrial environments involving variable illumination, vibration, or surface contamination, additional adaptive compensation strategies may be necessary, which will be further investigated in future work(as show in Table 5).
Comparison with recent machine vision-based dimensional measurement studies.

Conclusions
A machine vision-based geometric dimension measurement system for multitarget industrial workpieces has been developed in this study. The system integrates hardware design, image acquisition, calibration, subpixel edge extraction, morphological processing, and dimensional calculation into a complete noncontact inspection framework. Experimental results show that the proposed method achieves stable repeatability, high consistency with manual measurement, and significant efficiency improvement. The average inspection time per workpiece is only 0.06 s, which is substantially faster than manual inspection. The major contribution of this work lies not solely in algorithm application, but in translating conventional machine vision techniques into an integrated industrial measurement system with verified deployment feasibility.
At present, the system still relies on relatively stable illumination and sufficient target-background contrast. Future research will focus on robustness under material variations, extension to 3D machine vision measurement and deep learning-based edge extraction for complex industrial scenes.
Footnotes
Acknowledgements
We acknowledge the editors and the anonymous reviewers for insightful suggestions on this work.
Handling Editor: Chenhui Liang
Ethical considerations
This article does not contain any studies with human or animal participants. The authors confirm that all research was conducted to the highest possible ethical standards, regardless of the requirements of the local setting.
Consent to participate
Not applicable. (The study did not involve human participants).
Author contributions
Wencheng Wang wrote the initial manuscript and developed the main system. Lun Li co-wrote the manuscript, Hongtao Liu helped to design the algorithm and participate the testing. All authors reviewed the results and approved the final version of the manuscript.
Funding
The authors disclosed receipt of the following financial support for the research, authorship, and/or publication of this article: This work was supported by the Natural Science Foundation of Shandong Province (ZR2023MF047, ZR2024MA055 and ZR2023QF139), the Science and Technology Development Plan of Weifang City (no. 2025ZJ1113), the China University Industry-University-Research Innovation Foundation (nos. 2021ZYA11003 and 2021ITA05032), the Science and Technology Plan for Youth Innovation of Shandong’s Universities (no. 2019KJN012) and the National Natural Science Foundation of China (grant no. 61403283).
Declaration of conflicting interests
The authors declared no potential conflicts of interest with respect to the research, authorship, and/or publication of this article.
Data availability statement
The dataset and source code used in this research are available from the first author on reasonable request.