
Abstract
Nickel-based superalloys like Waspaloy are commonly employed in aeronautical engineering, but they are still very hard to machine using dry turning. This paper reports an experimental study on the dry turning of Waspaloy using a full factorial (33) design to assess the influence of cutting speed, feed rate, and depth of cut on cutting forces, chip temperature, surface roughness, and microhardness. The findings indicate that low feed rates and smaller cuts (ap = 0.3–0.6 mm) lead to a substantial reduction in cutting forces and improve surface quality, with surface roughness values as low as Ra ≈ 0.17 μm. Moderate thermomechanical conditions produced a maximum surface microhardness of about 797 HV. Highly accurate regression models (R2 > 0.93) were established using ANOVA, and these models can be used as very useful tools for optimizing the process. The results clearly show that acceptable surface integrity can be achieved during dry turning of Waspaloy without the use of coolants, and this provides a sustainable and industry-relevant machining approach.
Keywords
Introduction
Nickel-based superalloys are widely employed in high-performance sectors such as aerospace, power generation, and marine industries due to their exceptional strength, thermal stability, and resistance to corrosion at elevated temperatures.1–3 Among these, Waspaloy is a precipitation-hardened superalloy that exhibits excellent creep resistance, fatigue strength, and structural stability at temperatures exceeding 700 °C, making it suitable for critical components such as turbine disks, shafts, and compressor parts.4,5
Despite their superior in-service performance, nickel-based superalloys known to exhibit poor machinability. Their high strength, work-hardening behavior, and low thermal conductivity generate excessive heat, high cutting forces, and accelerated tool wear—often compromising surface integrity and dimensional accuracy.6,7 As sustainable manufacturing practices increasingly favor dry turning strategies, it becomes important to understand the machinability of such alloys under coolant-free conditions.
Waspaloy poses specific challenges due to its austenitic matrix, γ′ strengthening phase, and the presence of carbide-forming elements like Cr and Mo. These microstructural features result in strong mechanical resistance but also increase tool–material interaction forces, making tool degradation and surface damage prevalent in turning processes.8–10 In Waspaloy, this often results in poor surface finish, dimensional inaccuracies, formation of white layers, and premature tool failure.11,12
Several research papers have explored the turning characteristics of nickel-based superalloys in dry environments. Umbrello 13 studied the surface integrity of Waspaloy in dry orthogonal cutting and found considerable microstructural changes in the vicinity of the machined surface. while Isik 14 demonstrated the benefits of internally cooled tools over dry conditions. Caruso et al. 15 investigated the effects of cutting parameters on cutting forces and chip formation in dry turning of Waspaloy and emphasized the marked dependence of force components on the feed rate and depth of cut. Rinaldi et al. 16 compared various cooling methods and found that dry turning conditions lead to a substantial increase in thermal stresses compared to lubricated conditions. Furthermore, Przestacki and Chwalczuk 17 used statistical optimization methods to reduce surface roughness in dry turning of Waspaloy. Even though these studies are informative, there is a lack of comprehensive experimental research covering cutting forces, thermal issues, and surface integrity in dry turning operations. Bag et al. 18 investigated the sustainable high-speed dry turning of hardened AISI 4340 steel using multilayer CVD-coated carbide inserts. The investigation was conducted on surface roughness, flank wear, cutting temperature, and chip formation. The findings emphasized the importance of the feed rate in determining the surface finish and the effect of the cutting speed on the cutting temperature and tool wear. Mallick et al. 19 have reviewed the status of hard turning in manufacturing, with special focus on cooling methods and sustainability. The authors have made a comparative analysis of dry, MQL, cryogenic, and hybrid cooling methods based on tool wear, cutting temperature, and surface integrity.
Many of these works either focus on orthogonal cutting, involve coolant-based systems, or explore individual metrics in isolation. Moreover, recent literature emphasizes the use of computationally expensive modeling techniques like FEM or ANN, which may not be feasible in real-time industrial environments. However, despite the important findings of the previous research, there are still some research gaps. Firstly, the number of experimental studies that assess the cutting forces, thermal phenomena, and surface quality under the fully dry turning conditions of the Waspaloy alloy is still limited. Secondly, some of the existing research uses complicated simulation models or computationally intensive models that may not be easily implemented in practical industry settings.
This work is the full experimental investigation of the dry turning process of the Waspaloy alloy using a full factorial design, which takes into account various responses, such as cutting forces, chip temperature, surface roughness, and microhardness. Compared to the previous works, which focused on individual responses or simulation models, the current work provides experimentally validated and statistically robust models that can be applied directly to machining. In the current research, the integrity of the surface is assessed on the basis of experimentally measurable indicators, such as surface roughness and subsurface microhardness. These factors are acknowledged to be fundamental functional descriptors of surface integrity in dry turning of nickel-based superalloys, as they describe directly the surface topography and the strain-hardening effects caused by the thermomechanical loading during the material removal process.
Materials and methods
Workpiece material
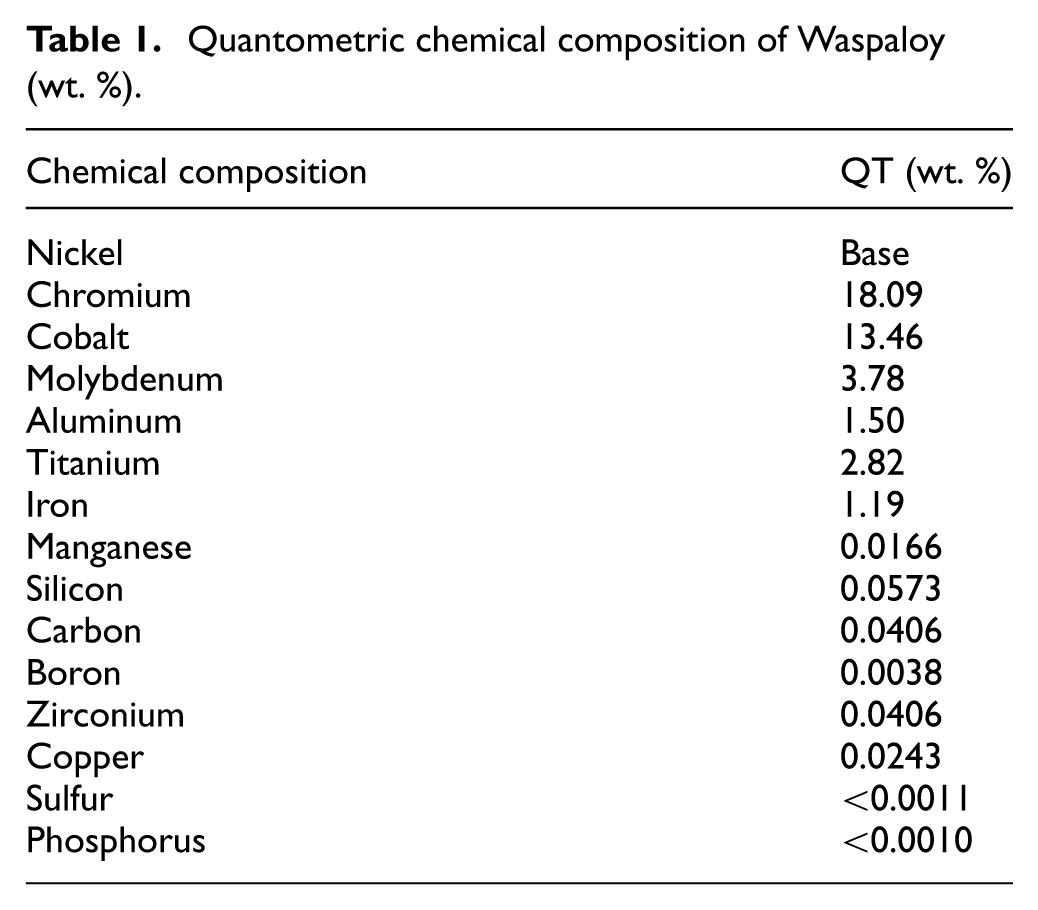
The material selected for this study was a Waspaloy cylindrical bar with a diameter of 25 mm. As specified by AMS 5708, the material underwent a series of heat treatments, including solution annealing, aging, and precipitation hardening, to promote the formation of the γ′ (Ni3(Al,Ti)) strengthening phase. 20 Initial hardness was measured at 270 ± 5 HV. Post-treatment, five randomly selected points on the surface were tested using a Vickers microhardness tester, yielding an average hardness of 385 ± 10 HV. 21 The heat treatment was conducted to attain hardness levels representative of the industrial service condition of Waspaloy components, thereby ensuring the practical relevance of the machining experiments. To determine the chemical composition of the workpiece, a quantometry test (QT) was performed. The resulting elemental distribution, shown in Table 1, confirmed that nickel was the base element, with chromium, cobalt, and molybdenum present in significant proportions.
Quantometric chemical composition of Waspaloy (wt. %).
Experimental setup and measurement systems
All turning trials were conducted on a precision Hardinge HLV-H lathe, equipped with a 1.2 kW spindle and capable of variable speeds from 125 to 3000 rpm. The machine supports feed rates ranging from 2.5 to 196 mm/min, with a tool feed resolution of 0.02 mm. Turning conditions were maintained throughout the experiments, with no coolant or lubrication applied. Cutting and thrust forces were measured using a tri-axial Kistler 9121 dynamometer, connected to a Kistler 5070 amplifier and Kistler 5697A data acquisition card. Real-time data logging and analysis were performed using DynoWare software. Prior to each trial, the system was calibrated to ensure accuracy. 22
Chip temperature was monitored using a Fluke 400TI infrared thermal camera, featuring a measurement range of −20 °C to +1200 °C and an accuracy of ±2 °C. 23 A contact thermometer was additionally utilized to validate the calibration of the infrared thermal camera. 24 To minimize variations in surface emissivity, a uniform layer of matte black gouache paint was applied to the workpiece surface. 25 Calibration was verified using a contact thermometer, and thermal imaging was analyzed via SmartView software. 23 Uncoated carbide inserts (TCMW-16-T3-04, Sandvik) without chip breakers were employed to isolate the effect of tool geometry. 26 Each experiment was conducted using a fresh cutting edge to avoid the influence of tool wear. 22 Surface roughness was measured using a TR-200 surface roughness tester, with Ra as the primary parameter. 27 Microhardness profiling was performed using a Koopa Vickers tester under a 100-g load. 22 The subsurface deformation and structural changes were observed using an OLYMPUS BX51 optical microscope. Optical microscopy was employed solely for the observation of grain structure and was not utilized for the characterization of γ′ precipitates.
To ensure the accuracy of the experimental results, the uncertainty of measurement was determined for each response variable. While determining the uncertainty of cutting forces, the accuracy of the dynamometer and the repeatability of measurements were considered. The uncertainty of the chip temperature was determined based on the accuracy of the thermal camera and the verification of its calibration. The uncertainty of surface roughness and microhardness was determined based on the repeated measurements and the standard deviation analysis. In all cases, the relative uncertainty of measurement was found to be within an acceptable range and much smaller than the variations caused by the turning parameters.
Figure 1 shows the complete experimental setup. In order to ensure the reliability of the measurement results in dry cutting, a new cutting edge was used for each experimental run. Although flank wear (VB) was not continuously monitored during the experiment, examination of the inserts after the experiment revealed negligible wear, especially at lower cutting conditions. The machining time for each test was kept short to reduce the impact of tool wear. The temperature of the chips was measured using infrared thermography. Although this method does not measure the tool–chip interface temperature, it was used to maintain a non-intrusive measurement setup. To ensure consistency in emissivity, a matte-black coating was applied to the surface of the chips, and the calibration was checked using a contact thermometer.

Experimental setup of dry turning process: (a) experimental setup, (b, c) microhardness equipment, and (d) workpiece and insert.
Experimental design
In this study, three primary turning parameters—cutting speed (Vc), feed rate (af), and depth of cut (ap)—were systematically examined to evaluate their impact on the dry turning performance of Waspaloy. Table 2 outlines the levels for each parameter used in the design. The parameter ranges listed in Table 2 were fixed considering machine tool capabilities, cutting tool limitations, material properties of Waspaloy, and relevant literature to ensure practical and stable turning conditions. A full factorial experimental design (33) was implemented, resulting in 27 unique turning conditions, as shown in Table 3. Each test was repeated three times, and the average values were used for analysis to ensure experimental consistency and reduce measurement variability. The selection of these three parameters was based on machining theory and findings from previous studies. While additional factors such as tool nose radius, rake angle, and cooling method can influence machining outcomes, they were kept constant throughout the experiments. This approach helped isolate the influence of the three main variables under investigation and allowed for a focused analysis of their effects. In the current research, optimization is the process of finding optimal ranges of turning parameters using regression models and ANOVA analysis. In this research, no metaheuristic or complex optimization algorithm was used. The regression models were used to find the ranges of parameters that can reduce cutting forces and surface roughness while ensuring optimal microhardness values.
Machining parameters and levels in the full factorial dry turning design.

Full factorial (33) experimental matrix for dry turning of Waspaloy.

To eliminate bias, all experiments were randomized prior to execution. The performance evaluation criteria were selected based on critical surface integrity measures: surface roughness (Ra) and surface microhardness (HV). Table 3 presents the full experimental matrix used during the turning trials.
Results
Turning forces
The cutting forces generated during the dry turning of Waspaloy were systematically measured using a Kistler 9121 dynamometer. This setup enabled real-time acquisition of three orthogonal force components: the cutting force (Fc), aligned with the tangential direction (Fz); the thrust force (Ff), in the axial direction (Fy); and the passive force (Fp), acting radially (Fx). Among these, the cutting and thrust forces were found to be the most sensitive to changes in process parameters. 28
“As clear from Figure 2(a), the cutting and thrust forces increase considerably with the increase in the feed rate and depth of cut at a constant cutting speed of 32 m/min, mainly due to the increase in the undeformed chip cross-sectional area. Contrary to this, Figure 2(b) shows that the increase in the cutting speed from 32 to 96 m/min at a constant feed rate of 0.035 mm/rev leads to a substantial reduction in the cutting forces, which can be ascribed to the thermal softening phenomenon in the shear zone.”

Influence of turning parameters on cutting forces: (a) variations in cutting and thrust forces at cutting speed of 32 m/min for different feed rates and depths of cut and (b) variations in cutting and thrust forces at feed rate of 0.035 mm/rev for different cutting speeds and depths of cut.
Figure 2(a) illustrates the combined effects of feed rate and depth of cut on turning forces at a constant cutting speed of 32 m/min. As the feed rate increased from 0.035 to 0.105 mm/rev, cutting force rose cumulatively by 68%, while thrust force increased by 28%. The rise in forces became more pronounced when the depth of cut increased from 0.3 to 0.9 mm, especially at higher feed rates. For instance, at a depth of cut of 0.6 mm, increasing the feed from 0.035 to 0.105 mm/rev resulted in a 123% increase in cutting force and 93% in thrust force. The rise in the cutting and thrust forces with the increase in the feed rate and depth of cut can be explained by the rise in the undeformed chip cross-sectional area, which increases the resistance to shear deformation and the contact stresses between the tool and workpiece. Additionally, the rise in the thermomechanical loading with the increase in the depth of cut increases the frictional interaction at the tool–workpiece interface. These trends can be attributed to the substantial increase in undeformed chip cross-section, which elevates chip load and contact pressure between the tool and the workpiece. 29
In addition, the elevated forces observed at higher depths of cut are linked to larger material removal volumes, which intensify the strain-hardening effect near the tool–chip interface. 30 As chip thickness and tool engagement area expand, plastic deformation becomes more significant, requiring higher cutting energy.
Figure 2(b) presents the influence of cutting speed on force reduction under constant feed rate (0.035 mm/rev) and varying depths of cut. Increasing the cutting speed from 32 to 96 m/min led to a substantial decrease in both cutting and thrust forces. For example, at a depth of cut of 0.6 mm, cutting force decreased by 63%, while thrust force dropped by 50%. This reduction is largely driven by thermal softening in the shear zone and tool–chip interface. Higher cutting speeds generate increased frictional heat, which reduces shear strength in the deformation zone, thereby lowering the energy required for chip formation. 31 The observed 63% reduction in cutting force corresponds to the combined transition from the highest feed rate and depth of cut to their lowest levels within the defined experimental range. From a cutting mechanics standpoint, reducing feed rate and depth of cut decreases the effective chip cross-sectional area and the volume of plastic deformation within the primary shear zone. As a result, the required shear flow stress and the tool–chip contact length are reduced, leading to a substantial decrease in the resultant cutting force.
At the highest cutting speed (96 m/min), thermographic measurements confirmed a significant rise in chip temperature, indicating greater heat transfer to the undeformed chip. This thermal effect further facilitated chip flow and reduced tool resistance. However, it is noteworthy that deeper cuts, even at high cutting speeds, still produce higher force levels due to the larger volume of material being sheared. 32 Finally, under the most aggressive turning conditions—high depth of cut and feed rate, coupled with the lowest cutting speed—the cutting force reached its maximum. This condition exacerbates tool wear, promotes built-up edge formation, and intensifies contact friction, all of which contribute to the observed force escalation. 33 The decrease in cutting forces with increased cutting speeds is largely related to the thermal softening of the work material in the primary shear zone. The rise in temperature causes a reduction in the flow stress, thus resulting in a decrease in the shear force required.
Statistical modeling of turning forces using Minitab
To deepen the understanding of how process parameters affect turning forces during dry turning of Waspaloy, a full factorial statistical analysis was performed using Minitab software. The cutting speed (Vc), feed rate (af), and depth of cut (ap) were evaluated as independent variables, while the cutting force (Fc) and thrust force (Ff) served as response variables. Analysis of variance (ANOVA) was employed to determine the statistical significance of each factor and their interactions. The ANOVA results (Tables 4 and 5) revealed that all three main effects (Vc, af, ap), along with their two-way and three-way interactions, significantly influenced both Fc and Ff (p < 0.0001). Among these, the depth of cut exhibited the strongest influence, particularly on Ff, as reflected by the highest F-ratio. This aligns with physical expectations, given that increasing ap directly increases the undeformed chip volume and consequently, the force required for material removal.
ANOVA results for Fc in dry turning.

Fc: cutting force.
ANOVA results for Ff in dry turning.

Ff: thrust force.
Furthermore, second-order regression models were constructed to predict the behavior of cutting and thrust forces based on input parameters. These models exhibited strong predictive performance, with R2 values of 0.95 for Fc and 0.97 for Ff, indicating excellent model fit. The fitted equations are presented as equations (1) and (2):


The form of these models provides a number of key insights. For example, the large negative coefficient of (af2) in both models indicates a decreasing marginal contribution of feed rate at higher levels. Furthermore, the interaction term (af·ap) has a large positive coefficient in both models, which verifies that a joint increase in feed and depth of cut causes a nonlinear magnification of force requirements. The presence of squared and interaction terms enables the model to capture the effects of curvature and interaction, which are of prime importance in turning superalloys like Waspaloy. These results not only confirm the experimental results but also provide a useful tool for predicting the turning behavior and optimizing process variables during dry turning. It must be pointed out that the regression coefficients are given in terms of the actual (uncoded) machining parameters. Therefore, the magnitude of the regression coefficients depends on the scaling and units of definition of the input variables. It must be noted, however, that the negative value of the quadratic coefficient is a measure of the direction of the response over the examined range of parameters. Such a statistical phenomenon does not necessarily indicate a particular physical process and, therefore, should not be attributed to an enhanced chip evacuation or other specific cutting phenomena. Tables 4 and 5 summarize the ANOVA results for Fc and Ff, respectively. The statistical significance of all terms (p < 0.05) justifies their inclusion in the final regression models. (Note. Vc in m/min, af in mm/rev, ap in mm, Fc and Ff in Newtons) Due to the high statistical power of the experimental design and the low residual variance found in the data, some model terms had very small p values. This shows that these factors are statistically significant in the tested parameter range.
Thermal behavior during turning: Analysis of chip temperature
Accurate monitoring of temperature during metal cutting operations is critical, as excessive thermal loads influence tool life, surface integrity, and material removal efficiency. 34 While the tool–chip interface is conventionally the primary focus for temperature measurements in orthogonal cutting, this study employed infrared thermography to monitor the chip temperature in oblique turning, where direct access to the shear zone is limited.
Under dry turning conditions, heat generated in the cutting zone is distributed among the tool, chip, and workpiece, with the chip often carrying away the largest share. Due to the absence of coolant in this study, the majority of thermal dissipation occurred through the chip. 35 Thermal data were acquired using a Fluke 400TI infrared camera, and the recorded temperatures were analyzed using SmartView software. The observed chip temperatures ranged from 100 °C to 350 °C, depending on the cutting parameters. It must be noted that the temperature values reported are those of the surface temperature of the removed chips as measured from the outside using infrared thermography. These values do not reflect the actual temperature at the tool–chip interface or the primary shear zone, which is normally higher due to localized plastic deformation. Thus, the value of the chip temperature measured is only an indication of the thermal load experienced during the cutting process and not the actual temperature that controls microstructural changes like dynamic recrystallization.
As shown in Figure 3(a), at a constant cutting speed of 32 m/min, chip temperature increased progressively with higher feed rates and depths of cut. For instance, at a 0.3 mm depth of cut, raising the feed from 0.035 to 0.07 mm/rev led to a 4% rise in chip temperature, while further increasing it to 0.105 mm/rev resulted in a 9% rise. At 0.6 mm depth of cut, the corresponding increases were 7%, 4%, and 8%, respectively. At 0.9 mm depth, the trend remained consistent, though minor measurement inconsistencies were resolved via interpolation from adjacent data points. These findings highlight that chip temperature is not linearly dependent on feed rate alone, but rather exhibits nonlinear amplification when both feed rate and depth of cut increase simultaneously, due to intensified tool–chip friction and increased plastic deformation in the shear zone.29,36

The influence of cutting speed, feed rate, and depth of cut on chip temperature: (a) variations in chip temperature at a cutting speed of 32 m/min for different depths of cut and feed rates and (b) variations in chip temperature at a feed rate of 0.035 mm/rev for different cutting speeds and depths of cut.
Figure 3(b) illustrates that higher cutting speeds (up to 96 m/min) substantially elevate chip temperature across all depths of cut, particularly when combined with increased feed. The sharp temperature escalation under these conditions is attributed to the higher energy input rate, reduced contact time between tool and workpiece, and limited heat dissipation under dry cutting. 37 The highest chip temperature was observed when all input parameters were at their maximum levels: Vc = 96 m/min, af = 0.105 mm/rev, ap = 0.9 mm.
Complementing these trends, Figure 4 presents infrared thermal images under various cutting conditions. A noticeable broadening and intensification of thermal hotspots is seen as depth of cut increases from 0.3 to 0.9 mm, confirming increased thermal stress in the turning zone. These thermal images further substantiate the analytical data, validating the temperature rise patterns and providing spatial resolution of heat distribution across the chip surface. Overall, the results reinforce the dominant influence of cutting speed and combined parameter effects on thermal behavior in superalloy turning. 38 Effective temperature control—especially in dry turning environments—can significantly mitigate tool wear and improve surface integrity.

Chip temperature under turning conditions at a cutting speed of 96 m/min and a feed rate of 0.035 mm/rev for varying depths of cut: (a) depth of cut 0.3 mm, (b) depth of cut 0.6 mm, and (c) depth of cut 0.9 mm.
Statistical modeling and ANOVA-based interpretation of chip temperature using Minitab
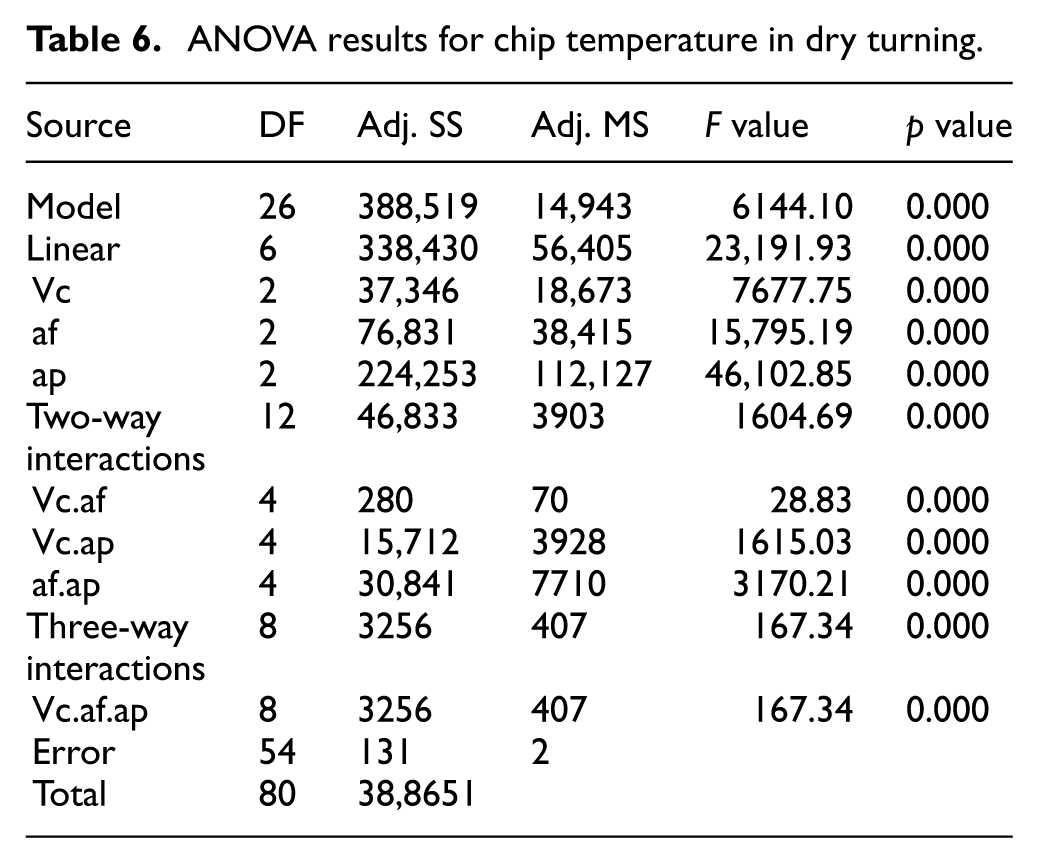
To quantitatively assess the thermal behavior during the dry turning of Waspaloy, a comprehensive statistical analysis was performed using Minitab software. A full factorial experimental design was adopted to evaluate the influence of cutting speed (Vc), feed rate (af), and depth of cut (ap) on chip temperature. The statistical significance of these input variables was determined through analysis of variance (ANOVA). The ANOVA results (Table 6) indicate that all three parameters significantly affect chip temperature, with cutting speed emerging as the most dominant factor, followed by depth of cut, and feed rate. All p values were found to be below the 0.05 significance level, confirming the statistical relevance of each parameter and their interactions. These findings are consistent with previous studies reporting the sensitivity of thermal responses in turning superalloys to cutting parameters under dry conditions.
ANOVA results for chip temperature in dry turning.
A second-order regression model was developed to predict chip temperature as a function of the three turning parameters. The regression equation is provided below:

This model achieved a coefficient of determination R2 = 0.95, indicating a high level of fit between the predicted and observed temperature values. The statistical adequacy of the model, along with a low mean square error (MSE), confirms its reliability for predictive purposes.
From a physical perspective, the positive linear coefficients of af and ap demonstrate that increasing feed rate and depth of cut contributes to greater plastic deformation and frictional contact area, thereby increasing thermal energy in the chip. The negative quadratic coefficients (af2, ap2) imply diminishing thermal returns at higher parameter values, potentially due to increased material detachment per revolution and shorter tool–chip contact time. The positive interaction term (af·ap) further confirms that simultaneous increases in feed and depth lead to nonlinear amplification of temperature.
The statistical model not only confirms empirical trends but also provides an effective predictive tool for turning parameter optimization. By enabling reliable control over chip temperature, this approach supports thermal management strategies that help to:
Reduce thermal wear on cutting tools.
Enhance surface integrity of the machined part.
Improve dimensional stability during turning of nickel-based superalloys.
Such predictive modeling is increasingly essential in Industry 4.0 frameworks, where real-time data-driven control and digital twins are becoming standard practice in advanced manufacturing environments.
Surface roughness analysis and morphological assessment
Surface roughness plays a critical role in evaluating the functional performance of machined components, especially for nickel-based superalloys such as Waspaloy. In this study, surface roughness was measured using a TR-200 contact roughness tester, focusing on the arithmetic average roughness parameter (Ra) as the primary metric. 39 Measurements were conducted at three distinct regions of the machined surface, with each test comprising five cycles over a 2.5 mm path length surface quality. 40
Figure 5(a) depicts the variation in average Ra values as a function of feed rate and depth of cut at a constant cutting speed of 32 m/min. The results clearly indicate that increasing both the feed rate and depth of cut leads to a significant degradation in surface finish. This deterioration can be attributed to the enhanced chip load and tool–workpiece interaction, which generate higher cutting forces, resulting in increased surface irregularities and tool vibration. These findings align with previous investigations into the dry turning of heat-resistant alloys. 41

Variation in surface roughness (Ra) as a function of turning parameters: (a) feed rate and depth of cut at Vc = 32 m/min and (b) cutting speed and depth of cut at af = 0.035 mm/rev.
In Figure 5(b), variations in Ra are shown under constant feed rate (0.035 mm/rev) for different cutting speeds and depths of cut. Contrary to the classical expectation that increased cutting speed improves surface finish, the results reveal that higher cutting speeds (up to 96 m/min) did not consistently enhance surface quality. This behavior is likely due to built-up edge (BUE) formation and unstable chip morphology, which are known to occur more frequently at elevated cutting speeds in nickel-based superalloys.42,43
Moreover, it was observed that surface roughness values below Ra = 0.2 µm were achievable only under optimized conditions (low feed rate and shallow cut depth), comparable to the finish obtained by precision grinding—a remarkable outcome for a turning operation without coolant. 13 The observed improvement in surface finish with lower feed rates is in line with the theoretical relationship between the feed and surface roughness in turning, wherein the geometric surface profile height reduces with the decrease in the feed rate per revolution. Additionally, the lower feed rate reduces the vibration and ensures a smooth chip formation, thus improving the surface integrity.
Figure 6 presents optical microscopy images of the machined surfaces obtained at a cutting speed of 96 m/min and depth of cut of 0.6 mm, for three different feed rates. As evident from Figure 6(a) to (c), increasing the feed rate from 0.035 to 0.105 mm/rev significantly altered the surface topography. Higher feed rates introduced pronounced feed marks, micro-ploughing effects, and the presence of severe plastic deformation zones, all of which contribute to increased Ra values. These surface features not only reduce esthetic and dimensional quality but also adversely affect fatigue resistance and mechanical integrity. Rougher surfaces promote micro-crack nucleation, facilitate corrosion pit formation, and reduce the service life of aerospace components. 44 Within the resolution capability of optical microscopy, no visible signs of thick oxide scale formation were detected on the machined surfaces. It should be emphasized that nanoscale thin oxide films cannot be definitively identified through optical microscopy and would necessitate advanced surface characterization methods for accurate evaluation.

Optical micrographs of machined surfaces at Vc = 96 m/min and ap = 0.6 mm: (a) af = 0.035 mm/rev, (b) af = 0.07 mm/rev, and (c) af = 0.105 mm/rev.
Statistical modeling and ANOVA-based interpretation of surface roughness using Minitab
A comprehensive factorial experimental design was employed to explore the influence of turning parameters on surface roughness under dry cutting conditions. The study examined three critical variables—cutting speed (Vc), feed rate (af), and depth of cut (ap)—each tested at three discrete levels. Surface roughness was the sole response variable, and Minitab was used for all statistical and modeling procedures.
The analysis of variance (ANOVA) results confirmed that all three input factors had a statistically significant effect on surface roughness (p < 0.0001). Among these, feed rate demonstrated the most pronounced influence, as indicated by the highest F-value in the linear component. Depth of cut and cutting speed also showed significant yet comparatively lesser effects. These results are consistent with established turning theory, which associates higher feed rates and depths with increased tool–workpiece interaction and thus greater surface irregularity. The detailed ANOVA summary for the surface roughness model is provided in Table 7.
ANOVA results for surface roughness (Ra) in dry turning.

To model the relationship between the process parameters and surface roughness, a second-order polynomial regression was developed. The model displayed high predictive fidelity, with an R2 of 94.14%, adjusted R2 of 93.40%, and predicted R2 of 92.42%, validating its robustness and generalization capability. The final regression equation for surface roughness (Ra) is presented in equation (4):

This formulation reveals key behavioral patterns. In particular, the large positive coefficient for af2 indicates a nonlinear amplification of roughness with increasing feed rate, potentially due to elevated vibration or chip load. The interaction term af·ap also carries significant weight, highlighting the synergistic impact when both variables are increased simultaneously. In contrast, negative coefficients for linear terms suggest that moderate levels of feed and depth may lead to improved surface finish, offering insights into potential process optimization. Overall, the derived model serves not only as a predictive tool but also provides valuable guidance for refining cutting strategies aimed at minimizing surface roughness during dry turning. 45
Microhardness
The thermomechanical loading during turning operations induces significant subsurface microstructural changes in nickel-based superalloys such as Waspaloy. In this study, microhardness was evaluated using a Vickers microhardness tester under a load of 100 g, following standard indentation procedures. Measurements were carried out across three distinct regions of each machined surface to ensure consistency and reproducibility.46–48
Figure 7 presents the average microhardness values measured at a constant cutting speed of 32 m/min, under different combinations of feed rate (0.035, 0.07, and 0.105 mm/rev) and depth of cut (0.3, 0.6, and 0.9 mm). The results revealed that microhardness values consistently increased with higher feed rates and greater depths of cut. This enhancement in hardness is attributed to severe plastic deformation (SPD) and high strain-rate conditions, which promote dynamic recrystallization (DRX) and localized grain refinement near the machined surface. 49 Notably, the maximum microhardness reached ∼475 HV, representing an increase of about 20.2% compared to the base material’s initial hardness (∼395 HV). The measured increase in microhardness values under moderate cutting conditions can be explained by the processes of severe plastic deformation and strain hardening in the near-surface layers. On the other hand, the high thermal loading levels could cause recovery or softening effects, leading to the observed nonlinearity.

Microhardness variations at cutting speed of 32 m/min with different feed rates for: (a) depth of cut 0.3 mm, (b) depth of cut 0.6 mm, and (c) depth of cut 0.9 mm.
Additionally, the formation of a white layer — a hardened, plastically deformed surface region with ultrafine grains and high dislocation density—was inferred to play a key role in this hardness increase. These microstructural transformations are commonly reported in high-speed or dry turning of Ni-based superalloys, and their presence corroborates the observed hardness elevation. While increased surface hardness can enhance wear resistance, it may also introduce adverse effects such as residual stress accumulation and brittleness, especially critical in fatigue-prone applications. Thus, understanding and optimizing the hardness gradient is essential for components subjected to cyclic loading in aerospace or high-temperature environments.42,50
Effect of cutting force on surface roughness
Surface roughness (Ra) is strongly influenced by variations in cutting force during the turning of Waspaloy. Figure 8 illustrates a clear positive correlation between cutting force and surface roughness, indicating that increased cutting forces tend to deteriorate the machined surface quality. At lower cutting force values (below 100 N), the surface roughness remained below 0.2 μm, which is comparable to finish-grinding standards. 51 However, when cutting forces exceeded 200 N, surface roughness increased significantly, sometimes surpassing 0.4 μm, reflecting a decline in surface integrity. This behavior is attributed to higher mechanical loads acting on the workpiece, which induce micro-tearing, tool vibration, and the formation of built-up edge (BUE)—all of which contribute to irregular tool–workpiece interaction and degraded surface texture. 52 Elevated cutting forces also reduce process stability, amplifying feed marks and micro-burr formation.

Influence of cutting force on surface roughness. Surface roughness increases steadily as cutting force increases beyond 100 N, highlighting the role of mechanical stress and instability in surface deterioration.
In Test No. 4, the most favorable surface roughness of 0.17 μm was obtained under a cutting force of 52 N, representing the lowest Ra among all test conditions. This optimal result was achieved under a low feed rate (0.035 mm/rev) and shallow depth of cut (0.3 mm), minimizing both energy input and tool–workpiece interaction time. Such conditions effectively mitigated stress concentration and dynamic loading, leading to a smoother finish. Statistical validation using the regression model developed in Section 3.2 confirmed that cutting force is a reliable predictor for surface quality under controlled conditions. The model achieved a correlation coefficient (R2) of 0.93, confirming its predictive strength.
Therefore, to ensure high-quality surface finish in the turning of Waspaloy, it is essential to maintain cutting forces below 100 N, particularly in applications where fatigue resistance and dimensional accuracy are critical.
Effect of cutting force and chip temperature on surface microhardness
The interrelationship among cutting force, chip temperature, and surface microhardness was comprehensively examined to elucidate their combined influence on surface integrity during the turning of Waspaloy. Figure 9 shows the microhardness values obtained from all 27 experimental trials, which indicate a non-linear relationship between the microhardness and the cutting force and chip temperature, where the values increase up to a point and then decrease after crossing a threshold level.

Relationship between cutting force, chip temperature, and surface microhardness.
At moderate levels, cutting forces between 100 and 120 N induce favorable mechanical deformation that raises dislocation density and triggers strain hardening, leading to enhanced surface hardness. 42 Likewise, chip temperatures ranging from 150 °C to 170 °C promote dynamic recrystallization, which refines the grain structure and strengthens the subsurface layer. However, excessive thermal and mechanical loading—cutting forces above 130 N or chip temperatures beyond 180 °C—cause thermal softening and diminish work hardening, resulting in reduced surface microhardness. This behavior aligns with previously observed patterns in superalloy turning.53,54 It is important to note that the temperature range considered in relation to surface microhardness (e.g. 150 °C–170 °C) is related to particular machining conditions included in the experimental design, and it does not reflect the total temperature range measured during all tests. The mentioned values are related to conditions that led to balanced thermomechanical loading in the cutting zone. The analysis of hardness changes and the potential for dynamic recrystallization is thus related to the joint action of mechanical deformation and local heating, rather than to the absolute value of the chip surface temperature.
In Test No. 22, the optimal parameter combination was obtained, corresponding to a cutting force of 109 N, a chip temperature of 164 °C, and a peak microhardness of 797 HV. These conditions promoted a balanced thermomechanical state, limiting excessive plastic flow while preventing surface degradation associated with overheating. Accordingly, within the investigated experimental domain, maintaining the cutting force in the range of 100–120 N and controlling the chip temperature between 150 °C and 170 °C is recommended to achieve favorable surface microhardness and structural stability during precision turning of Waspaloy.
Discussion
Challenges due to its high strength and poor thermal conductivity. The experimental results confirmed that both feed rate and depth of cut significantly influence the mechanical and thermal loads during turning. As expected, increasing these parameters led to higher cutting and thrust forces, primarily due to the increased undeformed chip cross-section and tool–workpiece contact area. These trends align with previous studies on high-strength alloys.26–28
Elevated forces were found to correlate with greater chip temperatures, attributed to higher plastic deformation and intensified friction at the tool–chip interface. Interestingly, increasing the cutting speed reduced cutting forces, a behavior commonly associated with thermal softening in the shear zone. This reduction, however, came at the cost of increased chip temperatures due to faster energy input rates and lower heat dissipation under dry conditions.29,30
From a surface integrity perspective, higher feed rates and depths of cut led to rougher surface finishes, while lower values yielded surface roughness levels comparable to grinding operations (Ra ≈ 0.17 µm). Microhardness also showed a nonlinear relationship with cutting conditions. Moderate thermal–mechanical loads enhanced hardness through strain hardening and dynamic recrystallization mechanisms, but excessive loads led to thermal softening, reducing subsurface strength. These observations are consistent with reported white layer formation and grain refinement in similar alloys.40,47 The resulting surface integrity can be explained in the context of thermal partitioning that takes place at the tool–workpiece interface, where a substantial amount of heat is carried away by the chip, while the rest of the heat transferred to the subsurface layer affects the strain hardening and thermal softening mechanisms.
In addition to the individual influence of machining variables, the findings indicate the existence of thermomechanical coupling in the dry turning of Waspaloy. The variables of cutting forces, chip temperature, and surface integrity are not mutually independent; rather, they are coupled by the level of plastic deformation, strain rate, and heat generation in the shear zone. This phenomenon is of particular significance in the case of precipitation-hardened nickel-based superalloys, in which strain hardening and thermal softening can occur simultaneously.
While many prior studies rely on advanced simulation tools such as finite element modeling (FEM) or artificial intelligence algorithms, the present work emphasizes a practical, shop-floor-compatible modeling approach using statistical tools (ANOVA and regression). Despite their simplicity, the developed models demonstrated high predictive accuracy (R2 > 0.93), offering a reliable basis for real-time process control and parameter selection in industrial settings.
Moreover, the use of uncoated, chip-breaker-free carbide tools under dry conditions mimics realistic challenges encountered in sustainable manufacturing. Although some limitations exist—such as the lack of embedded temperature sensors or real-time wear tracking—the study provides meaningful insights into the behavior of Waspaloy under practical turning configurations. The results contribute to the development of efficient, coolant-free strategies in turning nickel-based superalloys with minimal process modification and no dependency on expensive simulation platforms. Though the experiments were performed on Waspaloy, the chosen full factorial approach and regression modeling framework are not material type dependent. The proposed solution can be generalized to other nickel-based superalloys and other difficult-to-cut materials in dry turning operations.
The nonlinear relationship that was found between the cutting force, chip temperature, and surface microhardness values indicates the existence of a thermomechanical response range. During this range, plastic deformation mechanisms are responsible for the increased dislocation density and the possibility of grain refinement, resulting in increased hardness values. However, as the thermal input increases, recovery mechanisms and thermal softening effects may become more pronounced, thus reducing the strengthening effect. This is why the maximum microhardness values were found at moderate cutting conditions and not at the extreme levels.
Limitations and future work
While the present study provides valuable insights into the dry turning behavior of Waspaloy using statistically-driven models, several limitations should be acknowledged. First, the use of infrared thermal imaging for chip temperature measurement, while non-invasive and practical, does not capture the actual tool–chip interface temperature. Incorporating embedded thermocouples or in-situ heat sensors could offer more accurate thermal mapping in future work. Second, although a fresh cutting edge was used for each trial, detailed tool wear progression was not continuously monitored. Further investigations should explore tool life and wear mechanisms under prolonged turning conditions. Additionally, the regression-based models, while simple and effective for real-time applications, do not capture complex nonlinear interactions or microstructural evolution. Future studies may benefit from hybrid approaches that combine statistical methods with finite element modeling or machine learning techniques to achieve deeper physical insight and broader applicability.
Conclusion
This work experimentally analyzed the dry turning performance of Waspaloy with a full factorial (33) design. The analysis showed that the cutting force, chip temperature, surface roughness, and microhardness were significantly affected by the feed rate and depth of cut The use of low feed rates (0.035 mm/rev) and depths of cut (0.3–0.6 mm) was effective in reducing the cutting forces and improving the surface finish with surface roughness values as low as Ra ≈ 0.17 μm. Increasing the cutting speed was found to reduce the cutting forces due to thermal softening, but it caused an increase in the chip temperatures. The surface microhardness was nonlinear, and it reached a maximum value of about 797 HV under moderate thermomechanical loading conditions. The regression models had a high predictive accuracy (R2 > 0.93), and they were suitable for use in practical parameter determination for dry turning operations. The results clearly show that the surface integrity and process performance can be controlled in dry turning of Waspaloy without using any coolant. In general, the experimental results have formed a cause-and-effect relationship between turning parameters and thermomechanical responses, proving that the choice of parameters can directly determine the force, thermal properties, and surface quality in dry turning of Waspaloy.
Footnotes
Handling Editor: Divyam Semwal
Funding
The authors received no financial support for the research, authorship, and/or publication of this article.
Declaration of conflicting interests
The authors declared no potential conflicts of interest with respect to the research, authorship, and/or publication of this article.
Data availability statement
All data generated and analyzed during this study are derived from experimental work conducted by the authors in a laboratory setting. The datasets are available from the corresponding author upon reasonable request.