
Abstract
In this work, fatigue crack propagation tests were carried out at both macroscopic and microscopic scales. The propagation process was monitored using the digital image correlation (DIC) technique, which provided data on the fatigue crack growth rate and the unified constraint parameter Ap (a parameter can represent both geometric constraint material constraint), and the correlation between the fatigue crack propagation rate and constraint was studied. Results demonstrate that a linear relationship between the fatigue crack propagation rate and the unified constraint parameter Ap can be established for specimens at both scales, indicating a clear correlation between crack growth rate and structural constraint. Moreover, this correlation has been verified across different materials. In addition, based on the observed linear relationship, a new criterion for crack propagation was developed.
Keywords
Highlights
The relationship between the fatigue crack propagation rate and the unified constraint parameter was established experimentally.
The relationship is irrelevant to the material, the stress level, and also irrelevant to the macro or micro conditions.
Based on the relationship, a new crack propagation criterion was established.
Introduction
Fatigue is an important factor affecting the life and reliability of structures. According to statistics, more than 80% of engineering structure failures are related to fatigue.1–3 To achieve long-life and high-reliability structural design, it is necessary to conduct in-depth research on fatigue issues.
The fatigue crack propagation rate is widely considered a primary indicator of fatigue performance. In the past, people have focused their research on the fatigue crack propagation rate and obtained a series of fatigue crack propagation models. Paris et al. 4 summarized the power-law law describing the fatigue crack propagation rate, which is known as the Paris formula. To more accurately describe the fatigue crack propagation behavior, Forman et al. considered the influence of average stress on the crack propagation rate da/dN and ΔK, and proposed the Forman formula by modifying the Paris formula. 5 Paris formula and Forman formula have been widely used in macroscopic fatigue crack propagation. However, the actual fatigue crack propagation process is a multi-scale development process from micro to macro, and Paris formula and Forman formula are not applicable to describe the short crack fatigue propagation law.6,7
To this end, Deng et al. 8 investigated the fatigue crack propagation mechanism of 304 stainless steel under varying stress levels. Results indicate that short cracks exhibit significantly higher propagation rates than long cracks, accompanied by pronounced fluctuations and deceleration phenomena. This behavior is primarily impeded by grain boundaries and annealed twin boundaries, with annealed twin boundaries exhibiting the strongest crack-inhibiting effect. As stress levels increase, microstructural sensitivity diminishes, fluctuations decrease, and behavior approaches that of long cracks. Based on these findings, an effective driving force model was proposed, along with an empirical formula to describe the fatigue crack propagation behavior of short cracks. Ye et al. 9 investigated the fatigue crack propagation mechanisms of microcracks, mesoscale physical cracks, and macroscopic long cracks, proposing a multiscale fatigue crack propagation model. This model explicitly divides the entire fatigue life into the three consecutive stages mentioned above and achieves precise prediction of material fatigue failure behavior by accumulating the propagation life of each stage.
In addition, it is well known that constraint can affect the propagation of fatigue cracks. Constraint is closely related to the crack-tip stress triaxiality, and can be regarded as the resistance of a structure against plastic deformation. 10 Under small-scale yielding, the stress field at the crack tip is generally controlled by a single fracture mechanics parameter ‘KI’ or ‘J’, whereas under large-scale yielding, the relationship between ‘KI’ or ‘J’ and the stress field at the crack tip gets lost, and this phenomenon is called the loss of constraint. Generally, the constraint effect caused by crack size, specimen or structural geometry, and loading mode is referred to as geometric constraint, while the constraint effect resulting from material property mismatch is called material constraint. Geometric constraint can be further divided into in-plane constraint and out-of-plane constraint. The in-plane constraint is influenced by specimen dimensions in the direction of crack propagation, such as the length of the unbroken ligament, while the out-of-plane constraint is affected by specimen/structural dimensions in the direction parallel to the crack front, such as the specimen thickness. The loading mode can be either in-plane or out-of-plane, thus affecting both in-plane and out-of-plane constraints. Geometric constraint and material constraint are collectively referred to as unified constraint.
The influence of constraints on fatigue crack propagation has been extensively studied, yet consensus on its mechanisms remains elusive. Varfolomeev et al. 11 investigated the influence of constraints on fatigue crack propagation through experimental and numerical simulations, confirming that variations in specimen geometry significantly alter crack propagation behavior. Tong 12 argued that negative T-stress (low constraint) enlarges the plastic zone at the crack tip. This leads to a stronger crack closure effect, which in turn decelerates crack propagation. In contrast, an opposing view is held by Hutař et al.13,14 They introduced T-stress as a key parameter to quantify crack tip constraint effect, identifying variations in constraint levels as the fundamental physical mechanism underlying the pronounced differences in fatigue crack propagation rates and threshold values observed across geometries. Their work consistently associated high constraint levels with reduced fatigue crack propagation rates. Conversely, positive T-stress (high constraint) maintains or reduces the plastic zone size, resulting in a higher propagation rate. Furthermore, the specific regime in which the constraint effect is operative is also debated. Seitl and Hutař 15 and Wang et al., 16 through combined experimental and modeling approaches, concluded that constraints influence behavior both in the Paris regime and the near-threshold zone, the findings of Hutař et al. 14 suggest that the effect is confined solely to the near-threshold region.
Because the fatigue crack propagation rate is generally measured using standard specimens in laboratories 17 without considering the difference in constraint levels between actual structures and laboratory specimens,18–20 when the fatigue crack propagation rate of high-constraint specimens is used to evaluate the structural integrity of low-constraint structures, conservative or non-conservative evaluation results are obtained. To conduct a more accurate integrity assessment of structures, many researchers have carried out a lot of research in the past decades, and promoted the constraint parameters from the initial single parameter (KI, 21 CTOD, 22 J23,24) to the two-parameter (K-T, 25 J-T, 26 J-Q, 27 J-A228–30, J-TZ31–34) and three-parameter (K-T-TZ35,36, J-Q-TZ, 37 J-Q-M 38 ). With the increase in the number of constraint parameters, the characterization of the constraint effect becomes more accurate; however, it causes trouble in calculations. Furthermore, some unified constraint parameters (βT, 39 φ, 40 Ap41,42, Ad, 43 Ad*44–46) have been gradually developed. In recent researches, these unified parameters have been applied in structural integrity assessment.47–50 However, it must be pointed out that most of these parameters are focused on monotonic loading, the effect of constraints on the fatigue crack propagation still need further research, especially, a correlation between the constraint and fatigue crack propagation still needs to be established.
Recently, the authors51,52 investigated the relationship between fatigue and constraint, and based on the unified constraint parameter Ap, the correlation of the fatigue crack growth rate, creep-fatigue crack growth rate with unified constraint parameter was established separately. However, these relationships were derived from finite element simulations. The authors have long sought to experimentally validate these correlations and further apply them in practice, which is the primary motivation for the present study.
In present study, fatigue crack propagation tests were carried out at both macroscopic and microscopic scales. The main objective of this study is to experimentally validate the relationship between the fatigue crack propagation rate and the constraint at both macro and micro scales. The propagation process was monitored using the digital image correlation (DIC) technique, which provided data on the fatigue crack growth rate and the unified constraint parameter, and the correlation between the fatigue crack propagation rate and the constraint was studied.
Experimental method
Material
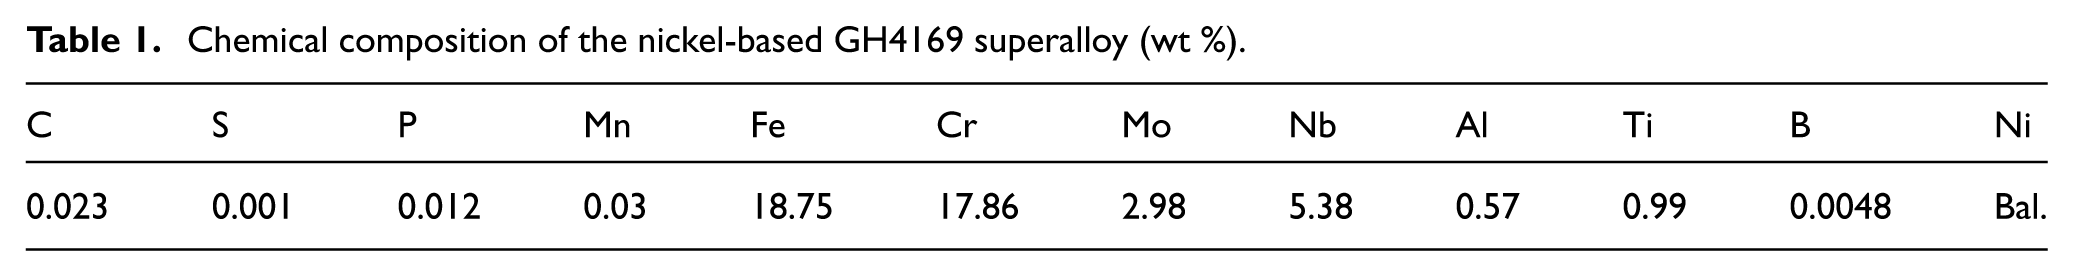
Nickel-based GH4169 superalloy were selected in this study, the chemical composition of GH4169 superalloy is listed in Table 1. The Young’s modulus of GH4169 superalloy is 216 GPa, the yield strength is 1276 MPa, the ultimate tensile strength is 1420 MPa, and the elongation is 17.52%.
Chemical composition of the nickel-based GH4169 superalloy (wt %).
Macroscopic and microscopic specimens
Both macroscopic and microscopic specimens (the initial crack lies at the macro- or micro-scale) with different constraints were used, as shown in Figure 1. For macroscopic specimens (Figure 1(a) and (b)), the constraint of the specimens was changed by varying the initial crack length (a/W = 0.2, 0.3, 0.5, 0.7, and B = 5 mm). Specimens with a/W = 0.2 and 0.3 are low-constraint specimens, while specimens with a/W = 0.5 and 0.7 are high-constraint specimens. For microscopic specimens (Figure 1(c) and (d)), the constraint of the specimens was changed by varying the specimen thickness (B = 0.5, 0.7, and 0.9 mm, a = 75 μm). Specimen with B = 0.5 mm is low-constraint specimen, while specimens with B = 0.7 and 0.9 mm are high-constraint specimens.

Schematic diagram (a) and physical image (b) of macroscopic specimen, schematic diagram (c) and physical image (d) of microscopic specimen.
For macroscopic specimens, the specimen notch is made by wire cutting, with a kerf width of 0.2 mm and a notch radius of 0.1 mm; for microscopic specimens, the specimen notch is produced by laser, with a spot diameter of 30 μm and a notch radius of 15 μm.
Fatigue crack propagation experiment
Fatigue crack propagation experiments were conducted on an INSTRON 8801 fatigue crack propagation test platform (Figure 2). For macroscopic specimens, two groups of experiments with different stress levels (maximum stress = 600 and 800 MPa, the dimensionless value of the ratio of maximum stress to yield stress is about 0.47 and 0.63, respectively) were carried out. For microscopic specimens, one group of experiments with only one stress level (maximum stress = 800 MPa) was carried out. The stress ratio was 0.1, and the cyclic waveform was sinusoidal. In addition, the strain field at the crack tip during fatigue crack propagation was measured in real-time by DIC.

Fatigue crack propagation test platform.
In this work, the VIC-3D DIC system provided by Correlated Solutions, Inc (CSI) was used. The system is equipped with a Basler ace acA4112-30 μm camera and a Schneider 50 mm lens. The camera has a resolution of 4096 × 3000 pixels, the resolution is 106.4 pixels per millimeter, and a photo is taken every 0.1 s. Such a configuration not only directly avoids the pseudo-strain errors associated with the single-camera vertical imaging in traditional 2D-DIC but also utilizes the principle of triangulation to reconstruct the three-dimensional coordinates of the sample surface. This enables accurate quantification of out-of-plane displacements and surface depressions related to the crack tip plastic zone, effectively eliminating systematic measurement errors caused by pseudo-strain and ensuring the accuracy of the experimental results.
In the DIC analysis, the selected subset size was 31 × 31 pixels, with a step size of 5 pixels and a strain window size of 13 × 13 data points. The main procedure used for applying the speckle pattern is as follows: Speckle pattern fabrication—creating artificial speckles with high grayscale contrast on the specimen. System calibration—establishing the spatial coordinate system defined by the two cameras, and determining the internal camera parameters (such as image scale, focal length, image center, lens distortion, etc.) and the external system parameters (such as stereo angle, camera spacing, distance from the cameras to the test object, etc.). Deformation acquisition—capturing clear images of the deformation process of the measured object.
For microscopic specimens, due to their small size, they cannot be effectively clamped by the built-in clamps of the fatigue testing machine. To solve this problem, the authors designed a special collet, as shown in Figure 3. These clamps are highly adaptable, capable of tightly gripping microscale specimens of various thicknesses, while also ensuring the stability of the gripping process.

The clamping state of the microscopic specimen during the test.
Experimental results
Macroscopic specimens
a - N curve of the macroscopic specimens
Figure 4 presents a comparison of the a - N curves for all macroscopic specimens under different constraints, tested at 600 and 800 MPa until fracture (the crack length was measured through the software ‘Image - J’). It can be found that with the increase of the constraint (initial crack length), the fatigue life tended to decrease, which precisely reflects the correctness of the results. At a stress level of 600 MPa (Figure 4(a)), as the a/W ratio increases from 0.3 to 0.7, the number of cycles to failure of the specimen significantly decreases from 19,279 to 7440, with the entire a - N curve exhibiting a notable leftward shift as constraint increases. At a stress level of 800 MPa (Figure 4(b)), the accumulation of fatigue damage accelerates. The fatigue life at 800 MPa was significantly lower than that at 600 MPa. The life corresponding to a/W = 0.3 is only 7255 cycles, while that at a/W = 0.7 further decreases to 3382 cycles. The change of the a - N curves at low constraints was more sensitive than that at high constraints. In the low constraint range (a/W = 0.2–0.5), the life drastically decreases with increasing constraint. In the high constraint range (a/W = 0.5–0.7), the a - N curve eventually stabilizes. It should be pointed out that at 600 MPa, the authors also conducted test on specimen with a/W = 0.2. However, due to its low constraint, the crack growth rate was extremely slow, and the crack extension was minimal, preventing the extraction of valid data.

a– N curves of the macroscopic specimens with different constraints at (a) 600 MPa and (b) 800 MPa.
Strain field at the crack tip
Figure 5 displays the evolution process of the crack tip strain (PEEQ) field during fatigue crack propagation in the macroscopic specimen with the initial crack length a/W = 0.3 at 800 MPa (the image recognition and post processing methods were used to manually identify the crack tip position of each image, and marked it by the white dot). The entire propagation process is well demonstrated. Additionally, it can be seen from Figure 5 that with the increase in the number of cycles, the crack propagation length and the crack tip strain field gradually increased and then increased rapidly before fracture. Throughout the entire propagation process, the crack deflected downward, which may be attributed to minor clearances or misalignments in the testing machine’s fixtures, pins, and connections. It should be noted that this does not affect the final result.

Evolution process of the crack tip strain field during fatigue crack propagation in the macroscopic specimen with a/W = 0.3 at 800 MPa.
The crack tip strain fields of the macroscopic specimens with different constraints at the 3000th cycle under 800 MPa are presented in Figure 6. The crack tip strain fields of the macroscopic specimens just before fracture under 800 MPa are exhibited in Figure 7. It is noticeable from Figure 6 that at the same cycle, the strain field at the crack tip increased gradually with the increase of constraint, especially for the macroscopic specimen with a/W = 0.7, the crack started to propagate. It is evident from Figure 7 that the strain field at the crack tip decreased gradually with the increase of a/W just before fracture, indicating that under a high constraint, a smaller accumulation of strain was required to cause the macroscopic specimen to fracture. Upon closer inspection, the cracks in all specimens in Figure 7 deflected downward, which may be attributed to minor clearances or misalignments in the testing machine’s fixtures, pins, and connections. However, this crack deflection is not expected to affect the conclusions drawn in this study.

Comparison of the crack tip strain fields of the macroscopic specimens with different constraints at the 3000th cycle under 800 MPa.

Comparison of the crack tip strain fields of the macroscopic specimens with different constraints just before fracture under 800 MPa.
Microscopic specimens
a - N curve of the microscopic specimens
Figure 8 shows that the a - N curves of the microscopic specimens with different constraints at 800 MPa. From the results, it can be seen that the fatigue life of the specimen with B = 0.5 mm (low constraint) is longer. While the fatigue life of the specimens with B = 0.7 and 0.9 mm (high constraint) is similar, mainly due to their similar level of crack-tip constraint. It should be noted that, likely due to the relatively high load, the crack propagated rapidly in the initial stage, and therefore the phase of microscopic crack propagation was not adequately captured.

a–N curves of the microscopic specimens with different constraints at 800 MPa.
Strain field at the crack tip
Figure 9 displays the evolution process of the crack tip strain field during fatigue crack propagation in the microscopic specimen with B = 0.7 mm. The same with macroscopic specimen, with the increase in the number of cycles, the crack propagation length and the crack tip strain field gradually increased and then increased rapidly before fracture.

Evolution process of the crack tip strain field during fatigue crack propagation in the microscopic specimen with B = 0.7 mm.
The crack tip strain fields of the microscopic specimens with different constraints (different specimen thicknesses) at the 8150th cycle are presented in Figure 10. It is noticeable from Figure 10 that at the same cycle, the strain field at the crack tip increased gradually with the increase of B, especially for the microscopic specimen with B = 0.7 and 0.9 mm, there is a significant difference with the microscopic specimen with B = 0.5 mm. The strain field at the crack tip is larger and the crack has propagated.
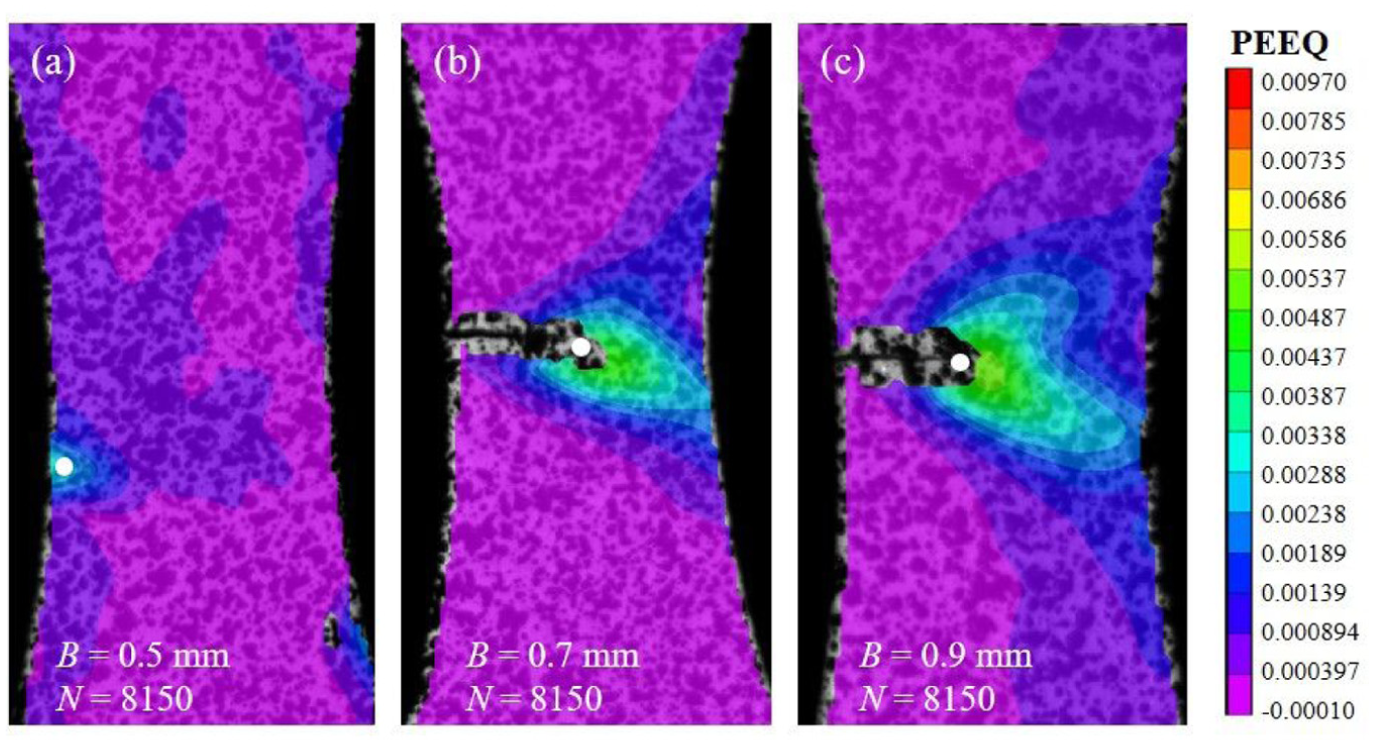
Comparison of the crack tip strain fields of the microscopic specimens with different constraints at the 8150th cycle.
The relationship between the fatigue crack propagation rate and the unified constraint parameter
Macroscopic specimens
A strain value of 0.00392 (PEEQ = 0.00392) was selected in the DIC image, and the area of the region surrounded by it was calculated to obtain the strain field area (the area was calculated through the software ‘Image - J’). In addition, the area of the region surrounded by PEEQ = 0.00392 in the specimen with a/W = 0.5 was taken as the reference value. Then, a ratio of the strain field area to the reference value at the same PEEQ (i.e. the unified constraint parameter Ap41,42) can be calculated. Ap is expressed as41,42:

Where APEEQ is the area surrounded by the PEEQ isoline ahead of the crack tip—for example, the area surrounded by PEEQ = 0.00392 isoline in different specimens; and Aref is the reference area surrounded by the PEEQ isolines in a reference specimen—for example, the area surrounded by PEEQ = 0.00392 isoline in the specimen with a/W = 0.5. The reference value of Aref corresponding to the reference specimen is given in the following figures.
It should be noted that fatigue crack propagation involves both elastic and plastic components, each playing distinct yet indispensable roles at different levels. The elastic component provides the driving force for crack propagation, while the plastic component carries out the physical process of crack advancement. For this reason, when selecting DIC images, the images corresponding to the maximum stress were consistently chosen. This approach, with the aim of accounting for both elastic and plastic deformation, also best reflects the most critical stress state of the crack. In addition, at this maximum stress point, the load is sufficiently high to fully overcome crack closure effects. Analyzing data at the maximum stress point effectively avoids interference from crack closure phenomena and allows for the acquisition of strain fields that most accurately represent the true crack tip driving force. 53
The crack propagation length can be measured from the DIC image directly, and the fatigue crack propagation rate can be calculated. The relationship between the fatigue crack propagation rate and the unified constraint parameter in each specimen was shown in Figure 11.

Linear relationship between the fatigue crack propagation rate and the unified constraint parameter for macroscopic specimens with different initial crack lengths a/W under different load level: 600 MPa (a) and 800 MPa (b).
Figure 11 shows that the fatigue crack propagation rate was approximately linearly related to
To further verify the influence of the strain value on the results, the strain values of 0.00814 and 0.0109 were selected for the specimen with a/W = 0.5 at 800 MPa to calculate Ap. The relationship between the fatigue crack propagation rate and the unified constraint parameter for different strain values is displayed in Figure 12. When different strain values were selected, the same linear relationship was detected between the fatigue crack propagation rate and the unified constraint parameter, indicating that this relationship was irrelevant to the strain value and could be flexibly selected according to the actual size of the crack tip strain field under different loading conditions and constraints.

The relationship between the fatigue crack propagation rate and the
Microscopic specimens
For microscopic specimens, a strain value of 0.00387 (PEEQ = 0.00387) was selected, the Ap values and crack propagation rates of the specimens with different constraints (different specimen thicknesses B) were also calculated, and the relationship between the fatigue crack propagation rate and the unified constraint parameter in microscopic specimens were shown in Figure 13. Figure 13 shows that the linear relationship between the fatigue crack propagation rate and the unified constraint parameter was also exist for microscopic specimens. Compared with low constraint (B = 0.5 mm), the slope of the correlation line is higher under high constraint (B = 0.7 and 0.9 mm). When B = 0.7 and 0.9 mm, the slopes of the two specimens are similar, which indicates that the constraint states of the two specimens are basically the same.
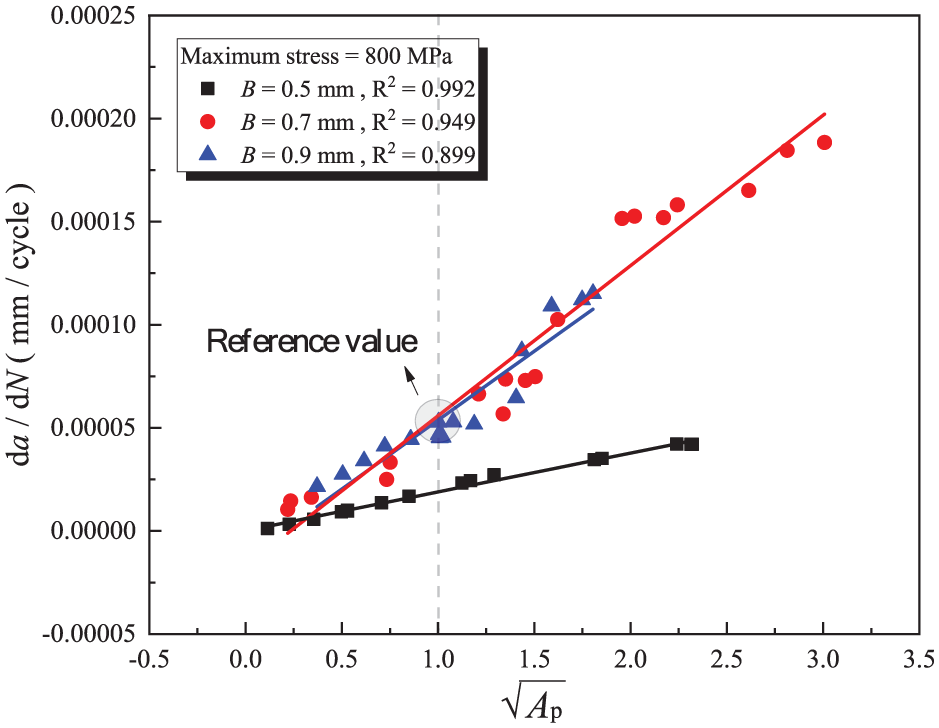
Linear relationship between the fatigue crack propagation rate and the unified constraint parameter for microscopic specimens with different specimen thicknesses B under 800 MPa.
The strain values of 0.00238, 0.00338 and 0.00387 were selected for the microscopic specimen with B = 0.5 mm to calculate Ap to verify the influence of the strain value on the results. The relationship between the fatigue crack propagation rate and the unified constraint parameter for different strain values is shown in Figure 14. The same with macroscopic specimen (Figure 12), this relationship was irrelevant to the strain value.

The relationship between the fatigue crack propagation rate and the
Overall, the linear relationship between the fatigue crack propagation rate and the unified constraint parameter exists in both macroscopic and microscopic specimens. The existence of the relationship indicates that the fatigue crack propagation rate was strongly correlated to the area of the region surrounded by the strain field ahead of the crack tip. Chikh et al. 54 tried to introduce the length of plastic zone as a mechanical parameter into the fatigue crack propagation criterion. The results of this study propound that the area of the region surrounded by the strain field ahead of the crack tip might be more suitable to be introduced as a mechanical parameter into the fatigue crack propagation criterion.
In addition, since only the initial crack is at the microscopic scale, the whole propagation remains fully continuum and geometry-controlled, without linking to local crystallography or heterogeneity, and does not address grain orientation, slip activity, phase morphology, or crack–microstructure interactions.55,56 This diverges from the traditional understanding of crack propagation at the microscopic scale.
Different materials
To further verify the applicability of the linear relationship, the relationship between the fatigue crack propagation rate and the unified constraint parameter for different materials was established based on previously available data,57–62 as shown in Figure 15. Figure 15 shows that the fatigue crack propagation rate was also approximately linearly related to the unified constraint parameter irrespective of the material. This indicates that the linear relationship is widely present and can be applied to different materials, which is helpful for its engineering applications. It should be noted that for different materials, this linear relationship exists; however, it has not yet been normalized across materials.

Linear relationship between the fatigue crack propagation rate and the
A New crack propagation criterion
Based on the correlation lines in Figures 11 and 13, the relationship between da/dN and

where c1 and c2 are parameters related material and constraint. With this criterion, during the finite element simulations, the
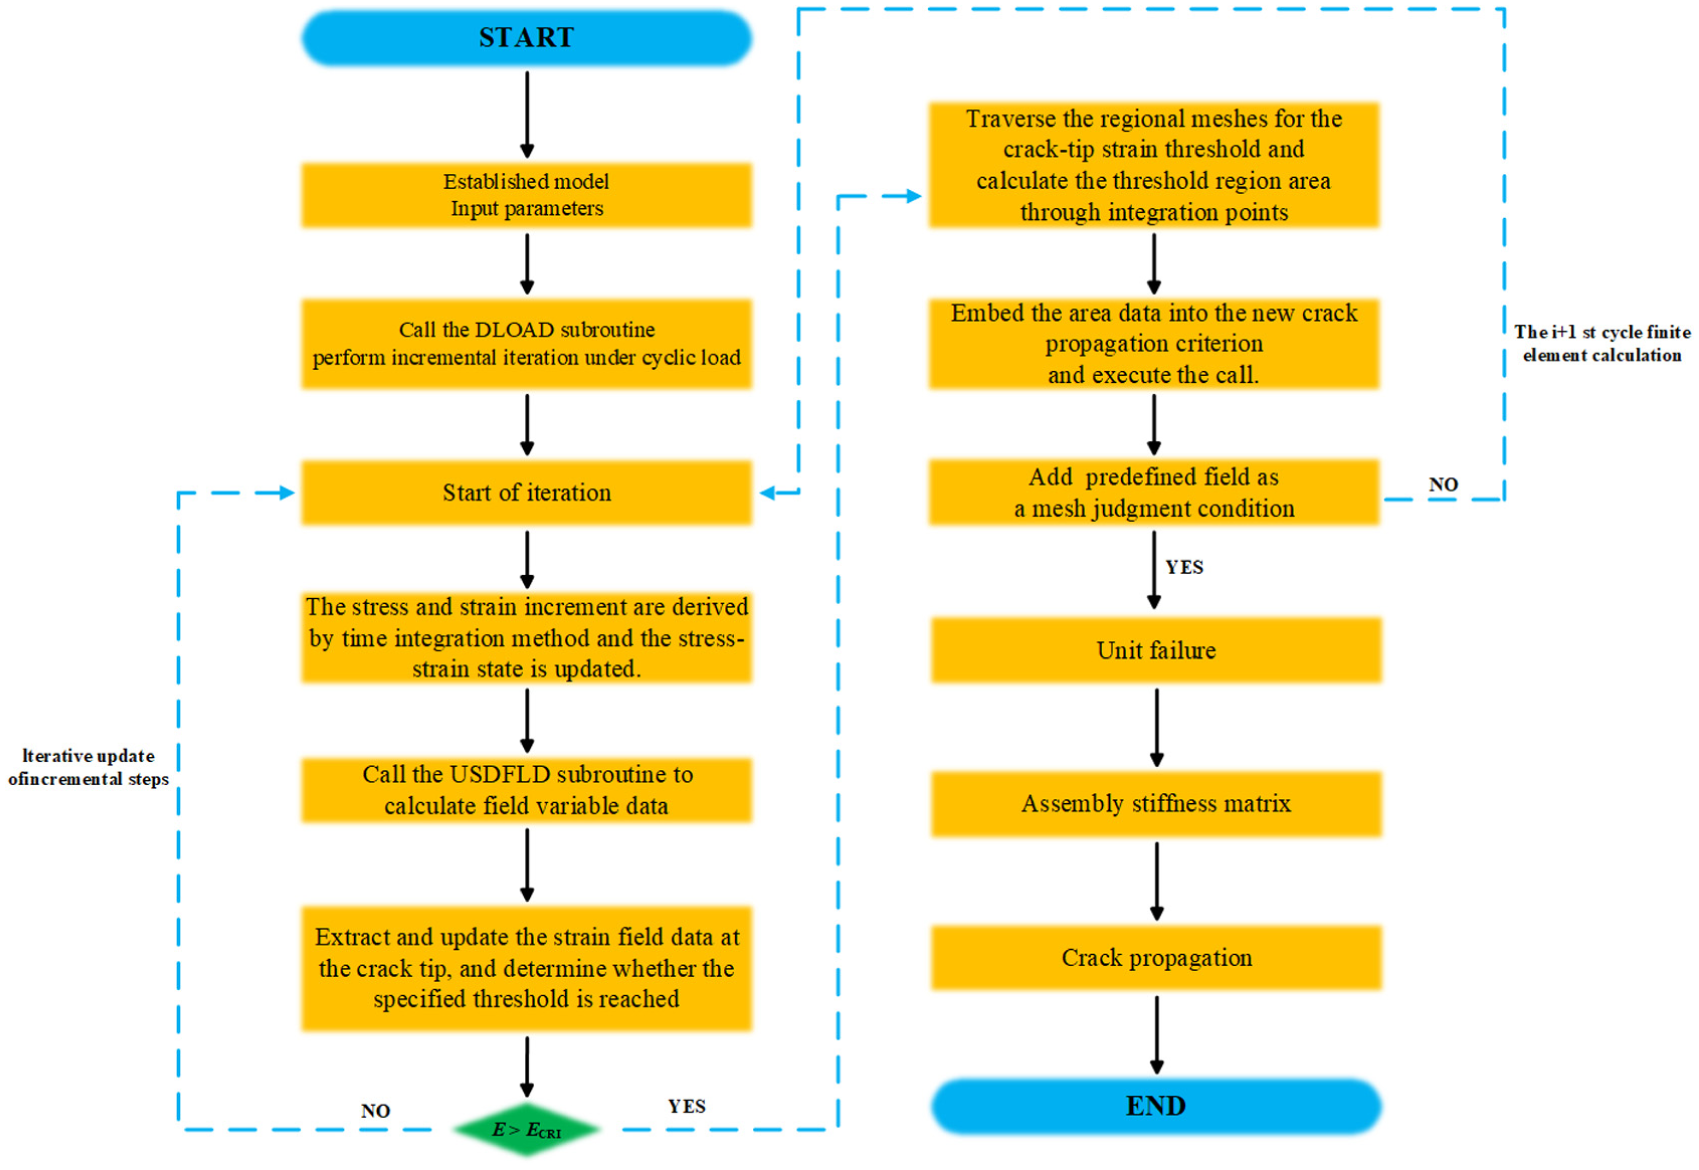
Flowchart of the new crack propagation criterion.
Specifically, the process begins by establishing a finite element model containing an initial crack and inputting key material parameters and criterion constants. Subsequently, cyclic loading is applied by invoking the DLOAD subroutine, initiating incremental iterative calculations. Within the current incremental step, the stress-strain state is updated using a time-integration method, and the USDFLD subroutine is called to compute and monitor field variable data at integration points around the crack tip in real time. Once the local PEEQ reaches a predefined critical threshold, the program accurately calculates the area of the plastic influence zone APEEQ enclosed by the threshold contour through numerical integration of the integration points. This area data is then converted into a unified constraint parameter Ap and substituted into the newly established linear criterion to determine the current crack growth rate. Finally, crack initiation and propagation are dynamically simulated by triggering element failure and reassembling the global stiffness matrix. This process is iteratively carried out in subsequent cycles until the entire fatigue propagation life and the a - N curve are predicted.
Based on this criterion, the finite element simulations of the crack propagation process were conducted for the typical macroscopic specimen with a/W = 0.5 under 800 MPa of Figure 11(b). A comparison between the tested result and the simulated result is presented in Figure 17. It can be observed that the a - N curve and crack propagation length obtained based on the new criterion are in good agreement with the tested results, which fully demonstrates that this criterion can be applied to simulate the fatigue crack propagation process.
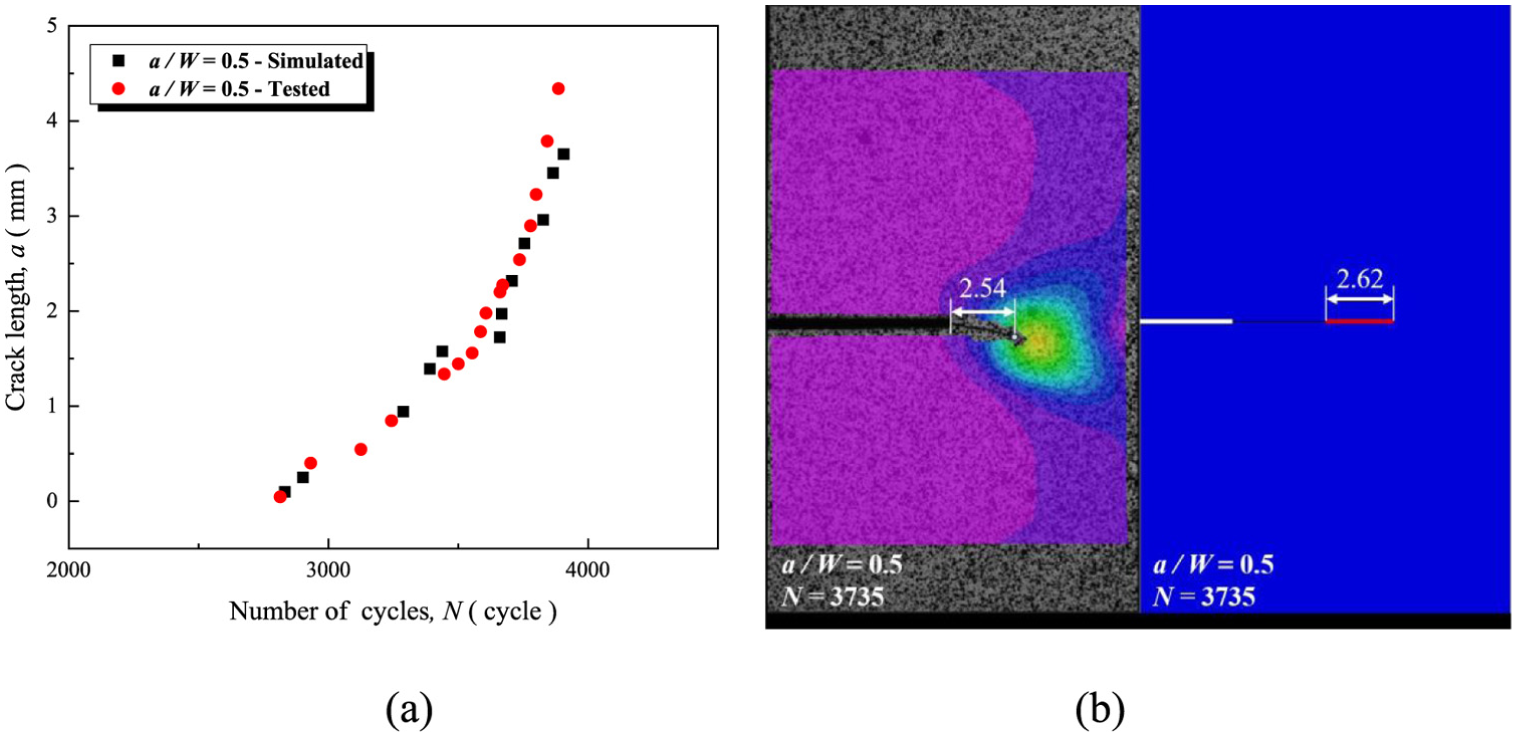
A comparison between the tested result and the simulated result: a-N curve (a) and crack propagation length at the 3735th cycle (b).
As is well known, fatigue crack growth is governed by cyclic plastic dissipation, non-proportional strain accumulation, and microstructural barriers.63,64 The lack of a physical crack-driving mechanism is a drawback of the unified constraint parameter Ap and also a shortcoming of this criterion. Nonetheless, the unified constraint parameter Ap has its advantage in that it does not require excessive consideration of details. Instead, it reflects crack propagation simply through the area surrounded by the PEEQ isoline, providing good simplification. This criterion shares the same advantage.
Furthermore, this criterion is applicable to describing the entire crack propagation process, but it still has limitations for crack propagation at the microscopic scale, which is affected by factors such as grain size, grain orientation, and slip activity. 65
In summary, this study establishes the relationship between the fatigue crack propagation rate and the constraint through experimental methods. While previous research had only demonstrated this correlation via finite element simulations—leaving some doubt regarding its reliability—the experimental approach adopted here dispels such uncertainty and provides the most direct evidence for the existence of this relationship.
Furthermore, as mentioned in the abstract, previously developed constraint parameters have primarily focused on monotonic loading. The effect of constraints on fatigue crack propagation still requires further investigation, and a correlation between constraint and fatigue crack growth has yet to be firmly established. This study represents an extension of constraint parameters into the realm of fatigue, contributing to the development of fatigue-constraint theory.
Moreover, based on the established relationship, a new crack propagation criterion has been proposed and compared with experimental results. This criterion is grounded in the plastic zone—an aspect seldom explored in prior studies. As previously noted, only a few researchers have attempted to incorporate the length of the plastic zone as a mechanical parameter into fatigue crack propagation criteria. The findings of this study suggest that the area enclosed by the strain field ahead of the crack tip is more suitable for integration as a mechanical parameter in such criteria. This insight also holds significance for the advancement of fracture mechanics. However, it should be noted that for the criterion established in equation (2), any change in parameters—such as crack length, load, or thickness—results in a new straight line, which limits its applicability. In subsequent work, geometric normalization, load normalization and material normalization must be performed to enhance the general applicability of the criterion.
Conclusions
In this study, the DIC technique was adopted to investigate the fatigue crack propagation process in both macroscopic and microscopic specimens made of GH4169 alloy under different constraints. The fatigue crack propagation rate and the area of the region surrounded by strain field were calculated, and the relationship between the fatigue crack propagation rate and the unified constraint parameter was established. The main observations of this study are presented below.
(1) The relationship between the fatigue crack propagation rate and the unified constraint parameter was established experimentally.
(2) The linearly relationship is irrelevant to the PEEQ value and can be flexibly selected according to the actual size of the crack tip strain field under different load conditions and constraints.
(3) The linear relationship is irrespective of the material and stress level, and also irrespective of the macro or micro conditions.
(4) Based on the relationship, a new crack propagation criterion was established. The a - N curves and crack propagation length obtained based on the new criterion are in good agreement with the tested results, which fully demonstrates that this criterion can be applied to simulate the fatigue crack propagation process. However, the criterion has not been standardized. For broader application, normalization in terms of geometry, loading, and materials is required.
Footnotes
Appendix
Handling Editor: Chenhui Liang
Author contributions
Funding
The authors disclosed receipt of the following financial support for the research, authorship, and/or publication of this article: This project is sponsored by National Natural Science Foundation of China (Grant No. 52375154), State Key Laboratory of Clean and Efficient Turbomachinery Power Equipment (DEC8300CG202516944A1228183).
Declaration of conflicting interests
The authors declared no potential conflicts of interest with respect to the research, authorship, and/or publication of this article.