
Abstract
Single Point Incremental Forming (SPIF) is an advanced and flexible sheet metal forming process that enables the production of complex geometries without the need for dedicated dies. This study investigates the application of SPIF to aluminum alloy AA1050-O using a novel sandwich configuration incorporating a sacrificial sheet placed above a skin sheet. The proposed configuration aims to improve surface quality, reduce thinning and minimize springback during forming. To evaluate the process, 24 full factorial design with 4 center points (L20) as implemented from the outset. A Design of Experiments (DOE) and Artificial Neural Network (ANN) approach were employed to evaluate the influence of four key process parameters; feed rate (Vf), tool diameter (Dp), vertical increment (Z), and sacrificial sheet thickness (Etm), on three critical quality responses: surface roughness (Ra), final thickness (EP), and springback (RE). Analysis of Variance (ANOVA) was conducted to identify statistically significant factors and their interactions, with the objective of simultaneously optimizing Ra, EP, and RE. The ANN model, with a 4-8-1 architecture, demonstrated excellent predictive performance, significantly outperforming the ANOVA-based models, particularly for nonlinear responses. The prediction accuracy for approaches was assessed through the coefficient of determination (R2). The results of R2 are 99.75% for the Ra, EP, and RE responses. The results confirm that the combined DOE–ANN hybrid approach provides a robust and effective framework for multi-objective optimization in SPIF process.
Keywords
Introduction
Single Point Incremental Forming (SPIF) is an innovative process for forming thin sheet metal. A sheet, usually held by a clamping device, is gradually shaped using localized deformation forces to achieve a desired geometry. 1 The deformation forces are induced by a forming tool with a hemispherical or ball end as it moves along a predefined three-dimensional toolpath.2,3 The SPIF method differs from traditional methods such as stamping, which rely on dedicated dies to impart the final shape in a single operation. 4 The SPIF advantage lies in its ability to achieve complex shapes through a sequence of small, controlled deformations, offering a high degree of flexibility in manufacturing.5,6 A key characteristic of SPIF is its reliance on computer numerical control (CNC) technology, which allows the production of intricate and customized shapes directly from digital designs without the need for dedicated and often costly tooling or dies.7,8 The process involves the incremental deformation of thin sheets into tailored geometries using a single tool whose direction can be adjusted throughout the forming operation. This adaptability in tool movement further enhances the process capability to create complex three-dimensional shapes. 9
In order to determine the optimal conditions of the SPIF process, various optimization techniques fulfill a specific objective function in different research, namely Design of Experiment (DoE), Response Surface Methodology (RSM), and Analysis of Variance (ANOVA). Parwan and Parkaj 10 used the RSM model to study the influence of SPIF process variables, including tool nose diameter, step size, spindle speed and wall angle, on microhardness (MH) and surface roughness (SR). A truncated cone shape of Inconel 625 superalloy was used. The results show that tool diameter and step size have a significant effect on MH and SR. Ritesh and Narinder 11 developed a systematic approach of RSM with Box-Behnken design to model and optimize three parameters (step depth, tool diameter, and feed rate) on surface roughness and profile accuracy. The experimental tests are conducted on a truncated cone workpiece of AA 1200 H14 aluminum alloy. The results show that the minimum value of roughness is determined by a step depth of 0.2 mm, a tool diameter of 12 mm and a feed rate of 1000 mm/min. Two models of relational gray analysis by Taguchi and RSM were developed by Meriem et al. 12 to optimize forming time, axial and radial forces, and surface roughness. Several process parameters are considered as variables, such as vertical increment, feed rate, rotational speed, lubricant, and sheet material. Thangavel et al. 13 used grayscale RSM technique to analyze the influence of process parameters, namely, ball tool diameter, step size, spindle speed, and sheet thickness, on final wall thickness, forming force, and surface roughness. The results show that the optimal tool diameter is 12 mm, the step size is 0.25 mm, the spindle speed is 2445 rpm, and the sheet thickness is 2 mm. Karim et al. 14 studied the springback and final thickness of a truncated pyramid-shaped part. A design of experiments was performed by varying the input parameters, namely the tool diameter, forming angle, sheet thickness, and tool path. An RSM model was developed to predict springback and final thickness. The developed model has a prediction error of less than 4%. Ahmed and Omar 15 developed an RSM model coupled with two metaheuristic optimization algorithms, namely the genetic algorithm (GA) and particle swarm optimization (PSO), to optimize the SPIF process. Bibek and Pankaj 16 studied the geometric accuracy and microhardness of conically formed titanium parts. The input parameters were step size, feed rate, and tool rotational speed to explore their effects on geometric accuracy (circularity and concentricity) and microhardness. Taguchi-Gray relational analyses and ANOVA were performed to quantify the impact of SPIF parameters on the responses, with the aim of simultaneously improving geometric accuracy and microhardness. The results show that the Taguchi-Gray relational analysis shows good agreement with the predicted values of the obtained responses. Ajay and Gulati 17 used the DoE and ANOVA methods to optimize input parameters to produce better surface quality for parts obtained by SPIF. The results show that the resulting predictive model exhibits superior effectiveness in producing better surface quality. Amrut et al. 18 used a design of experiment to study the effect of the parameters feed rate, step depth, tool diameter, and sheet thickness on surface roughness (Ra) and maximum forming angle (Ø max). A high-strength AA5052-H32 alloy sheet was selected for the SPIF tests. The RSM with the Box-Behnken model was used to develop a model. An ANOVA test showed that step depth and tool diameter had a significant effect on surface roughness and formability.
Recently, various techniques of Artificial Neural Network (ANN) and machine learning (ML) have been used in many research studies, including the SPIF process. Sherwen and Imer 19 used an ANN model to explore and determine suitable materials and geometry for forming tools to predict formability and geometric accuracy. A database containing 108 components formed by SPIF was used. Sudarshan et al. 20 developed an ANN model to predict surface roughness and formability. The material used was AA7075-T6 steel to deform tapered parts. The input parameters considered were annealing temperature, step depth, tool shape, and the number of cut-out blanks. Parveen and Hari 21 studied two different methodologies, namely ANN and ML, to estimate the maximum axial forces during the SPIF process. Three different models were developed: Support Vector Machine (SVM),Random Forest Regression (RFR), and ANN models. The results show that the ANN model has an accuracy of about 98% compared to other ML models. Predictive models for estimating surface roughness in the SPIF process were developed by Suresh et al. 22 A design of experiments was modeled to measure the arithmetic mean surface roughness (Ra) and the maximum peak-to-valley height (Rz). Tool diameter, step depth, wall angle, feed rate, and lubricant type were considered as input variables. However, ANN and SVR optimized by genetic algorithm were developed. The developed models performed better in predicting surface roughness with an error of 10%. Veera et al. 23 studied the deformation of grade 5 titanium materials by SPIF. The authors developed an artificial neural network (ANN) model to optimize and predict the wall angle (Ø max) and average surface roughness (Ra). The feed-forward propagation networks were used to create the (3-n-1, and 3-n-2) ANN models. The two different networks (3-n-1) and (3-n-2) present an excellent prediction result. Oraon and Sharma 24 used an artificial neural network to predict the minimum force required during SPIF deformation. Two thin sheets of aluminum alloy AA3003-O and scale brass Cu67Zn33 were used. The parameters, namely step depth, tool feed, spindle speed, wall angle, sheet thickness, and material type were considered as input variables. The results show that the optimal model structure is 6-14-1 which has a mean absolute error of −0.215. In another study, these authors 25 used an artificial neural network (ANN) to predict the surface roughness of Cu67Zn33 scale brass parts. The results show that the overall coefficient of performance of ANN modeling is acceptable, at 0.947.Alshamhan et al. 26 proposed three models: an adaptive neurofuzzy inference system (ANFIS) model, an ANN model, and a regression model to predict maximum forming force, step size, tool diameter, sheet thickness, and feed rate were considered as input parameters. The results show that the ANFIS model performs best. Luka and Tomaz 27 developed a new generalized approach that uses a Multilayer Perceptron Artificial Neural Network (MLPN) coupled with a genetic algorithm to predict and optimize thinning results. Advanced high-strength steel (AHSS) was used as the test material. The results demonstrate the effectiveness of the proposed method in minimizing sheet metal thinning. Sofien et al. 28 developed an ANN model to predict five parameters: surface roughness, thickness, springback, roundness, and location errors. The parameters: strategic toolpath, incremental step size, spindle speed, feed rate, and forming angle were selected as input factors.
Moving away from classical ANN methods, Ajay et al. 29 used machine learning (ML) and ANN techniques to predict the maximum deformation load required for deformation of AA2024 sheets by SPIF. The proposed ML model has better accuracy of 99% and the proposed ANN model produced a lower mean absolute percentage error of 4.35. Vytautas et al. 30 studied the influence of mechanical properties, process parameters and sheet thickness on maximum forming force. The authors developed an ANN model and various ML techniques to predict maximum force using the SPIF process. The results indicate that ANN and Gaussian Process Regression (GPR) provide the best prediction results. To study maximum force and surface roughness, Raneen et al. 31 developed a Gradient Boosting Regression Tree (GBRT) model for a pyramid-shaped part made of aluminum/stainless steel (Al/SUS) bimetallic sheet. To determine the optimal GBRT parameters, the authors used the grid-search cross-validation method to generate the best predicted results. Sherwan and Imre 32 developed various ML algorithms to predict SPIF process parameters of AlMn1Mg1 aluminum alloy parts. Neuron by Neuron (NBN), Gradient Boosting Regression (GBR), CatBoost, and two different MPLN structures were used and analyzed to study the effect of parameters, namely forming tool materials and shapes, tool head diameters, tool corner radius, and tool surface roughness (Ra and Rz) on response factors cushion effect, and wall diameter. The results show that the Levenberg-Marquardt learning algorithm is the most reliable method for predicting response factors. For the wall diameter factor the R2 values are 0.9645 and 0.9082 for the training and testing phases, respectively. For the cushion effect, the R2 values were 0.7506 and 0.7129 for the training and testing phases, respectively. Weining et al. 33 proposed a Radial Basis Function (RBF)-based tool path optimization algorithm to predict measured geometric accuracy, temperature, and forming force. The RBF model is coupled by the finite element (FE) model to validate the results obtained. Fernando et al. 34 proposed a predictive model based on an ML algorithm and computer vision to estimate the arithmetic mean surface roughness (Ra) and the maximum peak-to-valley height (Rz) of Ti6Al4V parts. A speeded up robust feature (SURF) detector was used to obtain a visual vocabulary, allowing the selected classification algorithms to classify the image database. These proposed models perform better in predicting the surface quality of SPIF parts. Pablo et al. 35 used the support vector machine (SVM) algorithm to predict the geometric accuracy of parts manufactured from DX51D AS120 B CO aluminized steel sheets. Different process parameters, namely; tool diameter, spindle speed, feed rate, step size, and toolpath strategies, are considered as input parameters. Five machine learning algorithms; multilayer perceptron, lasso, random forest, support vector regression, and Gaussian processes were used by Belhassen et al. 36 to predict thinning rate and vertical forming force. The SVR model performed best in predicting output factors. Yang et al. 37 proposed a long short-term memory (LSTM) model coupled with a multilayer perception network (MLP) and a model of support vector machine (SVM) to estimate the elastic return values. The proposed method presents an acceptable performance with an optimal determination coefficient (R2) of 0.9181. Muhamad et al. 38 studied the effect of tool diameter, step size, angle, tool speed, and feed rate on the surface roughness of sheet metal parts formed using SPIF. The authors developed an ML model coupled with an ANN algorithm to predict surface roughness.
In addition to using ANN and ML methods, a deep learning approach was further developed for predicting SPIF process parameters. Sofien et al. 39 developed two deep learning approaches (Deep Belief Network and Stacked Autoencoder) to predict the geometrical accuracy of AA1050-O parts deformed by SPIF. Geometrical accuracy is represented by two factors: roundness and position variation. Darren et al. 40 used a Convolutional Neural Network (CNN-FP) to predict springback error. To study springback, two different geometries were selected: one composed of untrained wall angles and the other combining various features to create a complex geometry. The CNN-FP model demonstrated excellent flexibility in predicting springback error for both shapes. It achieved a root mean square error (RMSE) of 0.381 mm at a depth of 50 mm for the untrained wall angle and an RMSE of 0.391 mm at a depth of 30 mm for the untrained complex geometry. In another research, Darren et al. 41 used a CNN network to minimize geometric error through forming path optimization. This method shows the best result for improving SPIF accuracy.
Building on this prior literature, various modeling techniques have been developed to predict the final quality of thin sheet metal parts produced by the SPIF process. Furthermore, SPIF is an innovation well-suited to cost-effective prototyping and the manufacturing of complex and customized sheet metal products. This work highlights a novel approach to the SPIF process: sandwich sheet metal deformation. However, the incremental forming process of sandwich sheets presents several challenges, such as improving the final quality factors of the parts, namely surface roughness, thinning, and springback. As previously mentioned the use and development of modeling approaches based on artificial intelligence and design of experiment offers a reliable method for optimizing manufacturing processes. ANN and ANOVA approaches were developed for optimizing the process parameters of SPIF sandwich sheets.
Materials and methods
Material and workpiece shape
The new sandwich structure consists of a sacrificial layer on a base layer. The sacrificial layer that engages with the forming die allows for a higher end face quality, reduction of thinning in the walls, reduction of tool marking, and increased dimensional accuracy along with a more even force distribution in forming. In this study, two sheets of AA1050-O were used as the skin sheet and a sacrificial sheet to produce sandwich sheets. The AA1050-O aluminum sheet boasts a high purity exceeding 99.5% and offers moderate strength with excellent formability exceptional corrosion resistance, and high ductility. It is designed for general cold sheet metal work requiring moderate strength, such as deep drawing and incremental forming. The mechanical property and chemical composition are illustrated in Tables 1 and 2. The test plates were cut from three sheets of 0.6, 0.8, and 1 mm thickness, each with dimensions of 195 mm × 195 mm. For each test, we will use sandwich sheet composed of: A sacrificial sheet with a variable thickness between 0.6, 0.8, and 1 mm, and a skin sheet with a fixed thickness of 0.8 mm. To guarantee the deformation of sandwich sheet, the process parameters feed rate (Vf), tool diameter (Dp), vertical increment (Z), and sacrificial sheet thickness (Etm), have been used (Figure 1(a)). The workpiece geometry selected was a simple truncated cone shape with a length of 35 mm and an angle of 55° (Figure 1(b)). The desired shape was deformed using a specific tool path. In this case, a helical tool path was used (Figure 1(c)).
Chemical composition of aluminum alloy AA1050-O. 42

Mechanical properties of AA1050-O.


(a) Sandwich sheet incremental forming process, (b) workpiece geometry and (c) helical tool trajectory.
Machine
The experimental tests were carried out on a three-axis HAAS CNC machine, as shown in Figure 2(a). SPIF is performed by following a precise tool path through cycles of elastoplastic deformation of the material. To ensure sheet formation, a SPIF fixture was employed with dimensions 200 mm × 200 mm, consisting of a top plate and a bottom plate connected by vertically positioned columns. Material can move easily at the beginning because of a central opening in the support plate, which helps stop any unwanted bending of the sheet, as shown in Figure 2(b). The desired tool shape for our SPIF tests was a hemispherical shape. Three punches with diameters of 10, 12, and 14 mm were used, as shown in Figure 2(c).

(a) CNC machine, (b) machined workpiece and (c) forming tool.
Measuring devices
Roughness measurement
The average surface roughness (Ra) is a widely used indicator for the surface condition of parts after deformation. The Ra value represents the arithmetic mean of the absolute deviations of a surface’s height from its mean line calculated over a specified standard length of the profile. The statistical definition of Ra commonly used to characterize surface roughness is given by equation (1):

Where
The objective of this section is to minimize Ra values while maintaining the best formability of AA1050-0 material during SPIF deformation. A surface roughness measuring instrument, Mitutoyo Surftest SJ-210, is used to measure the Ra value (Figure 3). Ra measurement samples are taken from four different locations along the interior depth of the formed sheet. The surface roughness measurements were performed using a wave cut-off filter with a short-wavelength cut-off of λs = 2.5 μm. The roughness evaluation length was defined using a cut-off length of λc = 0.8 mm, with Gaussian filtering applied over five successive sampling lengths. During the measurements, the diamond stylus traversed the surface at a constant speed of 0.5 mm/s.

Surface roughness measurement device.
Springback and thickness distribution measurement
Springback and thickness distribution present significant challenges in SPIF process. Springback is the elastic recovery of the material after forming and can lead to dimensional inaccuracies and shape deviations. During forming, the sheet metal undergoes significant plastic deformation due to the forces applied to it. This process can result in the sheet metal becoming thinner in some places than in others, which can compromise the structural integrity of the formed part. The springback and thickness distribution values were measured using a Mitutoyo LH 600 multifunction measuring device (Figure 4). The springback (RE) is measured over the entire depth of the cone. The RE value is the difference between the CAD model and the real part after deformation. The thickness distribution is measured at four different points along the same line on the outer surface of the shape cone.
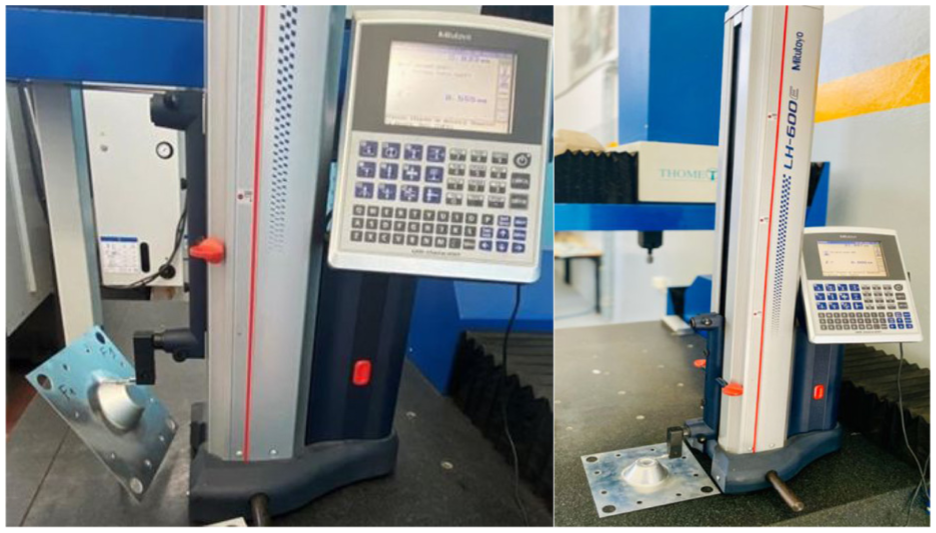
Thickness and springback measurement.
Experimental plan
Design of experiments is used to model responses based on multiple factors and facilitate the development of empirical models known. For a four-factor model (A, B, C, and D), the mathematical representation is generally a quadratic equation, as shown in equation (2):

For

The terms in equation (3) can be described as follows:
This mathematical model allows for the prediction of the response Yi for any combination of factor levels within the domain under study. The coefficients βi, βij, and βii are determined by fitting the multiple regression model to the experimental data.
In this study, the experimental design was developed using a 24 full factorial design with 4 center points, totaling 20 runs. The four investigated process factors were feed rate (Vf), vertical increment (Z), tool diameter (Dp), and sacrificial sheet thickness (Etm), each evaluated at two levels. The spindle speed was intentionally excluded from the set of optimization variables to minimize additional thermal effects—such as localized frictional heating—and to focus on the primary geometric and kinematic parameters governing the SPIF process. Consequently, the spindle speed was maintained at a constant value of 1000 rpm for all 20 experimental trials to ensure consistency and repeatability. Three key quality responses were selected to evaluate the formed parts: surface roughness (Ra), springback (RE), and thickness variation (EP). The specific levels for each input parameter are detailed in Table 3.
Process parameters and their levels.

The studied input factors and the measured responses are presented in Table 4. According to a previous section, the input factors that were examined were Vf, Z,
Plan of experiments and results.

Results and analysis
The parameters (Ra, EP, and RE) are three response factors that are the subject of this investigation. Table 4 displays the response parameters that were measured for each run of the L20 array. The optimization was carried out using ANOVA analysis to account for various performance factors. To determine an ideal set of settings for the forming process, the impact of the three response factors of the SPIF process was examined. The statistical study, including analysis of variance (ANOVA), and mathematical modeling of the experimental responses as functions of the input factors, was conducted using Minitab software to evaluate influence of each parameter on the process performance.
Modeling of surface roughness Ra
In our study, the modeling of Ra response is performed statistically utilizing the results of a comprehensive experimental investigation. This approach allows for precise and reliable quantification and understanding of roughness variations. Table 5 presents the statistical results obtained using the ANOVA method, which was employed to identify the most significant parameters influencing the Ra model. This widely used technique in variance analysis helps determine the factors that have a statistically significant impact on roughness variation considering the interactions between the different variables studied. The identified parameters will be used to refine and optimize the Ra prediction model, providing a deeper understanding of the mechanisms underlying roughness formation.
ANOVA analysis for surface roughness response (Ra).

The ANOVA method revealed the most influential parameters affecting Ra response in the studied process. The feed rate (Vf) showed a significant main effect, contributing 13.48% to the total variation. Physically, increasing the feed rate tends to deteriorate surface quality by producing deeper and more widely spaced tool marks, which results in a rougher surface profile. However, the most dominant effect arises from the interaction between feed rate and sheet thickness (Vf × Etm), with a contribution of 39.84%. This interaction indicates that the influence of Vf on Ra depends strongly on the material’s thickness. For thicker sheets, a high feed rate may generate larger forming forces, leading to increased vibrations and process instability, which in turn increases surface roughness. In contrast, thinner sheets are more prone to plastic deformation, which may partially dampen the adverse effect of feed rate. The interaction between feed rate and tool diameter (Vf × Dp), contributing 16.81%, shows that the impact of Vf on Ra response also depends on the amount of material removed per pass. At high tool diameter, the tool undergoes greater mechanical stress, amplifying surface irregularities when combined with fast feed rates. Similarly, the interaction between tool diameter and sheet thickness (Dp × Etm), with a contribution of 15.85%, suggests that process stability is influenced by the rigidity of the sheet: thin sheets combined with large vertical increment may deform more easily, leading to a rougher surface.
In contrast, the individual effects of tool diameter (Dp) and sacrificial sheet thickness (Etm) were not statistically significant. This suggests that their direct influence on Ra is limited, but they become critical in interaction with other parameters, particularly the feed rate. These findings confirm the highly interactive nature of the process and highlight the importance of considering interaction effects in any optimization effort.
The variability of Ra was divided into separate elements for each effect. The statistical significance of each effect was determined by comparing the mean square to an estimate of the experimental error. In this case, four effects had p-values less than 0.05, indicating that they were significantly different from zero at the 95% confidence level. R-squared

Linear regression analysis diagrams of the Ra response: (a) Pareto diagram, (b) interaction diagram and (c) effects diagram.
The Pareto chart shows each of the estimated effects in descending order of significance. Bars that cross the line correspond to statistically significant effects at the 95% confidence level. In this case, Vf has a significant effect. Three second-order interactions between Vf and Etm,Vf and Dp, and Dp and Etm. The effects diagram shows that the Vf has an influence on the Ra response. These statistics indicate that the model is not only well-fitted but also free from autocorrelation in the residuals. This strengthens confidence in its predictions and confirms the model’s effectiveness in explaining the variability of Ra response.
The equation for the adjusted model of surface roughness (Ra) response is as follows in equation (4).

The objective is to minimize Ra value. The optimal factor settings that achieve this minimum are presented in Table 6.The minimum surface roughness Ra obtained with these optimal factors is 1.318 µm.
Optimal factor values for Ra response.

An analysis of the response surface helped in optimizing the Ra value. The surface plots of estimated response (Ra) are giving in Figure 6.

Estimated response surfaces and corresponding contour plots for Ra response: (a) Etm-Vf interaction and (b) Dp-Vf interaction.
Modeling of springback (RE)
The Table 7 highlights both the significant and non-significant parameters, with a focus on their p-values. Six effects have p-values less than 0.05, indicating that they are significantly different from zero at the 95% confidence level. Additionally, it provides the coefficient of determination R2 and
ANOVA analysis for springback response (RE).

Statistical analysis reveals that sheet thickness (Etm) is the predominant factor influencing springback after incremental forming, with a significant contribution of 58.59%. This effect is physically explained by the increased mechanical stiffness of thicker sheets, which limits plastic deformation during forming. Consequently, upon stress release, a larger portion of deformation is recovered elastically, resulting in greater springback. Process parameter interactions also play a major role. Notably, the interaction between Dp and Z is 12.82%, shows that specific combinations of these factors alter the distribution and intensity of internal stresses. A shallow vertical increment combined with a moderate Vf promotes homogeneous deformation and controlled springback, whereas the opposite conditions may cause increased stress concentrations and amplify springback. The interaction between Z and Etm (10.46%) means springback increases when Z is large and the sacrificial sheet is thick due to higher elastic energy storage (Table 7). Thick sheets experience higher stresses at greater depths, increasing springback, while thinner sheets are more flexible, mitigating this effect. Finally, Vf has a moderate but significant effect, influencing the duration and nature of tool–material contact, which affects the proportion of elastic energy stored in the part. These findings confirm the highly interactive and complex nature of springback in incremental forming and emphasize the need to simultaneously control multiple parameters to ensure dimensional accuracy of manufactured parts.
Thick sheets experience higher stresses at greater depths, increasing springback, while thinner sheets are more flexible, mitigating this effect. Finally, Vf has a moderate but significant effect, influencing the duration and nature of tool–material contact, which affects the proportion of elastic energy stored in the part. These findings confirm the highly interactive and complex nature of springback in incremental forming and emphasize the need to simultaneously control multiple parameters to ensure dimensional accuracy of manufactured parts (Figure 7).

Linear regression analysis diagrams of the RE response: (a) Pareto diagram, (b) interaction diagram and (c) effects diagram.
Overall, these statistics indicate that the model is well-fitted and that there are no significant issues with the residuals, reinforcing confidence in the model’s predictions. The corrected model for RE response is given by the following equation (5).

The objective is to minimize RE value. The optimal factor settings that achieve this minimum are presented in Table 8. The minimum springback (RE) obtained with these optimal factors is 0.0246 mm.
Optimal factor levels.

An analysis of the response surface helped in optimizing the RE value. The surface plots of estimated response (RE) are giving in Figure 8.

Estimated response surfaces and corresponding contour plots for RE response: (a) Z-Dp interaction and (b) Etm-Z interaction.
Modeling of sheet thickness (EP)
The results of ANOVA show four effects with p-values less than 0.05, indicating that they are significantly different from zero at the 95% confidence level. The
The results obtained are presented in Table 9. The analysis of variance reveals that the final thickness (EP) is mainly influenced by Vf, Z and Etm with respective contributions of 34.1%, 22.4%, and 19.4%. A higher feed rate tends to accelerate the forming process, reducing the time available for localized deformation, which leads to a more pronounced thinning. The step depth increases the local strain applied to the sheet, thereby enhancing plastic deformation and significantly reducing the final thickness. The initial sheet thickness acts as an intrinsic resistance to thinning: thicker sheets are less prone to large reductions in thickness. Additionally, the interaction between the tool diameter and the vertical incremental (Dp × Z) shows a moderate yet significant influence, suggesting that their combined effect can locally alter the material flow during forming. Three effects have significant effects on EP values Vf, Z and Etm. The experimental results (Figure 9) show significant effects of the different parameters on the EP response.
ANOVA analysis for sheet thickness response (EP).


Linear regression analysis diagrams of the EP response: (a) Pareto diagram, (b) interactions diagram and (c) effects diagram.
Overall, these statistics indicate that the model is well-fitted and that there are no significant issues with the residuals, reinforcing confidence in the model’s predictions. The corrected model for sheet thickness (EP) is given by the following in equation (6).

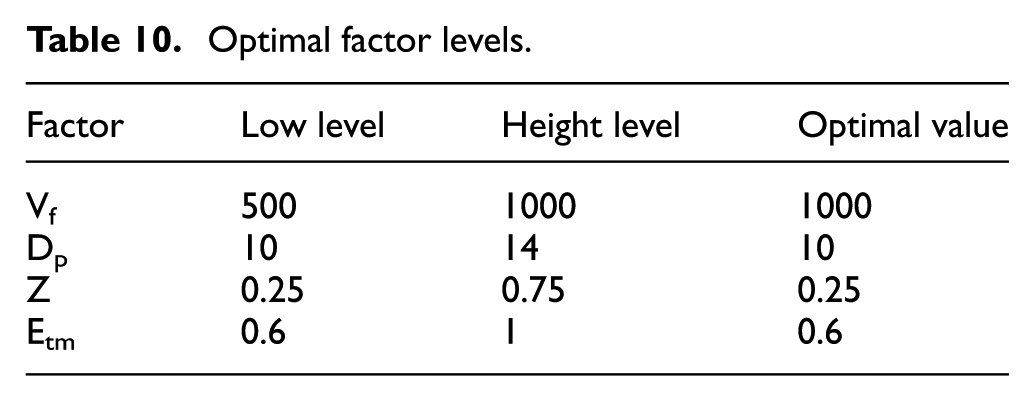
The objective is to maximize EP value. The optimal factor settings that achieve this maximum are presented in Table 10. The maximum sheet thickness (EP) obtained with these optimal factors is 0.666 mm.
Optimal factor levels.
Multi-objective optimizations of forming machining parameters
In the following, we focus on seeking an optimized compromise that allows for the simultaneous minimization of Ra and RE factors, and the maximization of EP response. The method used is the desirability function approach, a multi-objective optimization technique that combines multiple objectives into a single measure. Table 11 shows the desirability of the different trials. Trial 12 has the highest desirability of 0.7674, on the other hand, trials 9 and 13 have low desirability, which requires replications. Table 11 presents the desirability values for each trial.
Desirability of tests.

This procedure helps determine the combination of experimental factors that simultaneously optimize multiple responses by maximizing a desirability function. This procedure helps determine the combination of experimental factors that simultaneously optimize multiple responses by maximizing a desirability function. The optimal SPIF parameters, which minimize both Ra, and RE, and which maximize EP are presented in Table 12.
Optimal SPIF parameters.

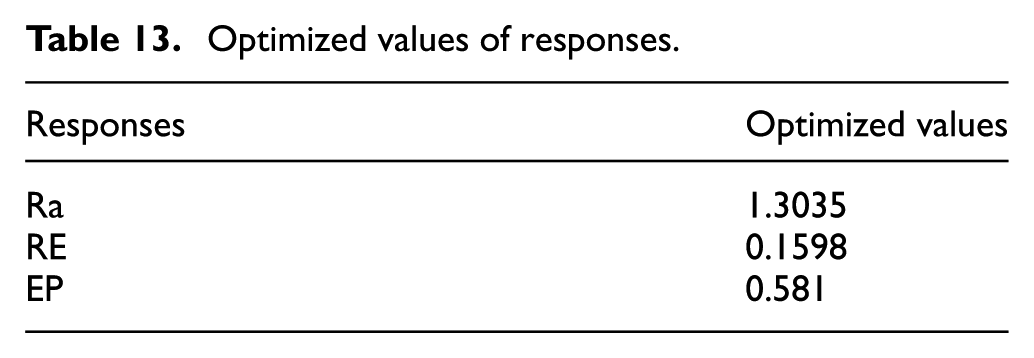
The optimized values for the Ra, RE, and EP responses are shown in Table 13. The multi-objective optimization method, which optimizes EP, Ra, and RE, gave the following results.
Optimized values of responses.
Improvement of results through an AI system
Artificial Neural Network (ANN) is an effective tool for addressing nonlinear problems in manufacturing. ANN methods learn complex correlations directly from data without the necessity of explicit mathematical models of the underlying processes.
Development of ANN model
Developing an artificial neural network (ANN) model adapted to the different performance levels of the SPIF process for composite sheets requires studying various SPIF process parameters to understand the relationship between prediction results, training model configuration, and the dataset. In our case, we chose an ANN model with three simultaneous outputs (Figure 10). The variables of the input layers (Vf, Dp, Z, and Etm) are represented by x = {x1, x2, x3, x4}, and those of the output layer (Ra, EP, and RE)—by y = {y1, y2, y3}. The hidden layer consists of {1, …, n} neurons, represented by n. Combining the outputs of several trained neural networks allows the creation of an ANN that has subnetworks operating in parallel and where the combination weights correspond to the connection weights of the output layer.
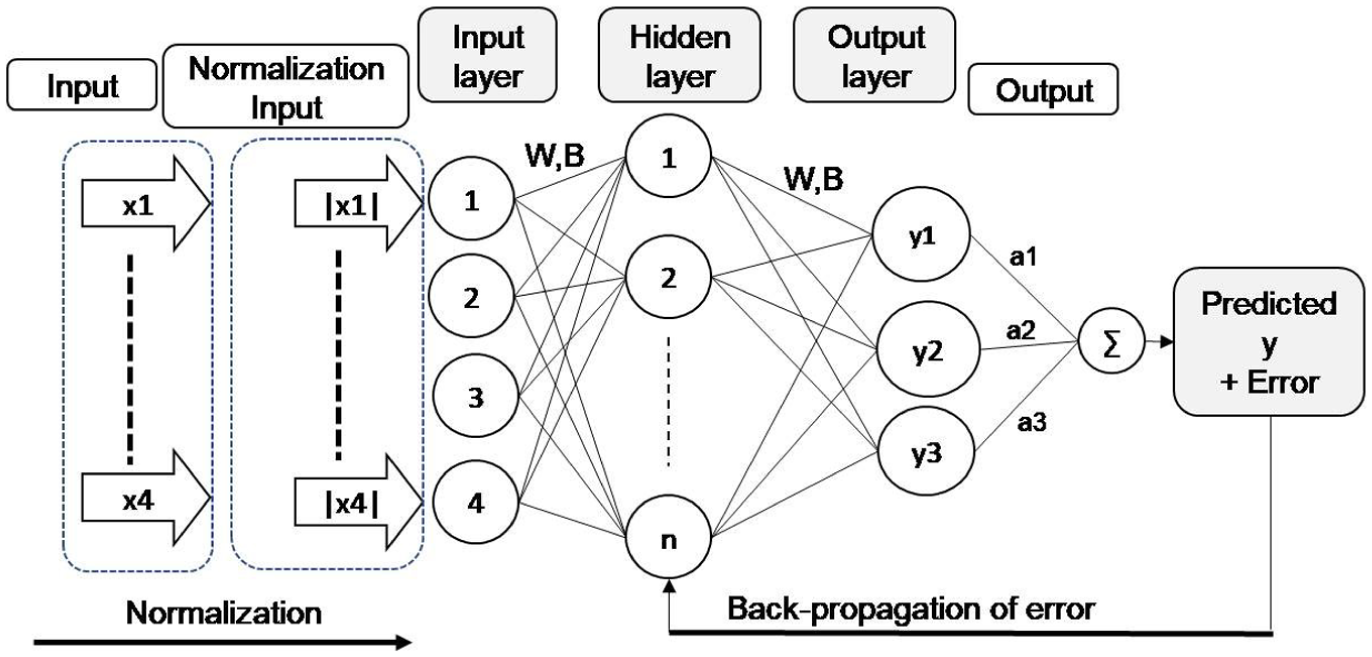
ANN architecture.
A trained ANN accepts a vector input

Where
During modeling, a procedure was adopted for the 4-n-1 topology. The database is divided into 70% for the training phase, 15% for the validation phase, and 15% for the testing phase. The data has been randomly chosen for training, validation, and test data. For training the networks, the “Levenberg-Marquardt” training algorithm was used. The Levenberg-Marquardt algorithm presents an approximate solution to nonlinear problems on several parameters. The tangent sigmoid function “Tansig” was used as the transfer function, and the pure linear function “Purelin” was used as the activation function. The ANN architecture is illustrated in Figure 10.
In order to determine the optimal architecture, the trial approach is carried out by adjusting the number of neurons in the hidden layer. The correct choice of the number of neurons helps to avoid overfitting in the case of a higher number of neurons and underfitting in the case of a lower number of neurons. The number of neurons is gradually varied from 2 to 10 in the hidden layer, and the effect on MSE and R2 is recorded for each trial.
Discussion
An artificial Neuronal Network (ANN) was used to predict the independent parameters by SPIF process, the MSE and R2 statistical criteria were applied to evaluate the capacity of model in order to obtain the best prediction results for each response. The evaluation of the proposed models and the selection of the appropriate model have been carried out. Among the five trained models, the 4-8-1 model structure shows the best performance, with the lowest MSE value and the highest R2 score for the three phases (Train, validation, and test), as shown in Figure 11. The best MSE and R2 values are observed with (8) neurons in the hidden layer.

Evaluation of MSE and R2 values in function number of neurons.
The result of the prediction error is presented in Figure 12. The total error range of the ANN model has been divided into 20 bins. The ANN model exhibits a small difference between the predicted and actual values. The error range of prediction is −0.2064 to 0.1678. About 82% of the samples in the dataset lie in the error range of −0.02914 to 0.02995. Through the obtained result, the ANN model was able to achieve significantly lower prediction error values on the training, validation and test database, which means that the developed model indicates that the developed model is capable of predicting the Ra, RE, and EP parameters of SPIF processes.
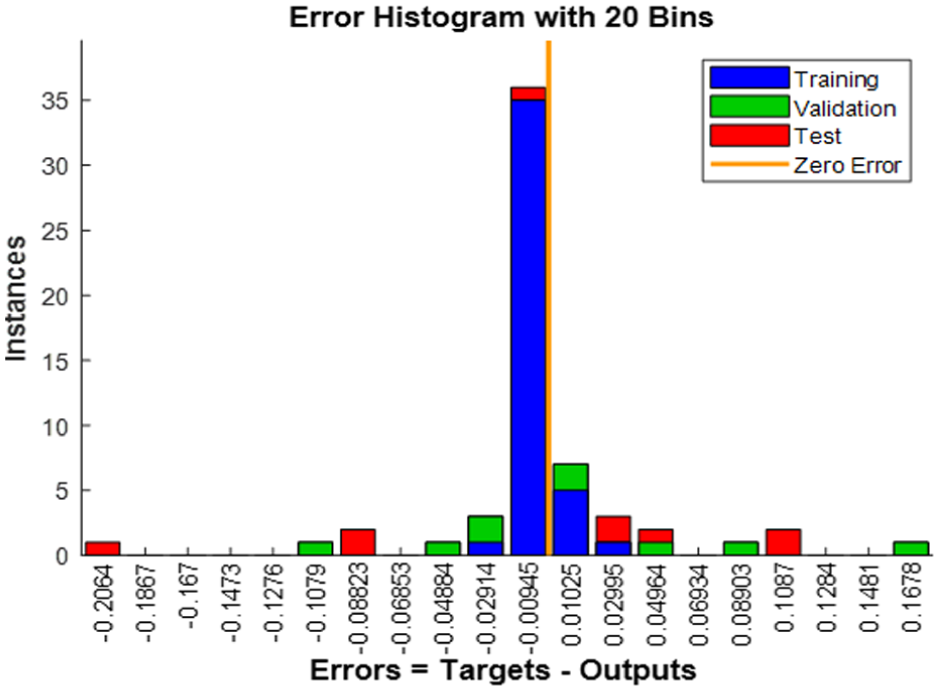
Histogram of error distribution for ANN.
Then, the (4-8-1) network exhibits minimum MSE values for training, testing and validation of 0.000463, 0.0062, and 0.0094, respectively. The R2 values closed in 1 for training, testing and validation were 0.999, 0.995, and 0.995, respectively. Based on the result ANN that used “Trainlm” training function showed the best result to predict Ra, RE, and EP values. The actual and predicted training and testing datasets of quality parts are shown in Figure 13, best model for predicting Ra, EP and RE responses.

Actual and predicted values in training, validation and, testing phases.
The R2 (train, test, validation) value of 0.99 observed on the graph is exceptionally high and roughly equal to the theoretical maximum of 1. However, values between 0.9 and 1.0 indicate that predicted and actual variables are very strongly correlated. This means an almost perfect positive linear relationship between current and predicted variables. We can therefore conclude that the level of correlation is indicative of a highly deterministic or exceptionally well modeled system.
Comparison and discussion
This study focuses on the incremental forming of sandwich sheets. The results presented are based on tests carried out on sandwich sheets. The sandwich sheet is composed of two sheets in AA1050-O (sacrificial sheet and skin sheet). However, a comparative study was presented to optimize the SPIF process parameters of sandwich sheets. The study focuses on optimizing the characteristics of sheet metal in terms of surface roughness, thickness variation, and springback. The operating factors used are feed speed, tool diameter, forming increment, and sheet thickness. However, an experimental design (L20) has been developed to analyze the interaction between operating factors as a function of response parameters.
The use of sacrificial sheets in incremental forming offers several advantages. The sacrificial sheet acts as a protective layer between the forming tool and the sheet metal. Thus, reducing unwanted marks and imperfections that could form directly on the finished sheet. In this case, an improvement in surface roughness (Ra) can be observed. This protection helps reduce surface roughness (Ra), resulting in smoother finished sheets with a better surface quality (Figure 14). Furthermore, the sacrificial sheet plays an important role in reducing springback (Figure 14). By acting as a shock absorber, the sacrificial sheet absorbs the stresses and impacts from the forming forces, which limits potential damage to the finished sheet and reduces springback (RE) value. This leads to improved dimensional stability of the finished sheets. Subsequently, a comparative analysis of two different methods for analyzing and predicting sheet metal quality was developed. The analysis of surface roughness (Ra) showed that the linear term of the parameters with the greatest impact on this response is feed rate. Subsequently, the analysis relative to thickness showed that the linear terms of the parameters having the greatest impact on this response are feed speed (Vf), vertical increment (Z), and sacrificial sheet thickness (Etm). However, the interaction has a small contribution, the tool diameter effect, so their impact on sheet thickness distribution can be neglected. Finally, the springback (RE) analysis showed that the thickness of the sacrificial sheet was present.

Ra and RE responses values in relation to sacrificial and skin sheets.
Furthermore, the mathematical models derived from relationships (2), (3), and (4) show that the difference between the response errors of the experimental model and the prediction model lies in the range (−62.98%, 187.67%; Figure 15). On the other hand, the prediction error range for surface roughness (Ra) varies between −9.8% and 8.97%. The prediction error range for thickness distribution (EP) varies between −62.98% and 187.67%. The prediction error range for RE is (−10.68%, 8.79%). These results show that correlations based on ANOVA can give values that are not very accurate compared with experimental values. The low prediction accuracy is strongly presented in the RE response.

Percent of error in ANOVA and ANN methods.
In addition, an artificial intelligence predictive model was then developed to predict SPIF responses for comparison with ANOVA results. A network structure with three outputs was chosen. The optimal ANN network structure obtained is 4-8-1.This model demonstrated excellent predictive capabilities, with R2 values around 1 and very low prediction errors for the training, validation and test sets. The predictive model shows that the difference between the percentage response errors between the experimental values and the predicted values is in the range (−14.94%, 14.29%). These results show that the correlations established from the ANN model can give values very close to experimental reality, with the error not exceeding 15%. The predicted values of ANOVA and ANN methods were presented in Table 14.
Comparison of experimental values with predicted values.

The correlation between the actual (experimental) values and the values predicted by the ANOVA and ANN models is shown in Figure 16.

Comparing predicted and actual data: (a) Ra value, (b) RE value and (c) EP value.
Conclusion
In this study, a hybrid approach integrating Design of Experiments (DoE), Analysis of Variance (ANOVA), and Artificial Neural Networks (ANN) was used for optimizing the Single Point Incremental Forming (SPIF) process parameters for deforming AA1050-O aluminum sheets. The main objective was to analyze and improve the quality of SPIF-formed parts through the minimization of surface roughness (Ra) and springback (RE), and the maximization of the final sheet thickness (EP).
Using a factorial experimental design, the effects of four important process parameters feed rate, tool diameter, vertical increment, and sheet thickness were investigated systematically. ANOVA analyses yielded statistically significant information on the individual and interactive effects of the parameters on the response variables of interest. The desirability function was also used for multi-objective optimization to determine the best parameter combination for achieving high-quality forming results.
Simultaneously, a 4-8-1 ANN model was also created to forecast Ra, RE, and EP with high accuracy. The model showcased excellent predictive capabilities, with R2values >0.99 and very low mean squared errors for training. validation, and test sets. This validates the prospects of AI-based solutions in augmenting conventional statistical techniques in simulating intricate nonlinear manufacturing processes.
The key contribution of this research is the effective combination of experimental design and artificial intelligence methods for the enhancement of the SPIF process. The results not only confirm the necessity of choosing suitable process parameters but also show that ANN models can be used to make highly dependable predictions for key quality characteristics in SPIF.
Though the results are encouraging, the research is confined to AA1050-O aluminum sheets and particular part geometry (truncated cone). Future work can involve more materials, geometries, and sophisticated optimization techniques, such as predictive model-based real-time adaptive control systems.
In summary, this thesis presents a sound methodological basis for enabling the improvement of SPIF operations’ quality and efficiency, opening up possibilities for increasingly intelligent, adaptive, and sustainable sheet metal forming processes.
Footnotes
Acknowledgements
The authors express their gratitude to ISET du Kef for the equipment provided.
Handling Editor: Aarthy Esakkiappan
Author contributions
All authors contributed to the study conception and design. Material preparation. data collection and analysis were performed by Romdhane Othmani, Sofien Akrichi, Noureddine Ben Yahia. The first draft of the manuscript was written by Romdhane Othmani and all authors commented on previous versions of the manuscript. All authorsread and approved the final manuscript.
Funding
The authors disclosed receipt of the following financial support for the research, authorship, and/or publication of this article: This work was conducted with the support and funding provided to the Unit of Mechanical Production Engineering and Materials (UGPMM/UR17ES43) and the Laboratory of Mechanical, Production, and Energy by the Ministry of Higher Education and Scientific Research.
Declaration of conflicting interests
The authors declared no potential conflicts of interest with respect to the research, authorship, and/or publication of this article.