
Abstract
This study addresses the critical safety concern of pit defects in crane booms, which occur under complex working conditions and prolonged operation, potentially leading to loss of stability and catastrophic collapse. Our research focuses on a 1200-ton all-terrain crane boom, systematically investigating how geometric pit defects affect structural integrity. We precisely quantify the extent of load-bearing capacity degradation at various defect positions and identify the locations most susceptible to the maximum weakening effect. To enable proactive maintenance, this paper proposes an advanced fault diagnosis method to address the lack of fault diagnosis approaches for crane boom pit defects based on a hybrid Particle Swarm Optimization-Backpropagation (PSO-BP) Neural Network. The model utilizes simulated data, where the PSO algorithm first efficiently searches for and optimizes the network’s thresholds and weights. These optimized parameters are then assigned to the BP neural network, creating a robust diagnostic system capable of high-precision fault identification. We conducted comprehensive experiments to investigate both single-pit and multi-pit faults at different locations on the boom. The results demonstrate the model’s exceptional performance, achieving a maximum recognition accuracy of 100% in single-pit fault scenarios, with a comprehensive accuracy of 99.02% via 5-fold cross-validation. This high level of accuracy provides a reliable and novel methodology for the practical, engineering-based fault diagnosis of cranes, enhancing operational safety and enabling timely interventions, providing a data-driven tool for predictive maintenance and reducing structural failure risks in heavy-lift operations.
Keywords
Introduction
Despite extensive research on crane stability and fault diagnosis, three critical gaps remain: (1) Few studies focus on pit defects in telescopic booms, compared to slewing mechanisms; (2) Quantitative analysis of load-bearing degradation caused by multi-pit defects is lacking; (3) Intelligent diagnosis models for boom geometric defects are rarely validated under complex fault scenarios. This study aims to identify specific positions where geometric defects significantly affect the load-bearing capacity of the boom. This analysis will offer insights for improving the production, utilization, and maintenance of crane booms, ultimately enhancing crane safety and reducing operational accidents. Additionally, as engineering machinery advances toward greater intelligence and unmanned operation,1–3 intelligent techniques are being applied to diagnose faults in crane booms. Utilizing finite element simulation methods, cranes with pit defects undergo nonlinear buckling analysis. The resultant equivalent stresses from the simulation model are subsequently fed into a Particle Swarm Optimization-BP Neural Network (PSO-BP) to intelligently classify and recognize fault data. This approach aims to effectively identify and diagnose faults in crane booms.
In the realm of crane stability research since the 1970s, scholars have focused on the buckling phenomena in shell structures subjected to axial compression. Esslinger observed that such buckling initiates at a specific point on the shell surface and propagates gradually. 4 In this context, Hühne proposed a technique involving the application of single-point perturbation loads on axially compressed cylindrical shells to induce surface defects, thereby investigating the influence of geometric imperfections on crane stability. Additionally, Hühne introduced the Single Perturbation Load Approach (SPLA) to investigate the critical buckling loads of thin-walled column-shell structures under axial compression, garnering significant attention. 5
Li et al. numerically investigate the overall stability of flexible giant crane booms, which are prone to buckling due to their slenderness and large deformations. 6 Using nonlinear finite element analysis, they account for geometric and material nonlinearities, initial imperfections, joint flexibility, and realistic loads. Both eigenvalue and nonlinear static (Riks) analyses assess buckling behavior under varying boom lengths, cross-sections, and loading conditions. The study finds that conventional design codes—often ignoring second-order effects and imperfections—can be inaccurate or overly conservative for such flexible structures. The authors recommend high-fidelity nonlinear simulations for reliable stability evaluation in crane boom design.
Xu et al. propose an efficient method to analyze the instability load of telescopic booms in all-terrain cranes. Using a co-rotational framework and 3D Euler–Bernoulli eccentric beam elements, they model geometric nonlinearity, nested section constraints, gravity, wind loads, and guy-rope preloads. 7 Internal degrees of freedom are condensed to form super-elements, enabling accurate prediction of equilibrium paths and critical buckling loads via differential governing equations. The approach captures key buckling modes and accounts for real-world factors like initial imperfections and luffing angles. Validated by numerical examples, the method offers a practical alternative to simplified stability assessments in crane design.
Towarek 8 examined the influence of flexible soil ground on the dynamic stability of jib-type cranes. He factored in variable pressure and other soil deformations during crane boom rotation, determining the impact of soil rheological deformation on crane operations through numerical solutions.
Yao et al. 9 scrutinized the torsional buckling failure of telescopic boom sections in all-terrain cranes. Under the assumption of large loads or gusty conditions, they employed implicit and explicit methods to discuss critical buckling loads derived from displacement, strain, and stress, yielding accurate conclusions for both calculation periods.
Hassan and Kurgan study the buckling of thin skew isotropic plates on a Pasternak elastic foundation using the Extended Kantorovich Method (EKM). This semi-analytical, mesh-free approach converts the governing equations into ordinary differential equations, efficiently capturing critical buckling loads under in-plane compression. The model accounts for both Winkler and shear-layer foundation stiffness, various boundary conditions, and skew angles (15°–75°). 10 Results show that higher skew angles and foundation stiffness significantly increase buckling resistance. The method’s accuracy is validated against literature and finite element results, offering an efficient tool for stability analysis in engineering applications.
Zhang and Yu present a data-driven method for predicting tower crane faults using real-time sensor data and machine learning, primarily Support Vector Machine (SVM). By analyzing signals like load, vibration, and current, the model identifies early signs of common failures—such as hoisting or slewing issues—and outperforms traditional threshold-based alarms. Validated with operational data, the approach enables predictive maintenance, improving safety and reducing downtime. The study demonstrates the value of AI in smart crane health monitoring. 11 While SVM-based methods achieve effective fault prediction for tower cranes, they struggle with high-dimensional stress data from boom defects due to kernel function limitations–our PSO-BP model addresses this by optimizing network weights to handle high-dimensional simulation data.
Saif and Chen 12 devised a framework for actuator fault diagnosis within affine nonlinear systems, accommodating both known and unknown inputs. A notable advantage of their method is its independence from the design of nonlinear observers, rendering it suitable for systems where detectability may be uncertain. They substantiated the efficacy of the proposed actuator fault diagnosis methodology through laboratory experiments conducted on a 3D crane.
In summary, scholars both domestically and internationally have extensively researched stability issues concerning all-terrain cranes. However, crane booms often deviate from ideal models due to the prevalence of defects, thereby impairing crane stability and lifting capacity. Presently, there is a dearth of relevant research addressing these issues for reference. Scholars have explored various methodologies to diagnose faults in crane components and overall machinery. After reviewing extensive literature, it is apparent that existing fault diagnosis studies predominantly focus on the crane’s slewing mechanism, including rolling bearings and gearboxes. In contrast, there is a noticeable gap in research focusing on crane boom faults. Hence, in addressing the fault diagnosis challenges associated with telescopic booms in all-terrain cranes, we propose a fault diagnosis approach based on Particle Swarm Optimization-Back Propagation (PSO-BP) neural networks. Initially, stability analysis of crane booms with pit defects is conducted using the arc-length method. Subsequently, stress data from both defective boom models with pits and normal boom models are collected to establish a fault diagnosis model employing Particle Swarm Optimization-Back Propagation neural networks. This model is then utilized to analyze fault diagnosis in crane booms. The primary research methodology is depicted in Figure 1 below. This study adopts a three-step methodology: (1) Establishing a finite element model of a 1200-ton all-terrain crane boom to simulate pit defects and calculate load-bearing degradation; (2) Developing a PSO-BP neural network optimized by particle swarm optimization to address BP’s local optimal problem; (3) Validating the model with single-pit and multi-pit fault data, using 5-fold cross-validation to ensure generalization.
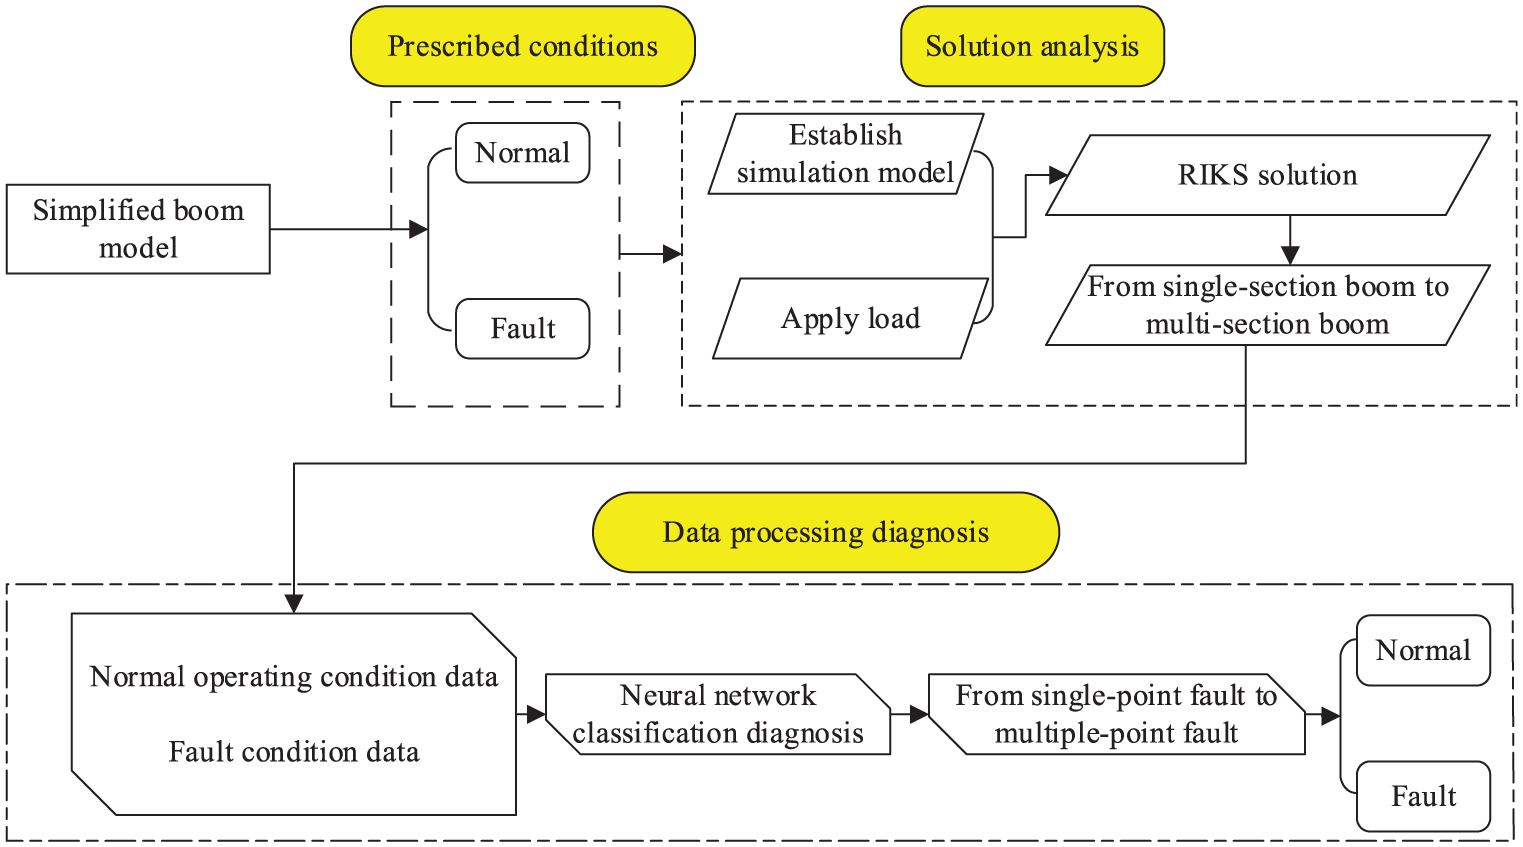
Main research routes.
Analysis of the stability of the boom
Theory of boom stability calculation
According to the calculation theory specified in crane design standards for axial compression members, the stability calculation formula for such members is derived as follows:

Where:
The calculation of the slenderness ratio of the component is as follows:

Where:

Where:
Establishment of the simulation model
In accordance with the Chinese crane design standard GB/T 3811-2008, when conducting stability research on telescopic boom cranes, it is advantageous to analyze the boom using an equivalent variable-section stepped column model based on stepped column theory. For this investigation, the chosen simulation model is derived from a specific company’s 1200-ton rated capacity all-terrain crane, featuring a fully extended boom length of 105 m. The boom is U-shaped, comprising seven nested sections, with a progressive decrease in cross-sectional area from the bottom to the top section. A depiction of the boom section can be found in Figure 2, while Table 1 presents the dimensional parameters for each section. The finite element model was built in ABAQUS 2022, using shell elements (S4R) with a mesh size of 5mm (converged via mesh sensitivity analysis). Boundary conditions: Fixed support at the boom base, axial compression load applied at the free end (consistent with GB/T 3811-2008). Pit defects were modeled as cylindrical arcs with radius 50mm, depth 1–15cm, and located at the web plate midpoint of each section.

The section of the telescopic boom.
Section and dimension parameters of the boom (unit: millimeter, mm).

During the modeling process, it is crucial to balance precision requirements, reduced computational complexity, and shortened analysis time to ensure accurate and practical results within limited resources. Additionally, considerations are made for the convenience of subsequent operations like mesh partitioning. Hence, the telescopic boom model is simplified, as shown in Figure 3.

Seven-section boom model.
This study simulates initial defects in the crane boom, which occur when the boom collides with a rigid object during operation, resulting in pit formation. Within the simulation model, a collision head is introduced to act as the impacting element responsible for creating the pit defect. This impactor is modeled as a rigid body in the form of a cylindrical arc. The connection between the impactor and the boom model is illustrated in Figure 4.

Surface contact diagram.
Identical pit defects were introduced at corresponding positions from the base section to the seventh section of the boom. Riks analysis steps were then utilized to ascertain the maximum load-bearing capacity of each boom segment, elucidating their actual weakening extent.
The calculation method involves comparing the critical loads of defect-free and defective boom sections. Specifically, the difference between the critical load of the defective section and that of the defect-free section is divided by the critical load of the defect-free section to obtain a ratio. The calculation formula is expressed as follows:

Where:
Analysis of the load-bearing capacity of faulty boom sections
After conducting simulation analysis, data pertaining to single pit defect models positioned at the same depth across various sections of the boom were acquired. The extracted and processed data are outlined in Table 2 below.
Comparison of the maximum carrying capacity of booms with and without defects.

The load-bearing capacity weakening curve of the boom is generated by plotting the weakening degree of sections with single pit defects at the lower cover plate of each section, as depicted in Figure 5.
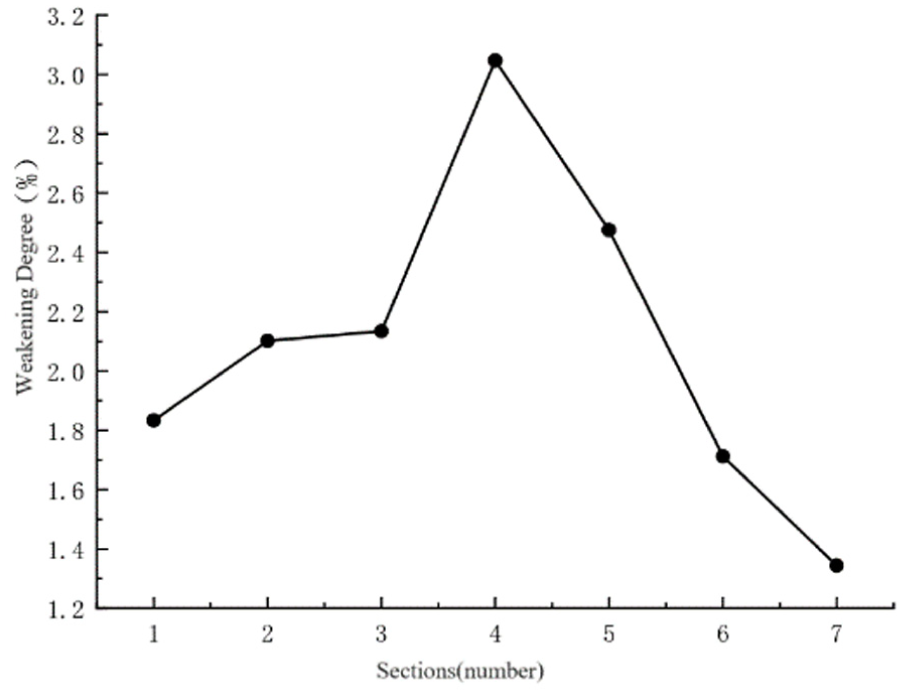
Weakening degree of each boom section with single pit defects (depth = 5cm).
The graph analysis indicates that when identical pit defects are introduced at corresponding locations across the seven sections of the crane boom, the impact on its load-bearing capacity shows an initial increase followed by a decrease. The third, fourth, and fifth sections are most affected, experiencing weakening degrees of 2.134%, 3.046%, and 2.475% respectively. Conversely, the seventh section demonstrates the least reduction in the overall load-bearing capacity of the boom when harboring pit defects, with only a 1.344% decrease. Notably, the fourth section exhibits a significantly higher weakening degree compared to others, suggesting a notable amplification in the defect propagation effect within the structure following the occurrence of pit defects in this section.
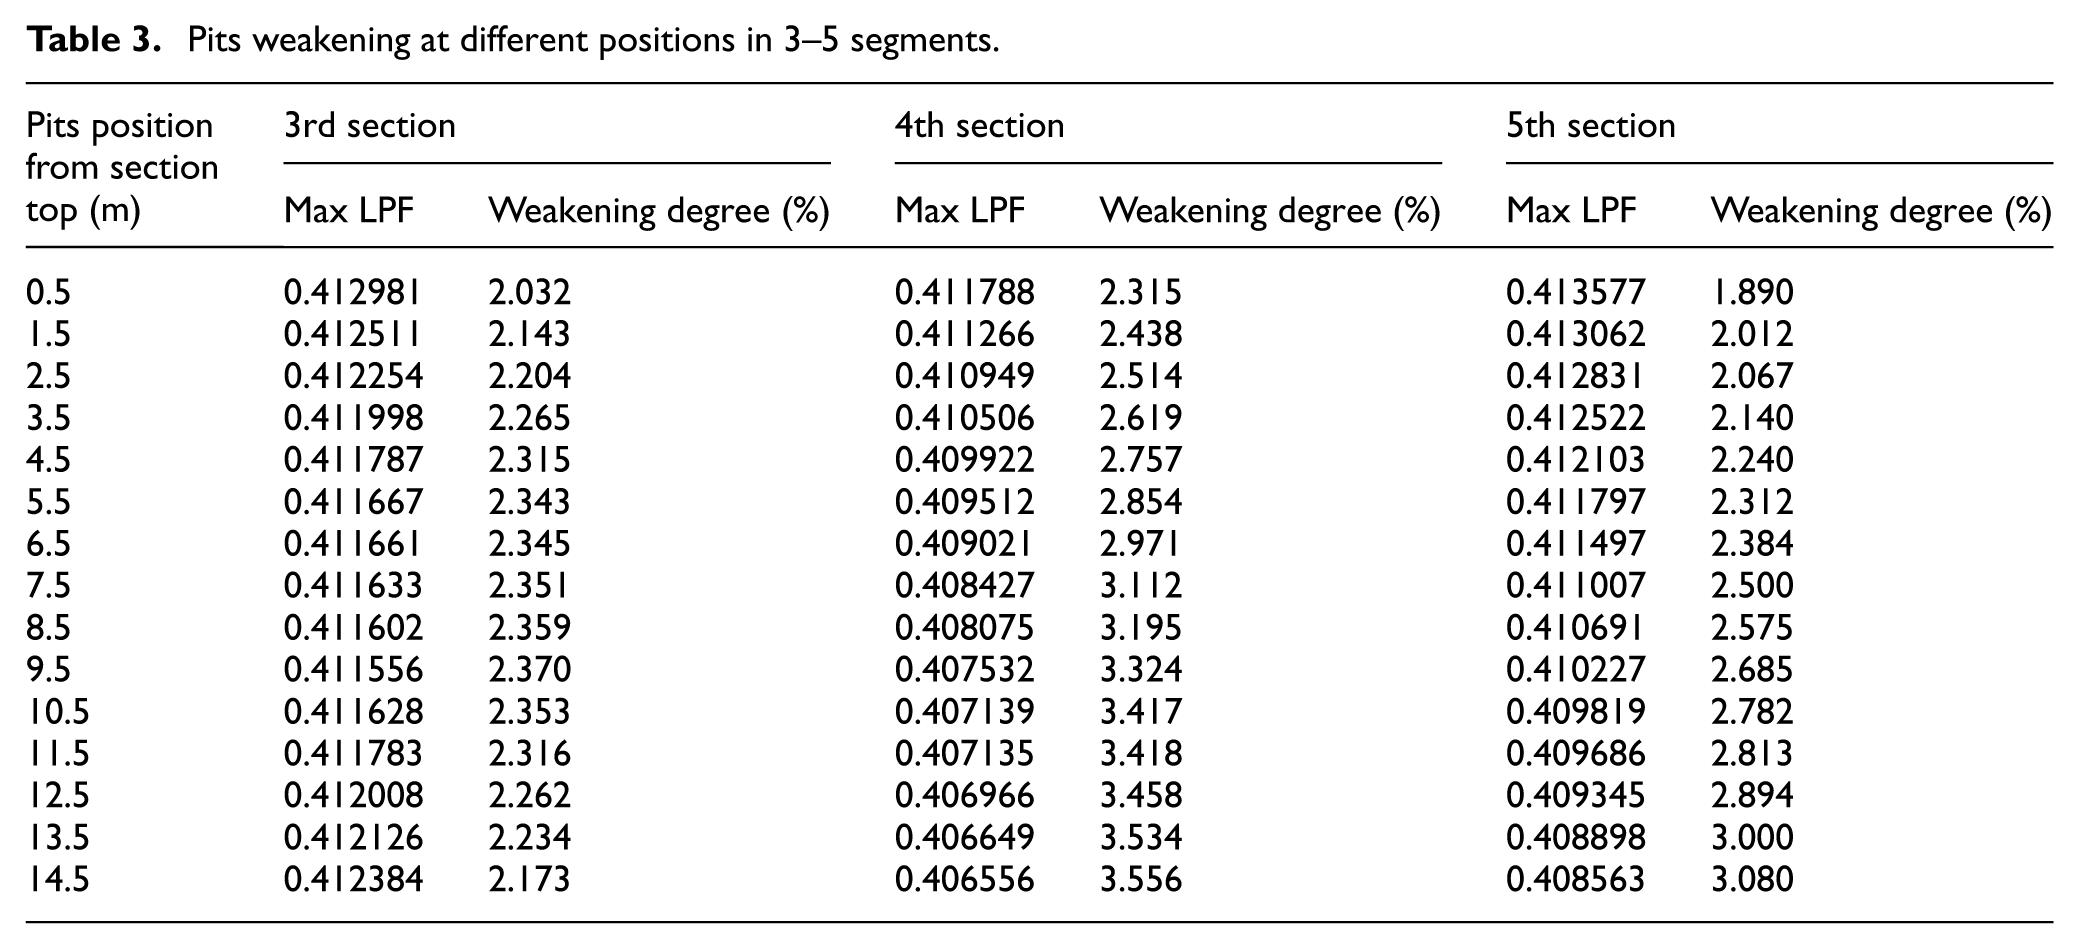
Based on the preceding analysis, the sections primarily impacted by faults in the lower cover plate of the boom are the third, fourth, and fifth sections. To assess the effect of pit faults at various positions on the same section of the boom on its overall load-bearing capacity, we focus on the third, fourth, and fifth sections. Pit faults are systematically applied to the lower cover plate of each section, starting from 0.5 m below the connection point between two sections, marking the top of each section. Faults are spaced at 1 m intervals, resulting in 15 defect points per section. For clarity, these positions are numbered 1–15, starting from the 0.5 m mark. The model’s material properties, geometric parameters, loading conditions, boundary conditions, and contact properties remain consistent with those in the previous section. Following simulation analysis, each section yields 15 load-bearing capacity data points, totaling 45 data points for the three sections. This dataset is vital for assessing the impact of faults on the boom’s load-bearing capacity. The load-bearing capacity data for sections with faults are compared with those of a normal boom and presented in Table 3 below.
Pits weakening at different positions in 3–5 segments.
The impact of pit defects at various positions on the load-bearing capacity of the boom’s three sections can be illustrated in the scatter plot depicted in Figure 6 below.
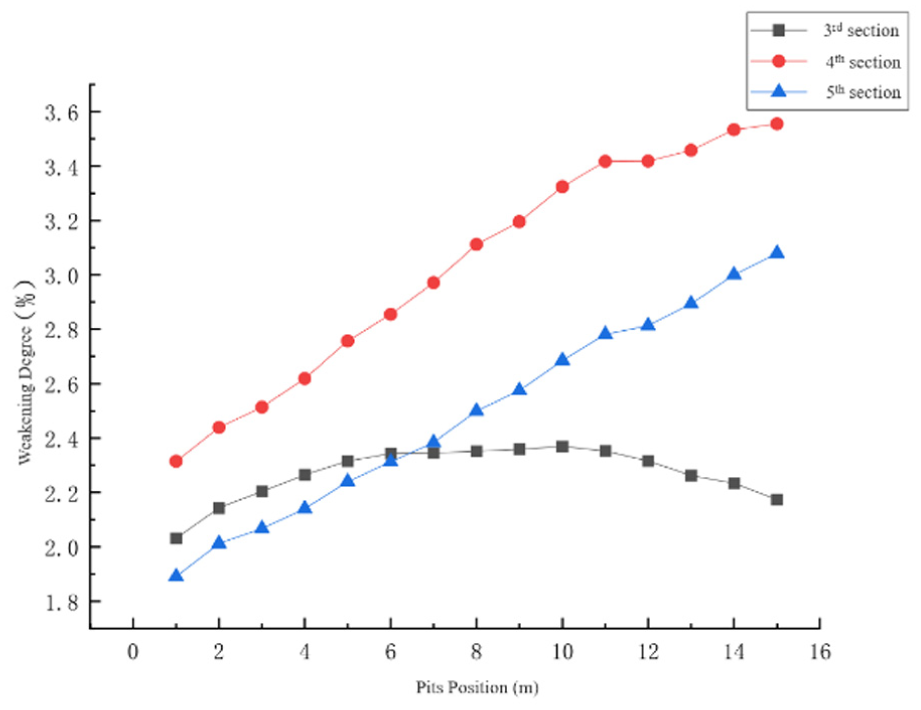
Fault positions and weakening degree in the three boom sections.
From the graph, it’s evident that pit defects at different positions on the third, fourth, and fifth sections of the crane boom lead to varying degrees of load-bearing capacity weakening under identical conditions. The most significant impact is observed in the fourth section, denoted by the red dashed line, with weakening ranging from 2.3% to 3.5%. This section exhibits a gradual increase in weakening. Similarly, the weakening trend in the fifth section aligns with that of the fourth section, indicated by the blue dashed line. However, overall weakening is lower than in the fourth section, ranging from 1.9% to 3.0%, representing a 17% decrease compared to the maximum weakening of the fourth section. The impact on the third section differs slightly from the first two sections, with the weakening percentage initially increasing and then decreasing across various positions, shown by the black dashed line. Weakening is relatively higher before the seventh pit position compared to the fifth section, but minimal afterward. Overall, the maximum weakening degree of the third section is significantly lower than that of the fourth and fifth sections, with reductions of approximately 31% and 22%, respectively.
In practical engineering scenarios, quantifying the depth of pits presents challenges due to variations in collision severity. Pits can vary in depth depending on the force of impact. Despite uniform working conditions, the fourth boom section consistently exhibits the most significant weakening. To assess the influence of varying pit depths on crane boom load-bearing capacity, pits of different depths are applied at identical positions on the fourth boom section. This investigation aims to further quantify the impact of pit depth variation on crane boom load-bearing capacity.
At the same location, pit defects ranging from 1 to 15 cm are individually applied. Subsequently, Riks analysis steps are utilized to investigate the ultimate load-bearing capacity of the boom structure with pits of varying depths. For clarity, the depths are labeled from 1 to 15. The material properties, geometric parameters, loading conditions, boundary conditions, and contact properties of the model remain consistent with the previous specifications. Following simulation analysis, data including load proportion factors for booms of different depths are extracted and presented in Table 4 below.
Influence of different pit depths on the boom.

Based on the data in the table, the weakening degree curve of the crane boom’s load-bearing capacity for different pit depths is plotted as shown in Figure 7 below.

Pits at different depths.
The black dashed line in the graph clearly demonstrates that as pit defects of varying depths are applied at the same location on the boom, the overall weakening of the boom’s load-bearing capacity progressively increases with pit depth, peaking at 15 cm. This observation underscores the substantial influence of pit depth on the structural performance of the boom, with deeper pits leading to lower critical load-bearing capacity points.
Failure diagnosis of crane boom
The principle of BP neural network
The main learning mechanism of the BP neural network involves using forward propagation signals combined with backward error adjustment. Its objective is to optimize the connection weights between layers, thereby learning the nonlinear mapping between inputs and outputs and ultimately establishing the optimal model of the neural network. 13
The neural network architecture comprises an input layer, hidden layer(s), and an output layer, where each layer contains multiple neurons with distinct characteristics. Connections between layers are established through weights, and the choice of the number of hidden layers can be made manually. 14 Figure 8 depicts a schematic diagram of this structure.
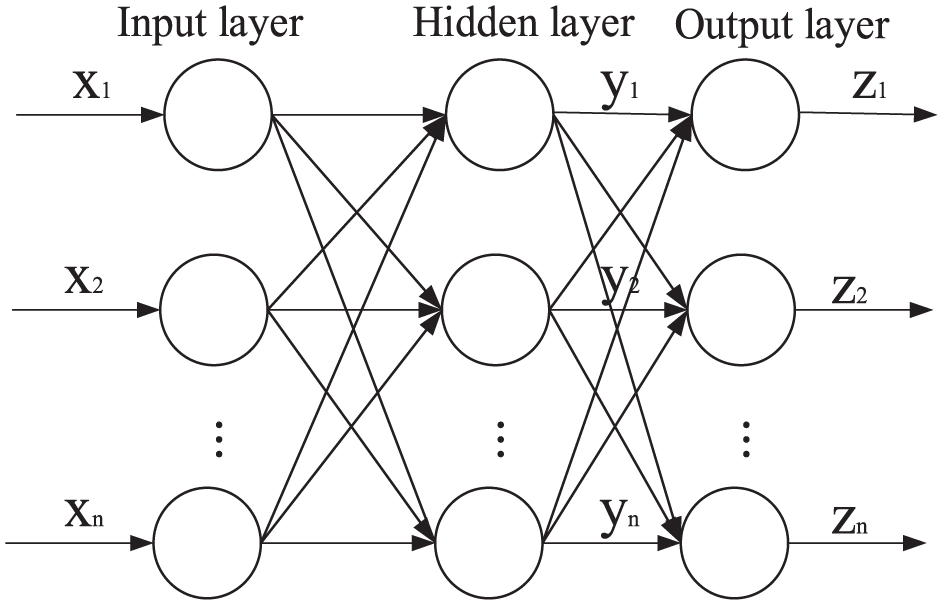
Structure of BP neural network.
The process of standardizing a neural network algorithm involves the following formula and steps:
Initialization: Before training the neural network, initialize the connection weights of nodes in each layer. Typically, the weights are within the range of [−1, 1]. Adjust the global maximum error and maximum number of learning iterations according to practical requirements.
Input data: After the initialization step, sample data


Then, the input layer data undergoes weighted summation and calculation, enabling the determination of the input


After the computation in the hidden layer, data is transmitted to the subsequent output layer. Therefore, the calculation of the input


During this process, the activation function is set as follows:

The error function is set as:

PSO-BP neural network
In the Particle Swarm Optimization (PSO) algorithm, each particle represents a potential solution in the search space, and all particles collectively form a swarm. By utilizing individual historical information and collaborative information within the swarm, each particle determines its direction and velocity in the solution space. This collaborative approach enables particles to adapt their search strategies, facilitating the quest for the global optimal solution.15,16
Assume that the optimal position found by the i-th particle during the search is denoted as


In the given equations,
When optimizing the BP neural network using PSO, the connection weights and thresholds of each layer in the neural network are regarded as components of particles in the particle swarm. Thus, these weights and thresholds define the dimensions of each particle in PSO, establishing a mapping relationship between the dimensions of PSO particles and the weights and thresholds of the BP neural network. Assuming the neural network includes N weights and thresholds, each particle is represented as an N-dimensional vector, where N denotes the total number of all connection weights and thresholds. Let

Where

Where
After computing the fitness value
The PSO-BP algorithm proposed in this study is implemented in MATLAB. The overall algorithmic flowchart is illustrated in Figure 9:

Flowchart of the PSO-BP algorithm.
Diagnosis and identification of pit faults
In the preceding sections, pit defects were introduced into the models of each boom section, and simulations were conducted to assess the load-bearing capacity of boom models with single faults. This analysis generated equivalent stress data for each model. Due to the large volume of elemental stress data across all models, to streamline the experimental process while ensuring accuracy, only the stress data from 105 elements located at the web plate of each boom section were selected as the dataset. Consequently, a total of 735 stress data points were collected from all seven sections, where each section corresponds to five feature sets and one label (a total of seven labels, one for each section). The neural network configuration, including neuron count and population size, remained consistent with the preceding section. The size function was used to determine the total number of rows in the dataset, and then the Randperm function was used to randomly shuffle the order of all rows. Two-thirds of the dataset was allocated for training, and the remaining one-third was reserved for testing. After data processing, the proposed algorithm achieved a peak accuracy of 100% for crane boom models with single pit defects. The confusion matrix is depicted in Figure 10 below.

Confusion matrix of PSO-BP neural network: (a) PSO-BP confusion matrix of training set and (b) PSO-BP confusion matrix test set.
From the confusion matrix, it’s apparent that the model achieves a 100% classification recognition rate for identifying single pit defects across the seven boom sections. However, it is challenging to assess the true performance of the model in a single diagnostic experiment. To ensure a more reliable and stable performance evaluation and accurately assess the model’s generalization ability across different datasets, the K-fold cross-validation method was employed for further analysis. This approach provides a more robust foundation for fault diagnosis. Typically, the number of folds in K-fold cross-validation ranges from 5 to 10, depending on the size of the dataset. For this experiment, 5-fold cross-validation was adopted. The results are presented in Table 5 below.
Accuracy of PSO-BP single pit diagnosis.

The table shows that even with the application of K-fold cross-validation, the model exhibits stable recognition performance. Both the comprehensive training and testing accuracies exceed 99%, thereby confirming the feasibility of identifying single-pit defects in boom structures.
Diagnosis and identification of multi-pit faults
The failure scenarios of crane booms under complex working conditions are not limited to single pit defects. Multiple pit faults may concurrently occur on a single boom section, with varying pit positions. Although the previous section focused on diagnosing single pit defects in the boom using a neural network algorithm, the possibility of multiple pit defects on a single section deserves attention. Using a neural network model to detect scenarios involving multiple pit defects can evaluate the algorithm’s adaptability to more complex and diverse fault scenarios. Additionally, it facilitates a more comprehensive evaluation of the algorithm’s robustness on similar datasets used in this study.
Using a simulation model of a crane boom with defects, stress data from different positions of single boom sections affected by pit defects were collected to form the dataset. This was conducted to evaluate the model’s ability to identify multiple pit defect locations, starting with two positions and incrementally increasing the number of defects. Employing the K-fold cross-validation method helped reduce experimental randomness and evaluate the true performance of the model. Pit positions were designated with numbers from 1 to 15. To simplify the presentation, the experimental results are summarized below.
Specific visualization of accuracy for identifying the number of pit defects is shown in Figure 11.

Different number of fault recognition rates.
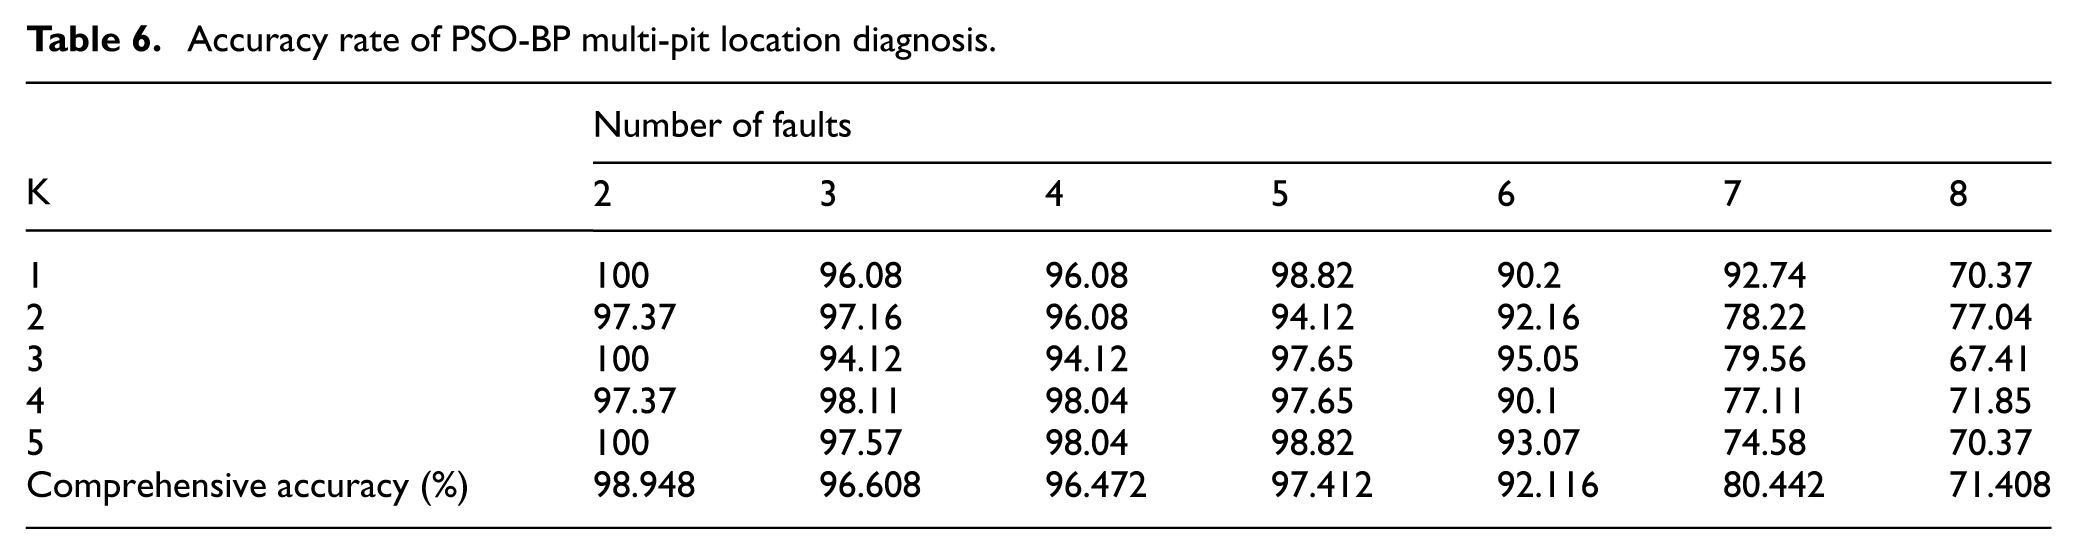
Based on the results presented in Table 6 and Figure 11, the recognition accuracy of the model exhibits slight fluctuations during K-fold cross-validation. For scenarios involving 2–4 defect points, the recognition accuracy consistently exceeds 96%. However, as the number of defect locations increases, a significant decline in accuracy is observed. When identifying seven or more defects, the performance of the model is significantly affected by complex data, resulting in a decrease in accuracy to below 80%. As a result, its practical applicability is reduced.
Accuracy rate of PSO-BP multi-pit location diagnosis.
Conclusion
This study investigates the potential impact of pit defects on the stability of crane booms. A simulation model was established in ABAQUS to simulate real-world conditions, facilitating the analysis of the load-bearing capacity of crane booms with pit defects. Subsequently, stability analysis was conducted on the booms, and a fault diagnosis method for crane booms based on the PSO-BP neural network is proposed, focusing on models with detected defects. The experimental analysis leads to the following conclusions:
(1) Pit defects were induced at the midpoint of the web plate of each of the seven boom sections using a rigid impactor, resulting in varying degrees of reduction in load-bearing capacity. The seventh section was least affected, with a reduction of 1.83%, while the fourth section exhibited the most significant weakening (3.04%). Similarly, the third and fifth sections exhibited reductions exceeding 2%.
(2) Focusing on the third, fourth, and fifth boom sections (which were most affected by single pit defects), 15 pit defects were introduced at different positions. The results showed that the base of the fourth section exhibited the most significant weakening, with a maximum reduction in load-bearing capacity of 3.55% observed across the entire model. Furthermore, an investigation into pit defects at the same position but with different depths showed that the load-bearing capacity decreases proportionally with increasing pit depth.
(3) The proposed PSO-BP model addresses the local optimization limitation of traditional BP neural networks, achieving superior performance in boom fault diagnosis–this provides a generalizable framework for geometric defect diagnosis in thin-walled structures.
(4) To evaluate the performance of the model, different configurations of pit defects at various positions on single boom sections were identified using the PSO-BP neural network. The analysis showed that when the number of pit defects does not exceed four, the accuracy remains above 96%. However, when identifying more than four pit defects, the accuracy exhibits a rapid decline. Future work will focus on: (1) Incorporating real-world sensor data (instead of simulated data) to enhance practical applicability; (2) Extending the model to multi-type defects (e.g., cracks and corrosion); (3) Optimizing the model for edge computing to enable on-site real-time diagnosis.
Footnotes
Acknowledgements
The authors would like to express their sincere gratitude to Prof. Dr.-Ing. Johannes Fottner from the Chair of Materials Handling, Material Flow, and Logistics, Technical University of Munich, for his invaluable support throughout this research.
Handling Editor: Aarthy Esakkiappan
Funding
The authors disclosed receipt of the following financial support for the research, authorship, and/or publication of this article: This research was financially supported by the National Natural Science Foundation of China (Grant No. 52075356), Central Guidance Fund for Local Science and Technology Development Projects (No. YDZJSX2025BO06), the Chinese Scholarship Council (Grant No. 202208140061) Shanxi Provincial Basic Research Program Joint Funded Project (Grant No. 202503011261004), and the Teaching and Research Project of Shanxi Province (Grant No. 2024AL23).
Declaration of conflicting interests
The authors declared no potential conflicts of interest with respect to the research, authorship, and/or publication of this article.