
Abstract
Minimizing electrical contact resistance is key to enhancing current-carrying capacity and reducing power loss of heavy-duty connectors. In this work, the electrical contact resistance (ECR) of heavy-duty connectors with axially canted coil springs socket assembly is numerically calculated by the commercial finite element simulation software of COMSOL Multiphysics in conjunction with experimental validation. Firstly, the theoretical calculation model of the ECR for heavy connectors is presented. The mechanical contact stress distribution, the contact area profile, and the electrical potential distribution are further obtained based on the electro-mechanical coupled simulation. The simulation results show that the contact spot remains elliptical during insertion with the aspect ratio increasing from 1.77 to 2.97 as the insertion displacement increases. Furthermore, a custom-developed test rig enabling in situ visualization of the contact area, and measurement of ECR and axial mechanical force is designed. Meanwhile, a dedicated image processing algorithm for extracting contact area profile is proposed. Typical variations in the insertion/withdrawal force and the ECR, as well as the contact area profile as a function of insertion displacement are illustrated explicitly. Experimental validation demonstrates good agreement with the numerical model, with deviations of 3.6% for the insertion force, 4.7% for the image-processed contact width, and 2.3% for the calculated contact resistance. These quantitative results confirm the accuracy and feasibility of the proposed simulation and experimental methodology.
Keywords
Introduction
Heavy-duty connectors are widely used in electric power transmission scenarios, including electric vehicles, renewable energy systems, and traction power systems.1–3 Compared with the traditional leaf spring contact pin, twisted contact pin, and crown spring socket, axially canted coil springs socket assembly has become the first choice for the connectors carrying high current applications due to their unique geometry that provides multiple parallel conduction paths, inherent redundancy, and excellent vibration resistance. The (ECR) is widely regarded as an effective indicator of the connector state of health. 4 Variations in ECR directly reflect changes in contact condition, including surface degradation, contact force relaxation, and interfacial micro-motion. For signal connectors, especially under combined thermal and vibration environments, ECR exhibits high sensitivity to contact instability and signal integrity degradation, and is therefore commonly used to characterize contact state evolution and dynamic performance.5–7 In particular, intermittent failures, which are typical in automotive and aerospace connectors, are often manifested as transient or sudden increases in ECR, making ECR monitoring an effective means for identifying such failures and analyzing their underlying mechanisms.8,9 For power and high-current connectors, ECR directly determines the current-carrying capability and operational reliability.10–12 Excessive ECR leads to increased Joule heating, localized temperature rise, accelerated material degradation, and, in severe cases, catastrophic failures such as contact welding.13–15 Therefore, the accurate estimation of the ECR is essential for ensuring reliable operation of high-power connectors.
The classical contact resistance theories, such as Holm’s constriction resistance model 12 and the Greenwood–Williamson model for rough surfaces, 16 provide useful insights into idealized contact conditions. However, these theories are generally developed under simplified assumptions, including idealized contact geometries and uniform pressure distributions. As a result, they become inadequate when applied to axially canted coil springs socket assemblies, where complex geometry, deformation, surface state, and mechanical loading strongly affect the real contact behavior.17–19 Beyond purely mechanical considerations, previous studies have demonstrated that the contact resistance is also strongly influenced by multiscale surface characteristics, thermo-electrical coupling effects, and operating conditions. Scale-dependent contact behavior and thermal contact resistance have been extensively investigated for rough surface contacts,20,21 while fundamental electrical contact mechanisms and frequency-dependent effects have also been discussed in the literature.22,23 These studies highlight the intrinsic complexity of real contact interfaces and the limitations of idealized analytical models. Soler and Rangel 24 and Yu et al. 25 analyzed the geometrical configuration and the lateral compression deformation of axially canted coil springs, respectively, demonstrating that the mechanical response governs their electrical behavior. In particular, Schriefer et al. 26 systematically investigated the influence of spring geometric parameters on ECR, revealing the sensitivity of resistance to structural variations. Novák and Szabo 27 studied the temperature rise of such contacts under fault currents, highlighting the severe risks caused by high resistance. These studies provide important references for understanding the conduction mechanism of spring contacts, but also show that the true contact area is difficult to determine experimentally due to the concealed nature of the interface. 28
For axially canted coil springs, the interface is composed of multiple curved wire segments that generate numerous small contact spots subject to elastic-plastic deformation, surface roughness, and non-uniform loading along the circumference. These features make multiscale models and thermo-electrical coupling analyses essential for capturing their true ECR behavior.29,30 Furthermore, tribological studies have shown that elevated resistance often coincides with fretting and wear, accelerating degradation under service conditions.31–33 This underscores the need for tailored modeling and experimental strategies to bridge the gap between classical theories and practical applications. In principle, once the true contact area is known, the constriction resistance could be calculated using classical or modified models.34–36 However, the contact region is embedded deep inside the structure, making direct measurement of the real contact area practically infeasible.
To address this issue, the present work proposes an integrated experimental–numerical method to evaluate the real contact area and the ECR of axially canted coil spring socket assemblies. By integrating image-based contact width extraction with simulation-derived elliptical contact spot geometry, the proposed method enables indirect but quantitative evaluation of contact area evolution during the insertion process. The structure of this paper is organized as follows. In Section “ECR of heavy-duty connectors with axially canted coil springs socket assembly,” the apparent mechanical contact area of the heavy-duty connector with the axially canted coil springs socket assembly, together with the associated ECR, is introduced. In Section “Finite-element simulation model,” the finite element simulation model is established, and the evolution of the mechanical contact profile and its main features during the insertion process are analyzed. In Section “Experimental details,” the mechanical contact behavior is experimentally characterized using a custom-developed test rig, and the pictures are processed by a dedicated image processing algorithm. In Section “Results and discussion,” the observed contact width is compared with the simulated values, and the calculated ECR is validated against numerical simulations, thereby demonstrating the effectiveness of the proposed approach. Finally, Section “Conclusion” concludes the paper and summarizes the main findings.
ECR of heavy-duty connectors with axially canted coil springs socket assembly
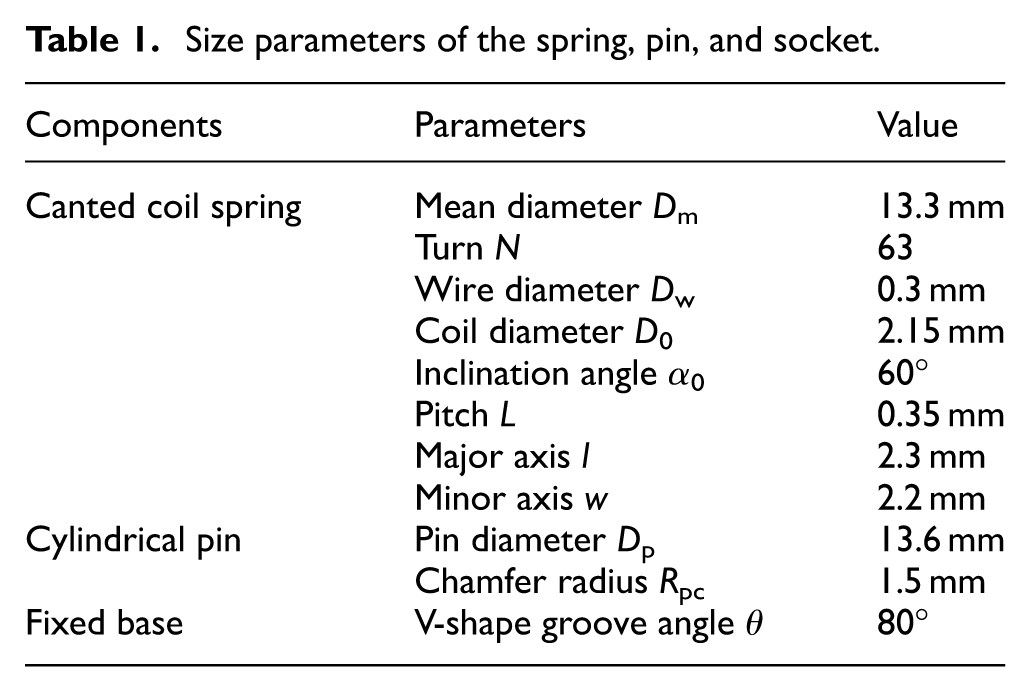
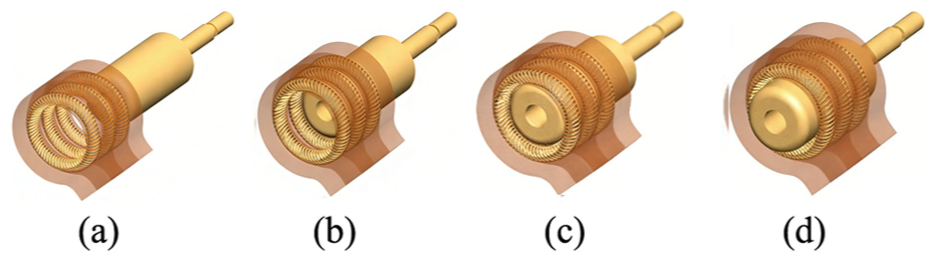
As shown in Figure 1(a), the typical heavy-duty connector consists of a pin, an axially canted coil spring, and a socket with V-shape groove. The pin is cylindrical with a diameter of Dp and features a chamfer with a radius of Rpc. The associated parameters of the axially canted coil spring are illustrated in Figure 1(b) and (c), including the mean diameter Dm and turns N of coil. For a single coil, l and w are the major axis and minor axis, and Dw is the spring-wire diameter. D0 and α0 represent the diameter and canted angle of the reference circle, and L is the pitch between adjacent coils, respectively. This industrial design facilitates a smooth transition during the initial insertion process, which could reduce the insertion force and ensure proper fit even in cases of significant coaxial deviations between the pin and the axially canted coil spring. The socket incorporates an annular groove with an angle θ (shown in Figure 1(d)), in which the axially canted coil spring is mounted. During the mechanical insertion process, the chamfer of the pin initially contacts the axially canted coil spring, which is subsequently compressed and deformed. Upon full insertion of the pin, a single contact spot is established between the axially canted coil spring and the pin, meanwhile, two contact spots are formed between the axially canted coil spring and the socket. This configuration enables the load current to flow from the pin, through the axially canted coil spring into the socket, thereby facilitating reliable electrical conduction. To prevent contamination and corrosion during assembly and operation, all three components are gold-plated, ensuring excellent high-current capacity.

Schematic diagram of the heavy-duty connector with axially canted coil springs socket assembly. (a) Exploded view of individual components. Geometric parameters of (b) the axially canted coil spring, (c) individual coils and (d) the socket with V-shape groove.
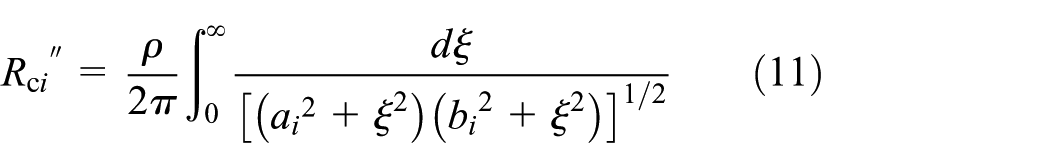
After the pin and socket assembly mated, the constriction resistance is inevitably formed in the contact interface when current passing. In Holm, 12 the constriction resistance of spot with elliptical feature is written into

in which a and b are the semi-major and semi-minor axes, and ρ is the electrical resistivity of the spring-wire material. The values of a and b are determined by the normal force in the contact region, and are related to the designed interference fit between the pin and the spring-wire.
As shown in Figure 2, when the bulk resistance of the pin, coil spring, and socket is ignored, the total constriction resistance Rc′ of single coil for the axially canted coil spring within the heavy-duty connector is considered as the combination of constriction resistance Rc1, Rc2, and Rc3 and written into

Thus, the total resistance Rc of the axially canted coil spring could be considered as the parallel resistance of N turns, which is further calculated by

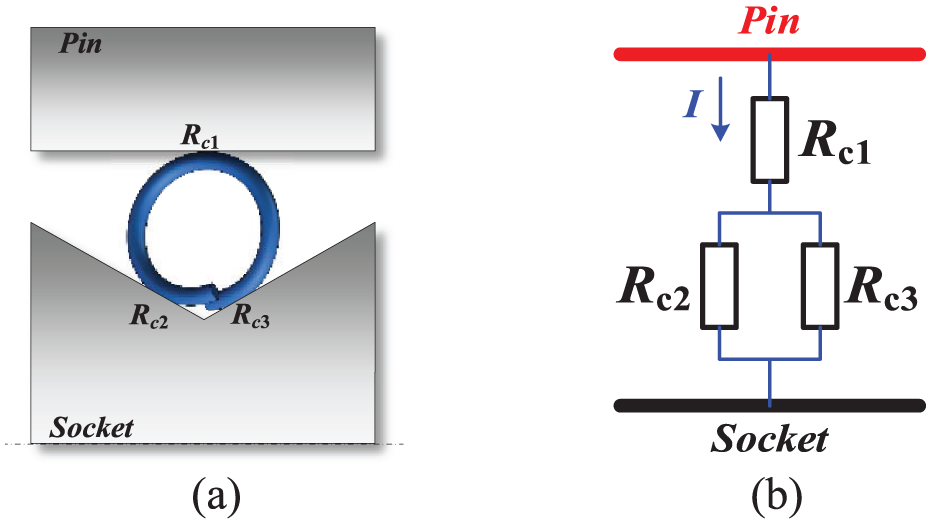
Schematic diagram of (a) contact positions and (b) ECR between pin and socket.
Finite-element simulation model
A numerical simulation model is built to quantitively describe the performance of different axially canted coil spring designs and to predict demanded normal load force and associated ECR under loading. This model predicts the properties of a whole axially canted coil springs contact with the pin and the socket with V-shape groove, which is happening in a periodic or repeated pattern. Each axially canted coil spring design could be defined by few shape feature parameters. Such parameters directly determine the spring mechanical deformation and the following electro-mechanical coupled characteristics.
The 3-D simulation model shown in Figure 3 is built by using the commercial software COMSOL Multiphysics® 6.3 (COMSOL AB, Stockholm, Sweden), where the axially canted coil spring is created by multiplying the helix curve of the linear coil by a rotation matrix. And the helix curve could be mathematically described by the following Cartesian space curves

where θ1 denotes the rotation angle of the cross-sectional equation of the canted coil spring, defined as θ1 = 2πt/N (Table 1).
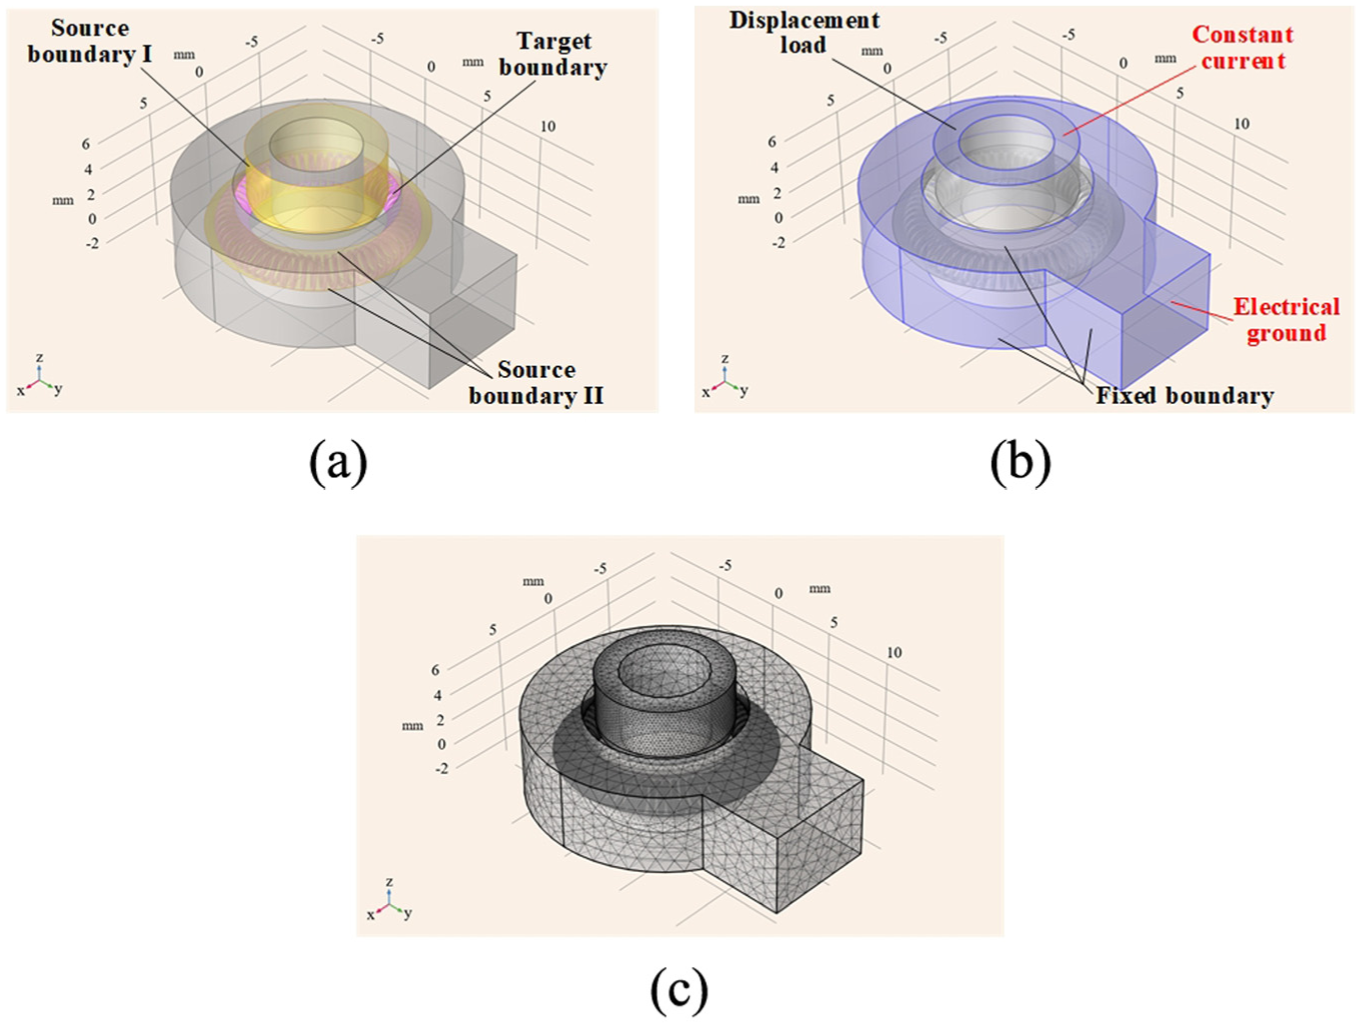
Illustration of simulation model: (a) geometry model, (b) boundary conditions and (c) FEM mesh.
Size parameters of the spring, pin, and socket.
The selected Solid Mechanics module in COMSOL Multiphysics® 6.3 is employed to solve the contact mechanics equations using the finite element method. Contact pairs are introduced to simulate mechanical deformation across contact surfaces, including the contact between pin and axially canted coil spring, and the contact between axially canted coil spring and socket. As shown in Figure 3(a), the source boundaries are the pin outer surface and the V-shape groove surface of socket, and the destination boundary is the outer surface of axially canted coil spring. Meanwhile, the outer surface of the socket is fixed, and the displacement load is vertically applied to the top surface of the pin using a single step of 0.001 mm together with the total 500 sub-steps. Electrically, the socket terminal is grounded, and a prescribed constant electrical current 10 mA is loaded on the terminal of the pin. The whole geometry model is meshed with 3D traditional tetrahedral elements. In order to improve the quality of elements, the mesh size of potential mechanical contact region is no more than 0.1 μm as shown in Figure 3(c).
The simulation results of the stress distribution at an insertion displacement of 5 mm are presented in Figure 4(a), with a magnified view of a single coil shown in Figure 4(b) and (c). Due to the periodic geometry and uniform boundary conditions, each coil exhibits nearly identical deformation, reflecting the structural self-similarity of the axially canted coil spring. The simulated maximum stresses for a single coil are approximately 80 MPa at the socket back-pin side (Region I), 72 MPa at the socket facing-pin side (Region II), and 25 MPa at the pin-coil interface (Region III). This stress distribution reveals that the socket-side contacts dominate the mechanical load transfer. The back-pin side exhibits the highest stress because the coil twists about this region as a pivot under pin insertion, thereby accumulating significant bending and reaction forces. The facing-pin side, although directly subjected to compressive loading from the pin, experiences slightly lower stress due to partial load redistribution. By contrast, the pin-coil interface sustains the lowest stress, as the pin primarily induces sliding and torsional displacement rather than concentrated compression at this location. These findings indicate that Regions I and II are the critical sites for mechanical degradation, such as stress relaxation, creep, and fatigue crack initiation, whereas Region III, despite its lower mechanical stress, is more prone to electrical contact failure owing to its smaller effective contact area and higher current density.

Variations in contact stress distribution with insertion displacement: (a) overall stress distribution of the canted coil spring at an insertion displacement of 5 mm, (b) enlarged view of contact Regions I and III, (c) enlarged view of contact Region II and (d) evolution of the local contact stress distribution with increasing insertion displacement.
The evolution of the contact region with insertion displacement is shown in Figure 4(d). The contact spot maintains an elliptical geometry throughout the insertion process due to dual curvatures defined by the wire diameter and coil base circle. This elliptical trend indicates increasing stress non-uniformity: the major-axis direction enhances load-bearing capacity, while the minor-axis direction sustains higher current density, linking geometry directly to variations in contact resistance. Up to an insertion depth of 4 mm, both the major and minor axes expand, while the aspect ratio calculated by equation (5) increases from 1.77 to 2.97 in parallel with a continuous rise in maximum contact stress as shown in Figure 5. This phenomenon reflects the progressive deformation of the coil, during which the contact configuration is still evolving. Beyond 4 mm, the aspect ratio (≈3) and the maximum contact stress all converge to nearly constant values. This stabilization indicates that the coil deformation and contact morphology become fully constrained by the geometric boundary, marking the transition from a developing to a quasi-saturated contact state.

Figure 6 shows the simulated electrical current lines under the 10 mA load. The current flows from Region III into the axially canted coil springs and exits through Regions I and II. Significant constriction and bending of the current lines are observed at the three contact regions, producing the classical “constriction effect,” which concentrates current density at the real contact spots. Within the springs, the current lines converge uniformly toward the contact spots, and the calculated stable contact resistance is 44.71 μΩ. The current and potential are symmetrically distributed across all coils, forming a multi-point parallel conduction network. This arrangement reduces overall constriction resistance and provides redundancy, so that failure of a single contact has minimal impact on the global conduction path. As expected, regions of current constriction coincide with mechanical stress concentrations. Localized over-heating may accelerate material softening, plastic deformation, and migration of conductive pathways.

Variations in major axis, minor axis, and ratio of elliptical spot with insertion displacement.

Simulation results for 10 mA electrical current load. Distributions of (a) the electrical potential, (b) The current density modulus and electrical current lines profile.
The influence of geometric parameters on contact resistance has been extensively analyzed in our previous work. 37 Therefore, only the key conclusions are summarized here for completeness. It is demonstrated that the contact resistance decreases rapidly with increasing wire diameter following an exponential trend with an exponent of approximately −1.37. And the contact resistance exhibits a slight increasing tendency with increasing pin corner radius and V-groove angle. In addition, the contact resistance first decreases and then gradually increases with increasing spring inclination angle.
Experimental details
Experimental setup with integrated optical observation and measurement system
The designed test rig consists of four key modules: the mechanical structure, optical module, measurement module, and PC (shown in Figure 7). The spatial alignment of the cylindrical pin and the socket with the axially canted coil spring could be manually adjusted using two sets of combined linear translation stages along orthogonal XYZ axes. The horizontal motion of the cylindrical pin is actuated by an electric slide table (RCA2-TWA4NA, IAI, Japan) to simulate the insertion and withdrawal processes. A force transducer (FA404-5 kg, FIBOS, China) is connected to the cylindrical pin to measure the transient insertion and withdrawal forces. The optical module, including a CCD camera (MV-SUB1600C-T, Mindvision, China) and a microscope with changeable zoom, enables in situ observation of the spring deformation and the contact area between the axially canted coil spring and the movable pin. Additionally, a nanovoltmeter (Module 2182A, Keithley, USA) and a programmable current source (Model 6221, Keithley, USA) with resolutions of 1 nV and 1 pA respectively, are employed for ECR measurement. Thus, the ECR could be precisely determined using the four-wire circuit with 10 mA current. The ECR measurement system was calibrated using standard reference resistors, and the measurement accuracy was verified to reach 0.001 mΩ. The force transducer was calibrated using certified standard weights, resulting in the force measurement accuracy of 0.01 N. For optical calibration, the pixel-to-length conversion was determined using a reference calibration scale. And the calibrated pixel size was 3.19 μm per pixel, which enabled accurate extraction of the contact width and reliable quantitative analysis of the contact area from the captured images.

Schematic diagram of the test rig.
Determination of contact area based on image processing method
To validate the accuracy of the contact area calculation by the finite-element simulation software, the contact profile image of the movable pin and the axially canted coil spring captured by the industrial camera is further processed. Figure 8 illustrates the presented image processing flowchart for visualizing contact width and extracting features from the contact profile image.

Flowchart of image processing for the contact profile.
Firstly, the original contact profile image (shown in Figure 9(a)) should be converted to the grayscale image to enhance the visibility of structural features and improve processing efficiency. The grayscale value Gray(i, j) could be calculated by the weighted average method:

where Red(i, j), Green(i, j), Blue(i, j) represent the RGB pixel values. Subsequently, the Gaussian filtering method is applied to suppress random, superimposed, and high-frequency noise. The obtained grayscale image is depicted in Figure 9(b).

Image processing results of the contact profile: (a) original image, (b) grayscale image and (c, d) distributions of contact spots.
Secondly, to account for the cylindrical shape of the pin and the uniform distribution of the axially canted coil spring, the contact areas are expected to align evenly along the circular contact profile. Accordingly, an outer boundary circle and an inner boundary circle are first defined to constrain the expected contact region. These two circles form an annular search domain based on the known pin geometry and the uniform circumferential distribution of the axially canted coil spring. Within this annular region, the contact profile is extracted automatically by identifying the maximum inscribed circle formed by the detected candidate contact points. This strategy minimizes manual intervention and ensures objective and repeatable determination of the circular contact profile.
Next, a 3 × 3 matrix scanning approach is implemented to refine the contact width identification. For each white pixel on the circular profile, the surrounding eight pixels within the 3 × 3 matrix are analyzed. If any of these pixels contain both non-white and non-black pixels, the central pixel would be determined to the contact width between the pin and the axially canted coil spring, and the corresponding position could be recorded. Conversely, if the surrounding pixels consist solely of white and black pixels, the central pixel is discarded, and the next white pixel would be analyzed. This scanning process continues until reaching the starting pixel. The identified contact boundary pixels are highlighted in red within the grayscale image (shown in Figure 9(c) and (d)).
Finally, the number N wi of pixels along each continuous identified boundary would be individually counted, and the contact width b i of each turn could be calculated based on the side length l p ′ of a single pixel.

where the side length l p ′ of a single pixel could be calculated by the original pixel size of l p and the magnification factor K of optical lens, as follows:

It should be noted that the major axis of the elliptical contact spot could not be directly observed due to the embedded contact configuration of the axially canted coil spring–pin assembly. However, the relationship between the major axis and the minor axis of the contact spot has been established through the aspect ratio e based on the finite element simulations presented in Section “Finite-element simulation model.” Accordingly, the major axis could be calculated using the ratio e when the minor axis is obtained from experimental image processing, and the real contact area could then be determined. Admittedly, this procedure introduces a partial coupling between experimental measurement and numerical analysis. The contact length a i was calculated from equation (5) using the extracted contact width b i and the ratio e. Subsequently, the contact area S i of a single contact spot was calculated as

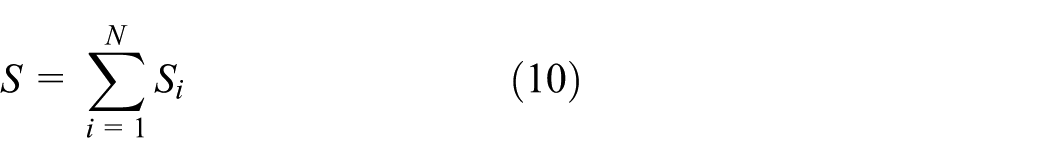
Thus, a N-turn canted coil spring contact comprises N spots, the total contact area S is given by
Meanwhile, the constriction resistance of a single contact spot with major axis of a i and minor axis of b i could be obtained as
Accordingly, the total constriction resistance of N spots connected in parallel could be expressed as

Results and discussion
The experimental specimens consist of a pin, three canted coil springs with 63 × 3 turns, and a socket. The concentricity between the pin and canted coil spring could be guaranteed by the industrial camera. The cylindrical pin is driven toward the canted coil spring with a speed of 1 mm/s by the electrical slide table, making contact with each canted coil spring sequentially. Figure 10 shows the schematic diagram of each contact state. And the typical variations in the axial force of the cylindrical pin and contact resistance during the insertion and withdrawal processes are plotted in Figure 11.
Schematic diagram of each contact state: (a) Initial state. The cylindrical pin contacting with, (b) the first canted coil spring, (c) The second canted coil spring and (d) The third canted coil spring.

The typical variations in the axial force of the cylindrical pin and ECR during the insertion and withdrawal processes.
As shown in Figure 11, the experimental results of axial force and ECR appears to be characterized by eight distinct stages. For stages I–IV representing the insertion process, the insertion force always increases rapidly and reaches the peak value, and then gradually decreases and stabilizes. The first, second, and third peak insertion force are 15.11, 20.89, and 30.62 N, and the corresponding stable force are 9.23, 17.15, and 26.21 N with the stable ECR of 0.29, 0.168, and 0.10 mΩ. For V–VIII representing the extraction process, the withdrawal force, opposite in direction to the insertion force, becomes negative. The extraction process could be considered as the reverse process of the insertion process. The withdrawal force always decreases rapidly and reaches the valley value, and then gradually increases and stabilizes. The first, second, and third stable force are 26.76, 17.50, and 8.50 N. As shown in Figure 11, the insertion process could be clearly divided into multiple stages, where both the axial force and the ECR exhibit repeatable peak–stable characteristics. For a single axially canted coil spring (Stage II), the experimentally measured peak insertion force and stable force are 15.11 and 9.23 N, respectively. In comparison, the calculated peak and stable insertion forces obtained from the numerical model are 15.68 and 9.24 N. The corresponding deviations between the simulation and experimental results are 3.6% for the peak force and less than 0.2% for the stable force. This close quantitative agreement demonstrates that the proposed simulation model could accurately capture both the peak insertion behavior and the stabilized contact state of a single canted coil spring during insertion.
The stable ECR of three paralleled canted coil springs was measured to be 0.10 mΩ, which is significantly higher than the simulated value of 14.90 μΩ. For the axially canted coil spring contact, the electrical contact is formed through multiple localized contact regions associated with individual coils. In practical experiments, thin surface films such as oxide layers or contamination films inevitably exist at these interfaces, which introduce additional interfacial resistance and lead to an increase in the measured electrical contact resistance. Moreover, due to the combined effects of surface roughness and the localized bending, torsion, and sliding involved during insertion, the apparent contact contour does not translate into a fully effective contact region. The real contact area is significantly smaller than the apparent contact area, and the effective conductive area is further reduced because only a fraction of the real contact spots actively participate in current conduction. This progressive reduction from apparent contact area to real contact area and finally to conductive contact area increases the constriction resistance and plays a key role in the experimentally observed elevation of electrical contact resistance compared with the idealized simulation results. Therefore, the accuracy of the simulated contact area was further verified by extracting the contact width from the contact profile image in Part “Determination of contact area based on image processing method” of Section “Experimental details.” To determine the contact state between each spring turn and the pin after full insertion, the histogram of the minor-axis length distribution of the contact spots is shown in Figure 12. The calculated maximum, minimum, and average contact width values are 0.151, 0.108, and 0.135 mm, respectively, with a standard deviation of 0.045 mm. The relatively uniform distribution of contact widths indicates excellent manufacturing consistency of the canted coil springs. The experimentally extracted minor-axis lengths of the contact spots after full insertion exhibit a relatively narrow distribution (shown in Figure 12). For the 63 spring turns, the maximum, minimum, and average contact widths are 0.151, 0.108, and 0.135 mm, respectively, with a standard deviation of 0.045 mm, indicating good consistency among individual spring turns. In comparison, the finite element simulation predicts an average contact width of 0.143 mm. The difference between the simulated average value and the experimentally extracted mean contact width is therefore 8 μm, corresponding to a relative deviation of only 4.7%. Considering the observed dispersion of contact widths among different spring turns, this deviation falls well within the experimental variation range. This quantitative agreement demonstrates that the simulation could reliably capture the average contact width of the axially canted coil spring–pin interface. Meanwhile, the comparison of the extracted and simulated contact area is shown in Figure 13. Multiple insertion–withdrawal tests were conducted under identical conditions. The experimental results show good consistency among repeated measurements. To quantitatively illustrate repeatability, error bars have been added in Figure 13, representing the variation in the experimentally extracted contact area across repeated tests. These two results increase with the insertion displacement of the pin with the growth rate first accelerating and then approaching stability, which suggests that the real contact area tends to be saturated. It is noted that the single coil of the axially canted coil spring undergoes torsional deformation at the contact interface during the insertion process. As a result, part of the real contact contour is inevitably obscured in the captured images. This effect leads to an underestimation of the contact half-width and contact area compared with the simulation results. When the insertion displacement is smaller than 3.6 mm, a larger portion of the contact half-width is masked. Consequently, when the insertion displacement is smaller than 3.6 mm, the accumulated contact area extracted from the experimental images exhibits a relatively large deviation from the simulation results. The relative deviation exceeds 15%, which could be attributed to the partial masking of the contact half-width caused by torsional deformation of the single coil. As the insertion displacement further increases, the contact contours become progressively exposed, and the experimentally extracted contact area approaches the simulated value. The relative error between the experimental and simulation results decreases to below 8% over most of the insertion range. In particular, when the pin is fully inserted, the relative error is further reduced to less than 6%, indicating good quantitative agreement between experiment and simulation under stable contact conditions. The above analysis validates the feasibility of analyzing the contact region through image processing and confirms the accuracy of the calculated contact width by the proposed simulation method.

The histogram of the minor-axis distribution of the contact spots for each spring wires.
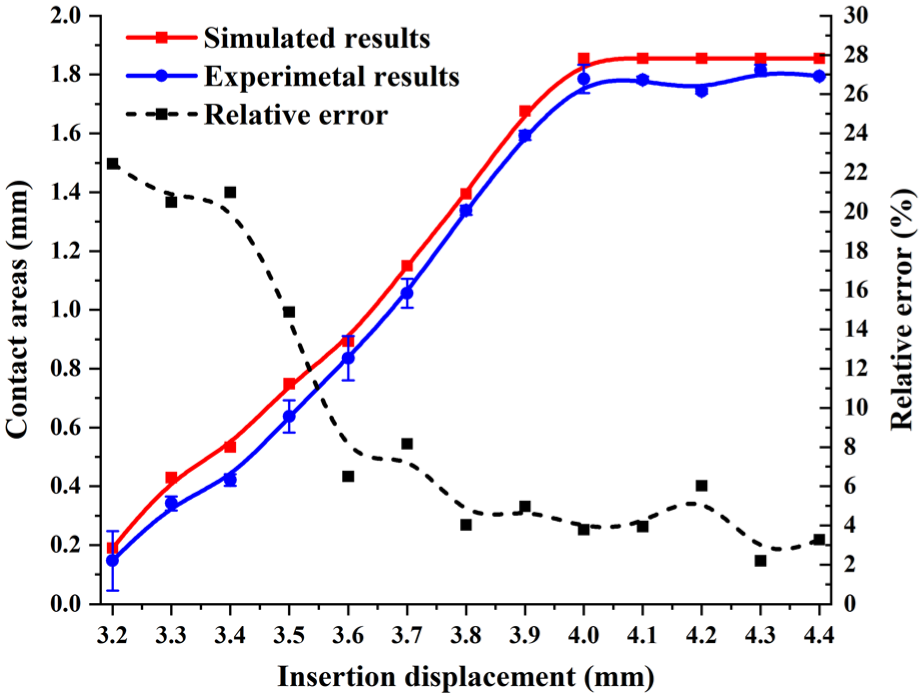
Comparison of the extracted and simulated results for contact area.
Based on the minor axis of the elliptical contact region extracted by image processing and the major axis determined from the aspect ratio, the overall ECR of the canted coil spring contact was calculated as 43.02 μΩ using equations (11) and (12). The contact resistance obtained by this method exhibits an absolute deviation of only 2.3% compared with the finite element simulation results, which indicates that the influence of the partial coupling between experimental measurement and numerical analysis on the final ECR verification is limited. This deviation is significantly smaller than that obtained from direct measurements on the experimental platform, which means that the calculated contact resistance is in closer agreement with the finite element analysis. Classical electrical contact theories are generally based on simplified assumptions, such as an equivalent contact spot, uniform contact pressure distribution, and static contact geometry. Under these assumptions, contact resistance can be described using idealized analytical formulations. However, the contact characteristics of the axially canted coil spring contact deviate markedly from these assumptions. Both simulation and experimental results show that the axially canted coil spring contact involves multiple periodically distributed contact spots and a highly non-uniform contact stress distribution among the pin–coil interface, facing-pin side, and back-pin side. In addition, the contact geometry evolves continuously during insertion due to localized bending, torsion, and sliding of the spring coils. These features are difficult to be captured using classical theories. The integrated simulation–experimental approach enables detailed contact region and stress distribution through finite element analysis, while experimental measurements provide validation under realistic conditions. This combined approach is therefore essential for accurately describing the electrical contact behavior of axially canted coil spring connectors.
Conclusion
This study examined the ECR of heavy-duty connectors with axially canted coil springs socket assembly by integrating finite-element modeling, experimental validation, and image-based analysis. The simulation results reveal that the contact stress increases in the order of the pin-coil interface, facing-pin side, and back-pin side. The back-pin side experiences the highest stress since the coil pivots about this region during insertion with concentrating bending and reaction forces, while the facing-pin side is moderately stressed due to partial load redistribution. In contrast, the pin-coil interface sustains the lowest stress, being governed mainly by sliding and torsional motion. The contact spot was found to remain elliptical during insertion with the aspect ratio rising from 1.77 to 2.97, while current lines exhibited pronounced constriction and bending at the three contact regions. Experimental results further confirmed the accuracy of the model: insertion force deviated by only 3.6%, image-processed contact width by 4.7%, and calculated contact resistance by 2.3% compared with finite-element calculations. Overall, these findings demonstrate the feasibility of estimating contact area and resistance by combining experimentally extracted minor axes with simulation-derived aspect ratios. This methodology complements conventional analyses based on insertion force and electrical contact resistance, and provides a practical and effective tool for investigating contact evolution in axially canted coil spring connectors.
Footnotes
Handling Editor: Aarthy Esakkiappan
Author contributions
Conceptualization, W.R. and C.Z.; methodology, C.Z.; software, C.Z.; validation, C.Z., H.C., and J.L.; formal analysis, C.Z.; investigation, H.C.; resources, W.R.; data curation, H.C.; writing—original draft preparation, C.Z.; writing—review and editing, W.R.; visualization, H.C.; supervision, J.L.; project administration, W.R.; funding acquisition, W.R. All authors have read and agreed to the published version of the manuscript.
Funding
The authors disclosed receipt of the following financial support for the research, authorship, and/or publication of this article: This work was supported in part by National Natural Science Foundation of China (Grant numbers 52377140 and 52407166), in part by Aeronautical Science Foundation of China (Grant number ASFC-20240002077001), in part by Key Research and Development program project of Ningbo City (Grant number 2023Z094), in part by Postdoctoral Science Foundation of China (Grant number 2023M730849), in part by Postdoctoral Science Foundation of Heilongjiang (Grant number LBH-Z22189).
Declaration of conflicting interests
The authors declared no potential conflicts of interest with respect to the research, authorship, and/or publication of this article.