
Abstract
A significant challenge in troubleshooting rotary machines is the use of signal processing methods that are often hindered by mode mixing, end effects, and predetermined parameters. This paper introduces an Improved Swarm Decomposition (ISWD) method to address these limitations. ISWD is an enhancement of the Swarm Decomposition (SWD) method, which employs a swarm-based intelligence technique to decompose a signal into oscillatory components (OCs). The performance of the original SWD method is highly dependent on two threshold parameters. A new objective function incorporating kurtosis, cross-correlation, and an orthogonal index, is defined and minimized by PSOSCALF algorithm, a hybrid of Particle Swarm Optimization, Lévy flight, and the sine–cosine algorithm. The ISWD technique is evaluated using noisy verification signals of early bearing fault data and the results are compared with other signal processing methods. Two case studies involving defective inner and outer rings are considered. The results indicate that the characteristic frequencies of bearings and their harmonics in the envelope spectra of components obtained by ISWD are clearly revealed, enabling easy identification of bearing fault types. Furthermore, the components extracted by ISWD are physically meaningful and contain higher-quality information than those obtained by SWD and other methods.
Keywords
Introduction
Bearing is one of the vital components of rotary machines and modern industries, so that their failure may lead to the complete failure of the machine. Therefore, condition monitoring and early detection of defects in the rolling element bearings is one of the most important tasks of engineers.
Condition monitoring based on the vibration signals analysis was one of the common methods that had been of great interest to researchers in recent years. Methods such as wavelet transform (WT),1–3 empirical mode decomposition (EMD), 4 empirical wavelet transform (EWT), 5 local mean decomposition (LMD), 6 variational mode decomposition (VMD), 7 and spectral kurtosis (SK)8–10 have been widely used to extract the features from the vibration signals and to detect the faults in rotating machines. However, each of these techniques has disadvantages that may impair the quality of the information extracted from the vibration data. In the following, some of these disadvantages are mentioned.
In the WT method, the selection of the wavelet base function and the studied scale are the main challenges of this technique in vibration signal processing. So far, a wide range of wavelet functions have been proposed by researchers for various purposes. However, choosing a wavelet function that is as similar as possible to the vibration signal and is able to extract the most effective features is still an open issue.11,12 Al-Raheem et al. 13 proposed a technique for rolling element bearing fault diagnosis based on the autocorrelation of wavelet de-noised vibration signal. In order to enhance the fault detection process, the authors optimized the wavelet shape parameters based on kurtosis maximization. Wang et al. 14 presented and applied a multi-wavelet denoising method to a simulated signal and fault diagnosis of locomotive rolling bearings. The authors compared their results with EMD, SVD, kurtogram, and wavelet denoising with thresholding term-by-term. They illustrated that the noise-canceling ability of their proposed method is stronger than other methods. The EMD method is an adaptive and highly efficient method that decomposes each vibration signal based on its geometric characteristics into the components called intrinsic mode functions (IMFs). The existence of the phenomenon of mode mixing, the end effects on IMFs, and the lack of a proper mathematical theory and formulation are among the deficiencies of the EMD method. 15 The ensemble EMD (EEMD) method was proposed by Wu and Huang 16 to overcome the problem of mode mixing. Also in recent years, various versions of EMD and EEMD methods have been proposed to exploit significant components.17–21 Zhao et al. 22 investigated an algorithm of signal preprocessing based on empirical mode decomposition (EMD) and soft-thresholding denoising. They validated the effectiveness of the algorithm by both simulated and experimental bearing vibration signals at a low signal-to-noise ratio. Abdelkader et al. 23 suggested and implemented an improved denoising method for early detection of rolling bearing faults. The proposed approach was based on a complete EEMD with an adaptive noise (CEEMDAN) associated with an optimized thresholding operation. In order to show the effectiveness of the proposed method, the researchers used experimental data of the Case Western Reserve University Bearing Data Center. Chegini et al. 24 proposed two new methods for detecting the bearing’s degradation starting points based on the vibration signal analysis. In the first method, the authors presented a new feature extraction approach based on the envelope harmonic-to-noise ratio (EHNR) and the fast EEMD (FEEMD). In the second method, they investigated a novel adaptive feature using the autocorrelation function of the raw signal and the energy-entropy vector. The ability of the proposed methods to detect the exact moment of the defect occurrence was illustrated by using the vibration signals of the run-to-failure experiment. The EWT is a relatively new technique developed by Gilles. 5 Inspired by the EMD method, this approach decomposes the vibration signals according to their frequency spectrum with the help of adaptive wavelets into components called empirical modes. However, the number of components resulting from this technique depends on the method of segmentation of the signal frequency spectrum. Researchers recently improved the EWT method to detect the weak signs of the rotating machine faults.25–28 Chegini et al. 29 suggested and successfully applied a new technique based on the empirical wavelet transform (EWT) for denoising the vibration signals and recognizing the bearing faults. The method’s effectiveness was clearly demonstrated on different experimental datasets.
As mentioned above, when using signal processing methods, it is expected that the studied signal will be decomposed into independent and orthogonal components. Various weaknesses and shortcomings, such as the interference of different modes in a particular mode, the determination of the number of modes before the start of decomposition and the need to use base functions, have limited the scope of application of signal processing methods. Apostolidis and Hadjileontiadis 30 suggested an innovative decomposition method called swarm decomposition (SWD). Inspired by the concept of swarm intelligence, this new approach intelligently decomposes the signal by the swarm filtering (SWF) and a repetitive algorithm to its oscillatory components (OCs). The authors in Apostolidis and Hadjileontiadis 30 illustrated that in most cases the SWD method is more successful than techniques EMD, wavelet-based multiresolution analysis (WMA), and iterative eigenvalue decomposition of the Hankel matrix (IEVDH) in analyzing the multi-component signals and isolating the signal components. However, there are two threshold parameters in SWD that are freely set. The main problem of this approach is the choice of these key parameters. An incorrect choice leads to increase the number of the obtained meaninglessness components. Miao et al. 31 schemed a new approach to specify the key parameters of the SWD method for troubleshoot the bearing compound fault. They applied the kurtosis of the envelope spectrum as the objective function to determine the optimal values of threshold parameters and to optimize the SWD (OSWD) method. The authors minimized the objective function and selected the optimal responses by implementing the whale optimization algorithm (WOA). 32 Vashishtha et al. 33 combined SWD, permutation entropy, and ReliefF-based feature selection with a slime mold-optimized ELM classifier, achieving 100% accuracy in taper roller bearing defect identification—demonstrating the potential of hybrid decomposition–optimization schemes for intelligent fault diagnosis. Chauhan et al. 34 employed AHA-optimized FMD and SVNCE-based classification for bearing fault detection, using a sparsity-focused health indicator and neutrosophic modeling to handle uncertainty. In Chen et al., 35 an improved VMD-FRFT method that mitigates its sensitivity to initial center frequency by selecting optimal initial values based on resonance bands identified via a novel impulse-sensitive indicator—the reciprocal of the spectral autocorrelation smoothness index—enhancing early weak fault detection. Babiker et al. 36 proposed an integrated early fault diagnosis method combining a backtracking strategy (for pre-threshold fault onset estimation), PSO-optimized VMD (for adaptive decomposition), and infogram-guided envelope analysis—enabling robust feature extraction from heavy noisy signals and accurate incipient fault timing estimation in rolling bearings.
The main aim of this study is to provide a novel approach to improve the SWD technique (ISWD) and determine the optimal values of threshold parameters for diagnosing the bearing early defects. In this work, three important points are considered for the signal components: (1) independence of components from each other, (2) The similarity of the components with the original signal, and (3) emergence of impulses due to the defect’s presence in all obtained components. For the signal components to have all three of these features, the new compositional index (or objective function) is defined based on the signal kurtosis, cross-correlation between signal and its OCs, and the index of orthogonal. Then, the PSOSCALF optimization algorithm 37 was used to optimize the new target function and distinguish the design variables. The PSOSCALF optimization algorithm is a new hybrid technique based on particle swarm optimization (PSO) algorithm, Levy flight distribution, and sine-cosine algorithm (SCA), 38 which was proposed to solve the engineering problems. The ISWD technique has been tested by simulation signals of the bearing vibration signals. It has been observed that the characteristic frequency of the signal and its harmonics appears well in the spectrum of the components obtained by the proposed method and the type of bearing defect can be clearly distinguished even with small defects. Also, the results indicate that ISWD approach is stronger than the EMD, EWT, SWD, and OSWD methods.
The main innovations introduced by the proposed method in this paper, as well as its fundamental differences from existing approaches such as OSWD, are clarified below.
In OSWD, the kurtosis of the envelope spectrum is used as the objective function. While this index is highly sensitive to impulsive fault signatures, it generates components with excessively high kurtosis values, which are physically meaningless and lack resemblance to the original signal. Furthermore, this indicator does not ensure linear independence or orthogonality among the extracted components. Consequently, it may yield components that overlap or interfere with one another.
In contrast, the ISWD method introduces a hybrid and multi-faceted objective function to enhance SWD, simultaneously incorporating three key criteria:
Kurtosis: Due to its sensitivity to impulsive fault signatures, this criterion is used to extract components that contain meaningful fault impacts.
Correlation coefficient between each component and the original signal: This statistical measure ensures physical similarity and preserves the meaningful portion of the original signal within the extracted components.
Orthogonality index: This criterion is included to enforce linear independence among components and to prevent overlapping representations in ISWD results.
As can be observed, the objective function defined in ISWD not only aims to detect impulses caused by a fault but also preserves the overall quality of the components in terms of similarity to the original signal and mutual independence.
It is clear that improving the original SWD approach for processing non-stationary vibration signals is a highly complex task, requiring the use of a powerful optimization algorithm capable of finding the global optimum. In OSWD, the Whale Optimization Algorithm (WOA) is utilized to determine the key SWD parameters. In contrast, the present work employs the PSOSCALF optimization algorithm. The superiority of PSOSCALF relative to WOA, in achieving the global optimum of benchmark functions and solving various engineering problems, has been clearly demonstrated in Chegini et al. 37
Methods
SWD method
The Swarm Decomposition (SWD) technique introduces an innovative method for analyzing non-stationary, multi-component signals, inspired by swarm intelligence principles.
30
This approach dissects a multi-component signal into distinct oscillatory components (OCs) by leveraging swarm filtering (SwF) principles. In this framework, the given signal
The decomposition process is analogous to a swarm’s pursuit of prey, where the swarm is composed of M entities, each defined by its spatial position
The driving force,

Conversely, the cohesion force,
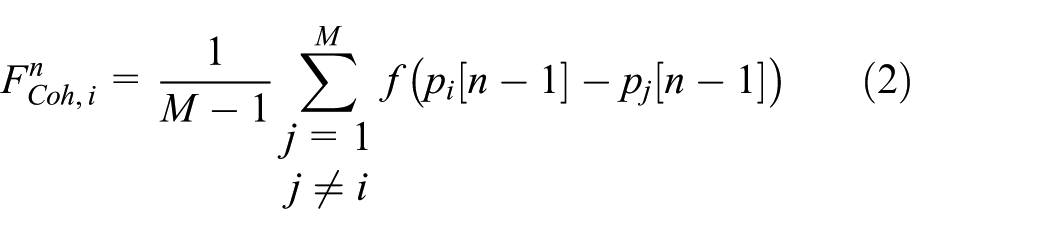

Here, sgn(.) denotes the sign function, and |.| represents the absolute value. The cohesion force determines whether two members attract or repel each other, with the function (d) governing this behavior. The critical distance parameter, d cr , is pivotal in regulating swarm distribution and is computed as the root mean square of the input signal, following Rao and Kumaresan. 39
During the hunting phase, each swarm member updates its position using the following equations:


The coefficient δ is a crucial parameter influencing the adaptability of the swarm members. The resulting SWD output is derived as:
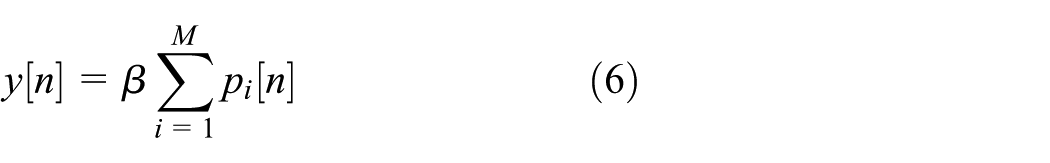
where the weighting factor β influences the swarm’s size, with a commonly assigned value of 0.005. 30 Initially, all particles start with zero velocity, and their initial positions are given by:

For a multi-component signal

The optimal values of M and δ are estimated using:


where
Initially,
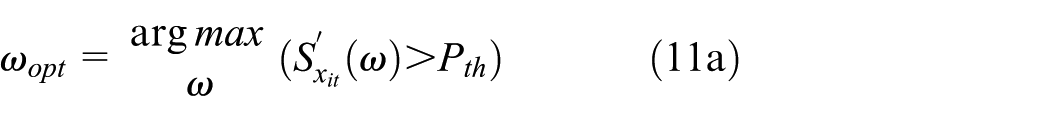
where P
th
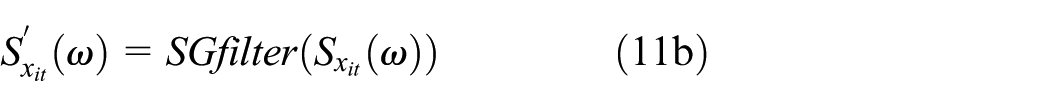
constrains the search range affecting computational efficiency. The next stage involves computing M and δ, followed by determining
The selection of StD th and P th significantly influences both the number and quality of extracted components. As per Apostolidis and Hadjileontiadis, 30 these values are generally set to 0.1.
PSOSCALF algorithm
The particle swarm optimization (PSO) algorithm is a widely used technique for addressing optimization problems. The foundational principles of this algorithm draw inspiration from the observation of social interactions among birds and fish. Although the PSO algorithm offers advantages like high computational speed, fewer parameters, and ease of implementation, it is hindered by two key limitations-premature convergence and the tendency to get trapped in local optima-restricting its capability to solve the complicated problems. 40
To overcome the mentioned limitations, Chegini et al. 37 integrated the PSO algorithm with the position—updating mechanisms of the sine-cosine algorithm 38 and random step generation of Levy flight, proposing anew approached named PSOSCALF. The incorporation of the advantages of the SCA method and Levy flight in PSOSCALF results in a balanced trade-off between the exploration and exploitation phases of the optimization process. This enhances the ability to reach the entire design space and increases the likelihood of finding the global optimum. In Chegini et al., 37 the exploration and exploitation capabilities of the PSOSCALF algorithm were evaluated using various unimodal and multimodal benchmark functions, as well as constrained engineering design problems. The results demonstrated the superiority of this algorithm over various PSO-based algorithms and several other optimization algorithms. In recent years, other applications of the PSOSCALF algorithm have been presented in areas such as intelligent bearing fault detection 41 and control engineering, 42 demonstrating its versatility.
In the present work, the PSOSCALF algorithm will be employed to enhance the SWA method and identify the optimal values for its key parameters. It should be emphasized that the PSOSCALF includes critical parameters that directly impact the optimization outcomes. In the methodology presented in this study, these parameters are configured in line with the settings used in Chegini et al. 37
Comparison of SWD with EMD and EWT
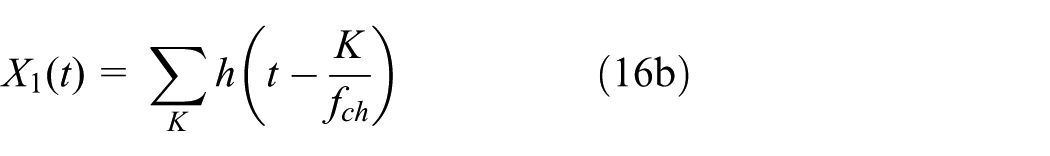
The simulation signal has been used to compare the performance of SWD, EMD, and EWT methods. The mathematical formulations corresponding to this signal are presented in following equations:


where X1, X2, and X3 are the components of the simulated signal X(t). This signal is generated with sampling frequency of 3000 Hz in the interval [0, 1]. In Figure 1, the simulated signal, its components and frequency domain distribution are illustrated. As can be seen in the frequency spectra of components, the main frequencies of the simulated signal are three values 200, 350, and 700 in Hz and their harmonics.

The simulated signal with its components and frequency spectrum.
The results of decomposition of the simulation signal using the EMD method are shown in Figure 2. As can be seen in this figure, some of the information about the simulation signal components appears in the first three IMFs. In other words, these modes are indistinguishable from each other, and this phenomenon indicates the problem of mixing modes in these three IMFs. On the other hand, the rest of the intrinsic mode functions (IMFs 4–9) are meaningless and do not contain much information about the original signal. The spectra frequency of IMFs is presented in Figure 3. According to this figure, frequencies of 350, 200 Hz in the IMF 1 spectrum and the frequency of 200 Hz in the IMF 2 spectrum are seen. This confirms the existence of the modes mixing phenomenon in IMF 1 and IMF 2. Also, the lack of main frequencies in the spectrum of IMFs 4–8 indicates that none of these components are useful.

The intrinsic mode functions of the simulated signal.
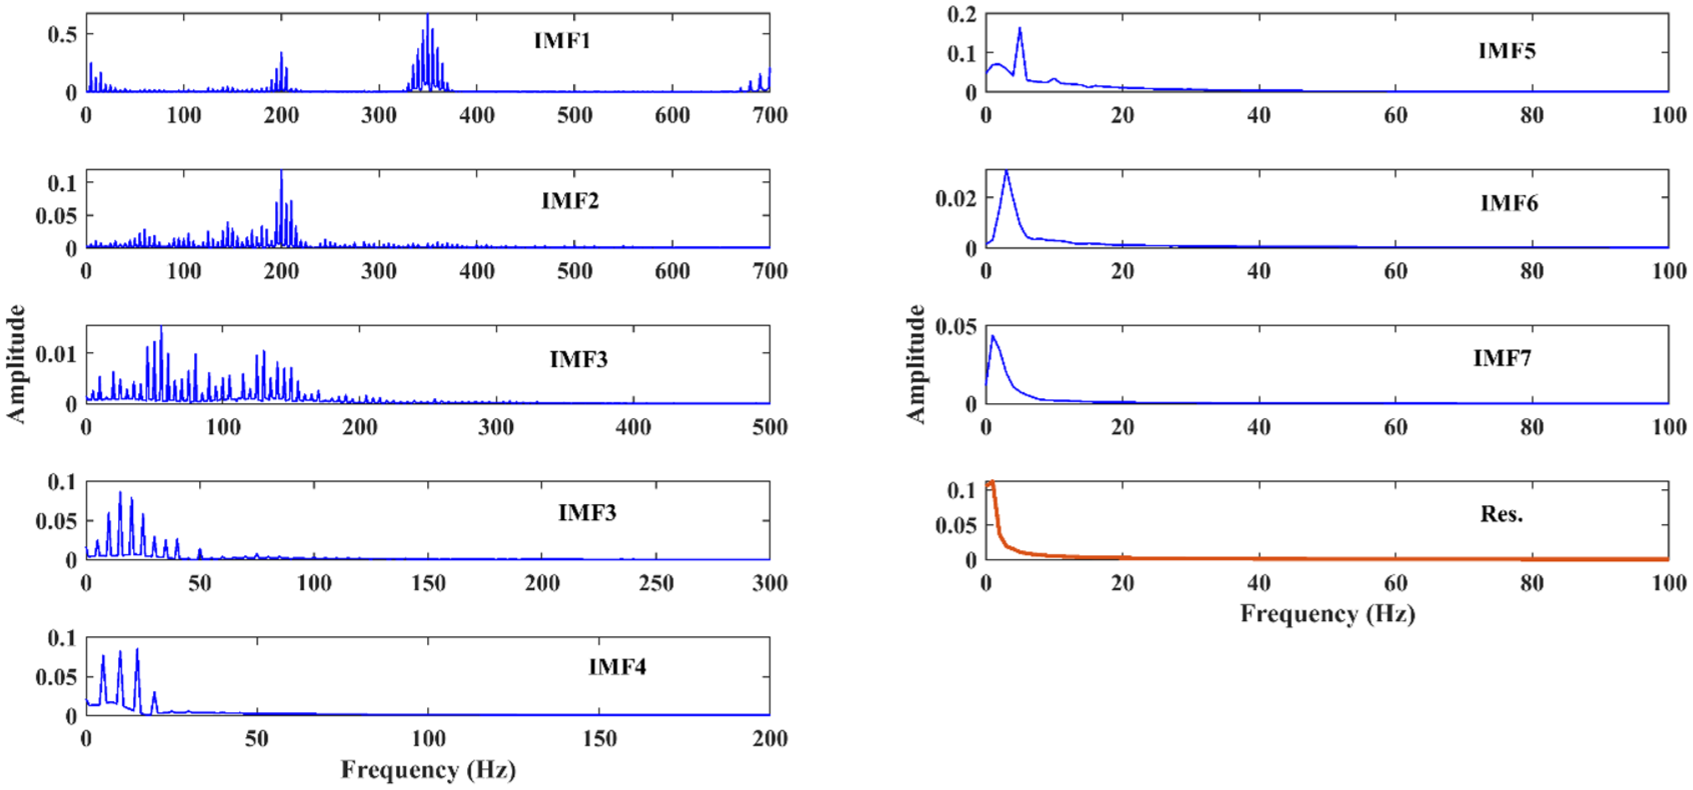
The frequency distribution of the IMFs obtained by EMD.
Figures 4 and 5 show the empirical modes obtained by EWT, and their frequency spectra, respectively. As shown in Figure 4, the modes 3, 4, and 5 are similar to the main signal components that is X1(t), X2(t), and X3(t), respectively. On the other hand, the emergence of frequencies of 200, 350, and 700 Hz in the spectrum of the third to fifth modes (see Figure 5) shows that these modes are the most informative empirical modes. However, existing weak and meaningless modes such as Mode 1 and Mode 2, which do not have any useful information from the signal, indicate the weakness of the EWT technique in extracting information from a multi-component signal.

The empirical modes of the simulated signal obtained by EWT.
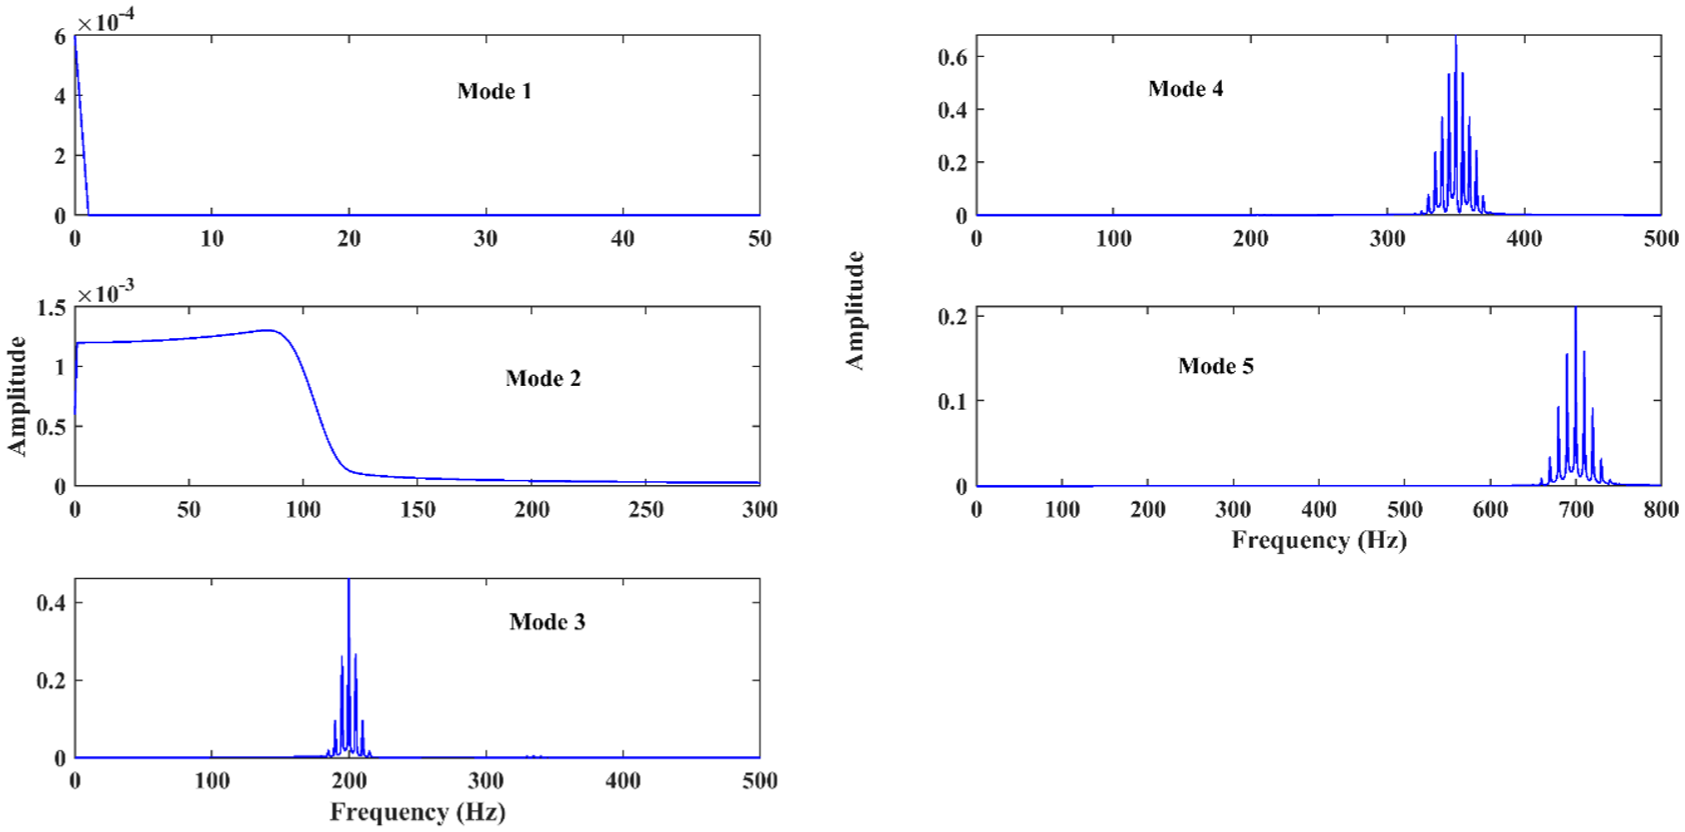
The frequency distribution of the empirical modes.
The SWD method is applied to the simulation signal and decomposes it into three oscillatory components. These OCs are indicated in Figure 6. As can be seen, OC 1, OC 2, and OC 3 are very well matched to components X3(t), X1(t), and X2(t), respectively. The frequency distributions of the oscillatory components OC 1 to OC 3 are plotted in Figure 7. Two points can be seen in this figure: (1) the characteristic frequencies of the simulated signal appear well in the obtained spectrum. (2) The non-interference of the frequency spectrums indicates that the modes obtained by the SWD are independent.
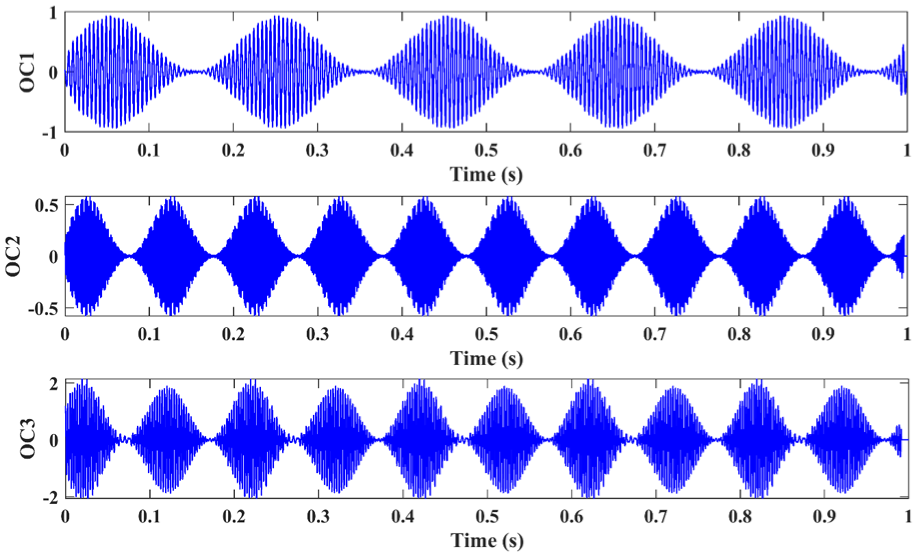
The oscillatory modes of the simulated signal obtained by SWD.

The frequency distribution of the oscillatory modes of the simulated signal.
The above observations show that the SWD technique is more efficient than the relatively new EMD and EWT methods in analyzing the completed and multi-component signals.
The problem of the SWD
From the analysis of the above results, it can be seen that the SWD has a better efficiency in solving the problem of modes mixing and extracting the weak features from the multi-component signals. However, it should be noted that the SWD technique with different parameters lead to very different decomposition results which are not necessarily suitable for the fault detection purposes. In fact, the choice of threshold parameters P
th
and StD
th
significantly affects the performance of the new SWD analysis method. These parameters control the number of oscillatory modes extracted at the end of the decomposition process. By selecting smaller values for these two thresholds, the SWD method extracts more oscillatory modes from the signal. Thus, the computational volume increases, and the signal decomposition becomes more complex.
30
The recommended values in Apostolidis and Hadjileontiadis,
30
which are P
th
= 0.1 and
Improved SWD
The objective function is an important factor in improving the SWD method and determining the P th and StD th threshold parameters. In this work, to have an effective optimization and increase the efficiency of SWD, a simple cost function is used which is based on three indicators: kurtosis, correlation coefficient, and orthogonal index (OI). The goal of the improved SWD (ISWD) method is to extract the meaningful features from the non-stationary vibration signals. The kurtosis index is highly sensitive to impulses produced by the rotary machine defects while this quantity is insensitive to machine operating conditions. In the previous studies, this factor was used as an indicator to monitor the machine conditions and diagnose faults. In fact, the kurtosis depends only on the distribution density of the signal impulses. As a result, if the kurtosis index is used as an objective function for optimizing the SWD method, it is possible that some impulses with large amplitude will be removed from the oscillatory components as the kurtosis index is maximized. The correlation coefficient determines the similarity between the two signals. It is always expected that the obtained components will be as similar as possible to the original signal and will contain a large share of its information. Theoretically, an ideal component has the same behavior as the sinusoidal signal, and both sinusoidal signals are orthogonal. Therefore, OI can be used as a reference indicator to assess the quality of the components derived by SWD. Taking into account the strengths and weaknesses of these indicators, a hybrid criterion is defined as the objective function for optimizing the SWD method and determining the key parameters of this method as follows:


where N is the number of the resulting modes, Kurt
i
is the kurtosis value of the ith OC, and
In the definition of the OI index in equation (14), consistent with Huang et al., the denominator is considered to be the total signal energy rather than the sum of energies of the extracted components. This choice ensures numerical stability in the presence of low-amplitude components. Moreover, since the denominator of OI remains independent of the design parameters, variations in OI exclusively reflect the level of orthogonality among the components.
The structure of the objective function in equation (13) is formulated based on three fundamental principles in vibration signal processing:
Detecting impulses caused by the presence of a fault
Preserving similarity between the extracted oscillatory components and the original signal to prevent the components from becoming physically meaningless
Ensuring independence among the components to avoid generating redundant or overlapping components
These three principles are accomplished respectively through the use of kurtosis, cross-correlation coefficient, and orthogonality index. Fault-related signals that contain repetitive impacts typically exhibit high kurtosis; therefore, this statistical measure is widely used for detecting faults in rotating machinery. On the other hand, if kurtosis alone is used to determine SWD parameters, it may result in components with high kurtosis simply due to the presence of high-amplitude noise, while such components may in fact be unrelated to fault presence. To resolve this issue, the cross-correlation coefficient between each component and the original signal is added to the objective function as a means of retaining the useful information content of the signal. By incorporating this correlation, components that do not convey information from the original signal are naturally excluded during the optimization process. Furthermore, signal decomposition methods may produce components with high mutual correlation, resulting in redundant information and decreased effectiveness. To avoid this phenomenon, the orthogonality index is included in the denominator of the objective function, directing the optimization process toward producing a set of non-redundant and mutually independent components. Therefore, the structure of equation (13) as an objective function implements a multi-objective strategy, which not only enhances the features related to fault detection but also improves the mathematical and physical quality of the extracted components.
If equation (13) is used as the objective function for the SWD optimization problem, it seems that the impulses from the faults in the various components of rotary machines appear in the OCs and at the same time, these OCs retain their resemblance to the original signal. In this article, the PSOSCALF optimization algorithm is used to determine the optimal values of the P th and StD th threshold parameters. The range of changes of these parameters is considered in the interval (0, 1). Based on the above, the issue of optimizing the ISWD method can be written as follows:

The implementation steps of the ISWD method which is used to analyze vibrational signals are summarized in Figure 8. The ISWD process details are as follows:
The vibration signal is considered as the input and the parameters of the PSOSCALF algorithm are initialized. In general, the number of population, npop, and the maximum repetitions, MaxIt, in PSOSCALF have been considered equal to 10 and 20, respectively. At the beginning of the optimization process, initial values are assigned to the design parameters P th and StD th .
New particles are produced during the optimization process using the velocity and position updating relationships in the PSOSCALF approach.
The kurtosis index, the correlation coefficient of the OCs obtained by the SWD and the cost function in equation (15) are calculated for all particles. If the iteration number t is equal to or more than MaxIt, the optimization is stopped, otherwise the optimization process continues and the iteration number is updated as t = t + 1.
The values of the parameters P th and StD th that lead to minimize the new criterion presented in equation (15) are considered as optimal parameters.
The signal is decomposed into its oscillatory components by SWD with the optimal parameters.
The frequency spectrum for each OC is calculated and analyzed.

The flowchart of the ISWD technique for decomposing the vibration signals.
Application of ISWD for simulated signal
In this section, a simulated mechanical vibration signal is used to evaluate the effectiveness of the proposed ISWD technique and its comparison with other signal processing methods. The mathematical formula of the signal corresponding to the intermittent impulsive responses due to the presence of a defect in the bearing is as follows 28 :


where A = 0.5 is the amplitude of the impulse response, ζ= 0.1 is the damping ratio,

Noise-free signal, added noise, and noisy signal.
Here, the results of the ISWD proposed method are compared with the EMD, EWT, SWD, and OSWD techniques. In OSWD, the WOA optimization algorithm was used to determine the optimal SWD parameters during the signal decomposition process. An indicator that had been used as the cost function in OSWD was the kurtosis of the envelope spectrum of vibration signals. 31
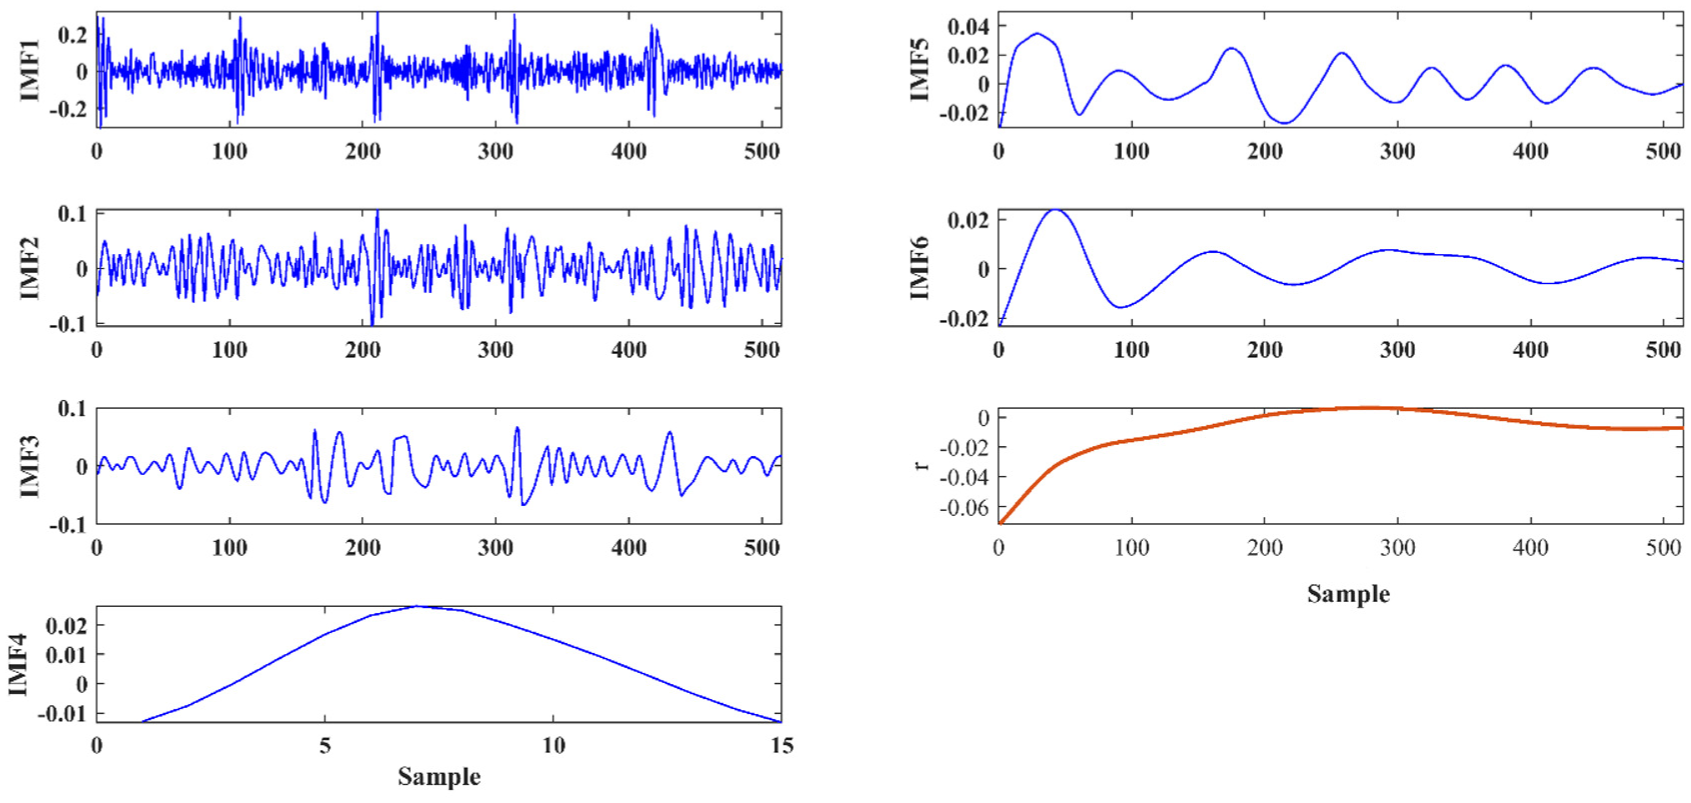
The IMFs resulting from the decomposition of the simulated signal are shown Figure 10. Also, the envelope spectrum of the IMFs of noisy signal is presented in Figure 11. As seen in Figure 10, among the entire signal IMFs, only IMF1 contains information about impulses that appear due to a fault and other signal IMFs don’t give us much information about the intermittent shocks. In other words, IMFs 2–6 are meaningless and do not have a specific physical interpretation. The same behavior can be seen in their spectrum. According to Figure 11, only in the IMF1 envelope spectrum, the fault frequency characteristic and its harmonics appear. These frequencies are marked with the arrow “↓.” In fact, the envelope spectrum of other IMFs do not appear a specific frequency and there is not much information about the fault in them.
The results of the EMD method for simulated signal shown in Figure 9.

Envelope spectrum of the intrinsic mode functions of the simulated signal.
The empirical modes and their envelope spectrum which are the result of processing the simulation signal with the help of EWT method are shown in Figures 12 and 13, respectively. As shown in Figure 12, of all the obtained modes, only Mode 4 has the most information about the simulation signal, and certain features cannot be extracted in other obtained empirical modes. The same results can be seen in the envelope spectrum shown in Figure 13. According to this figure, the characteristic frequency of the fault and its harmonics appear only in the fourth mode.

The results of the EWT method for simulated signal shown in Figure 9.

Envelope spectrum of the empirical modes of the simulated signal.
The results are presented in Figure 14 after processing the simulation signal using the SWD technique. As shown in Figure 14, among all the obtained components, the impulsive behavior of the simulation signal in the second component and to some extent in the third component has emerged. The same result can be seen in their frequency distribution in Figure 15. On the other hand, the fourth and fifth components are exactly similar, and this phenomenon can be considered as one of the weaknesses of the SWD technique in extracting independent components.

The OCs of the simulated signal obtained by SWD for simulated signal.
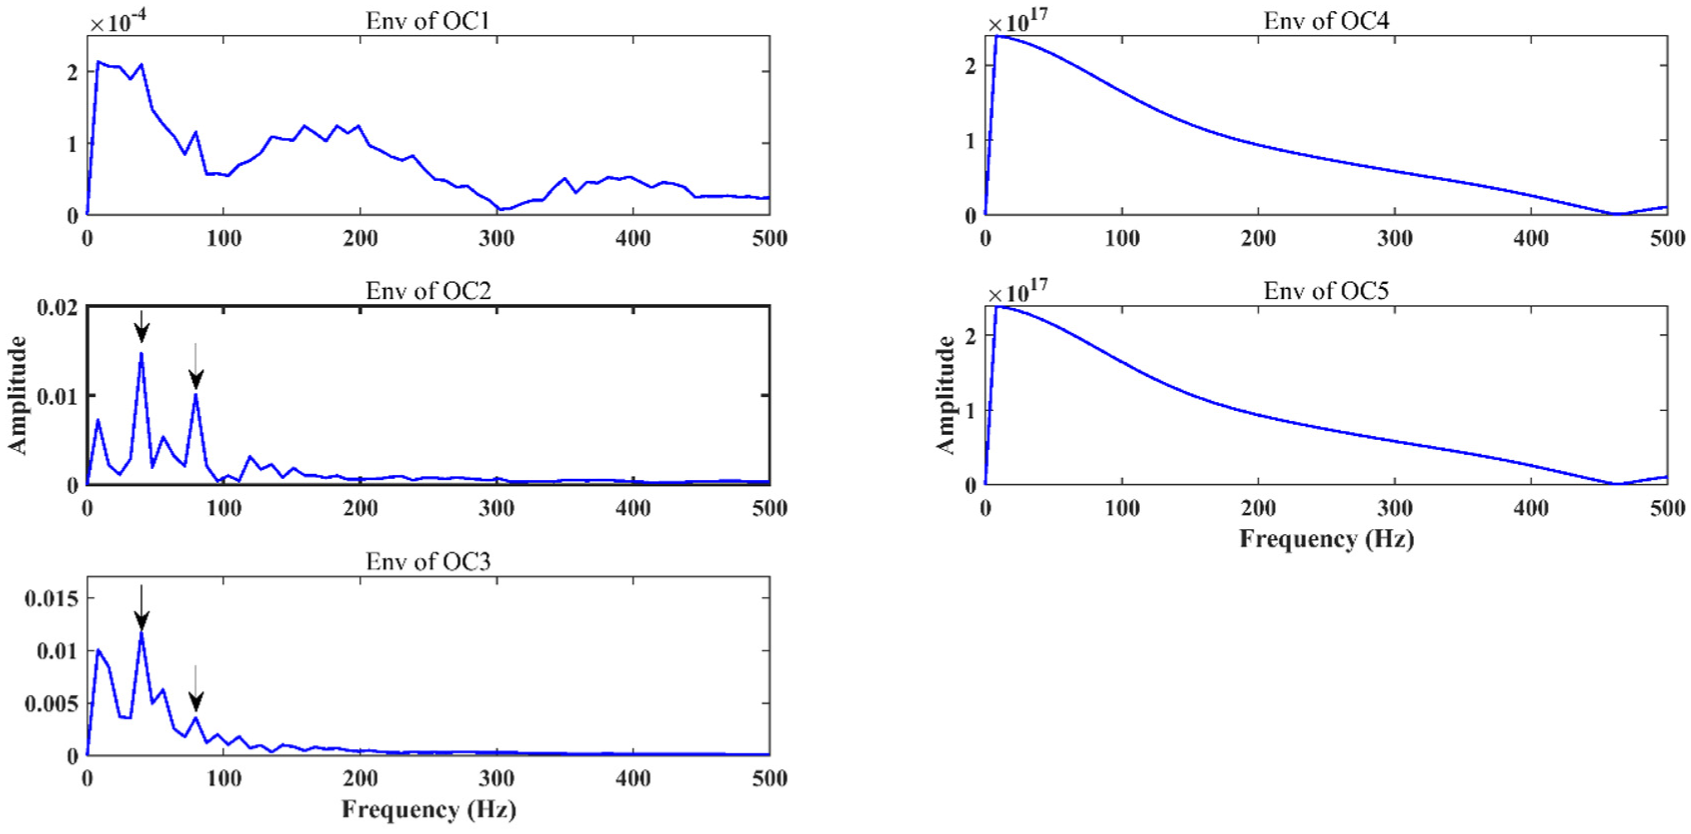
The envelope spectrum of the OCs obtained by SWD.
The oscillatory components obtained by the OSWD approach and their frequency spectrum are plotted in Figures 16 and 17, respectively. The OSWD method has better results than the original SWD method. As can be seen, the fault impulses have appeared in the second to fifth oscillatory components, and the frequency information of these impulses can be seen in the spectrum of the mentioned OCs. However, among the obtained components, the first component does not contain any impulses produced by the fault location. The absence of the characteristic frequency and its harmonics in the spectrum of the OCs confirms this fact.
The OCs of the simulated signal obtained by OSWD for simulated signal.
The envelope spectrum of the OCs obtained by OSWD.
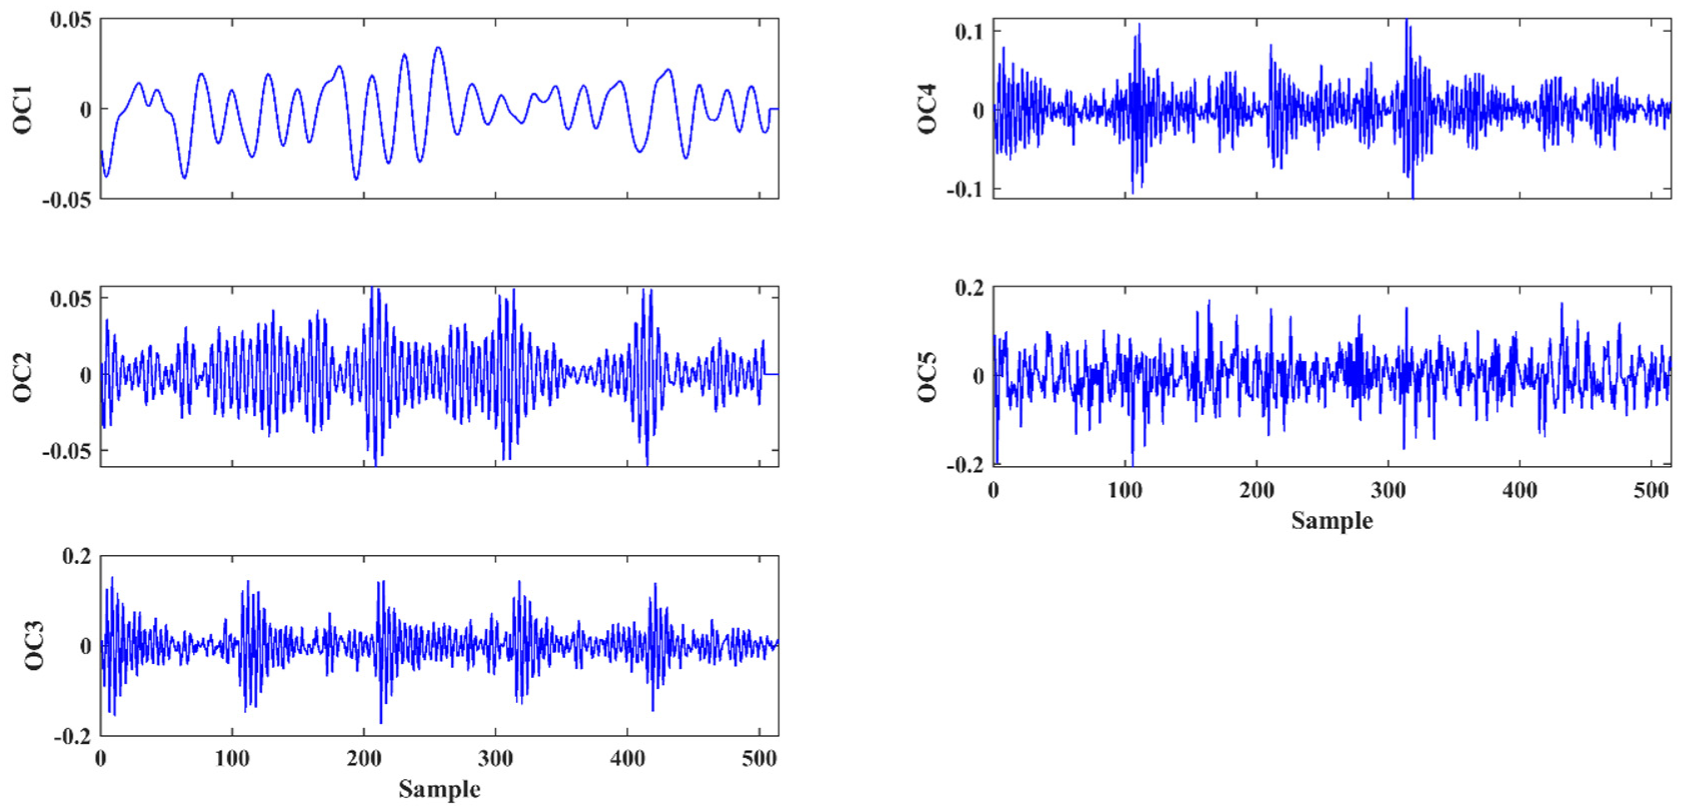
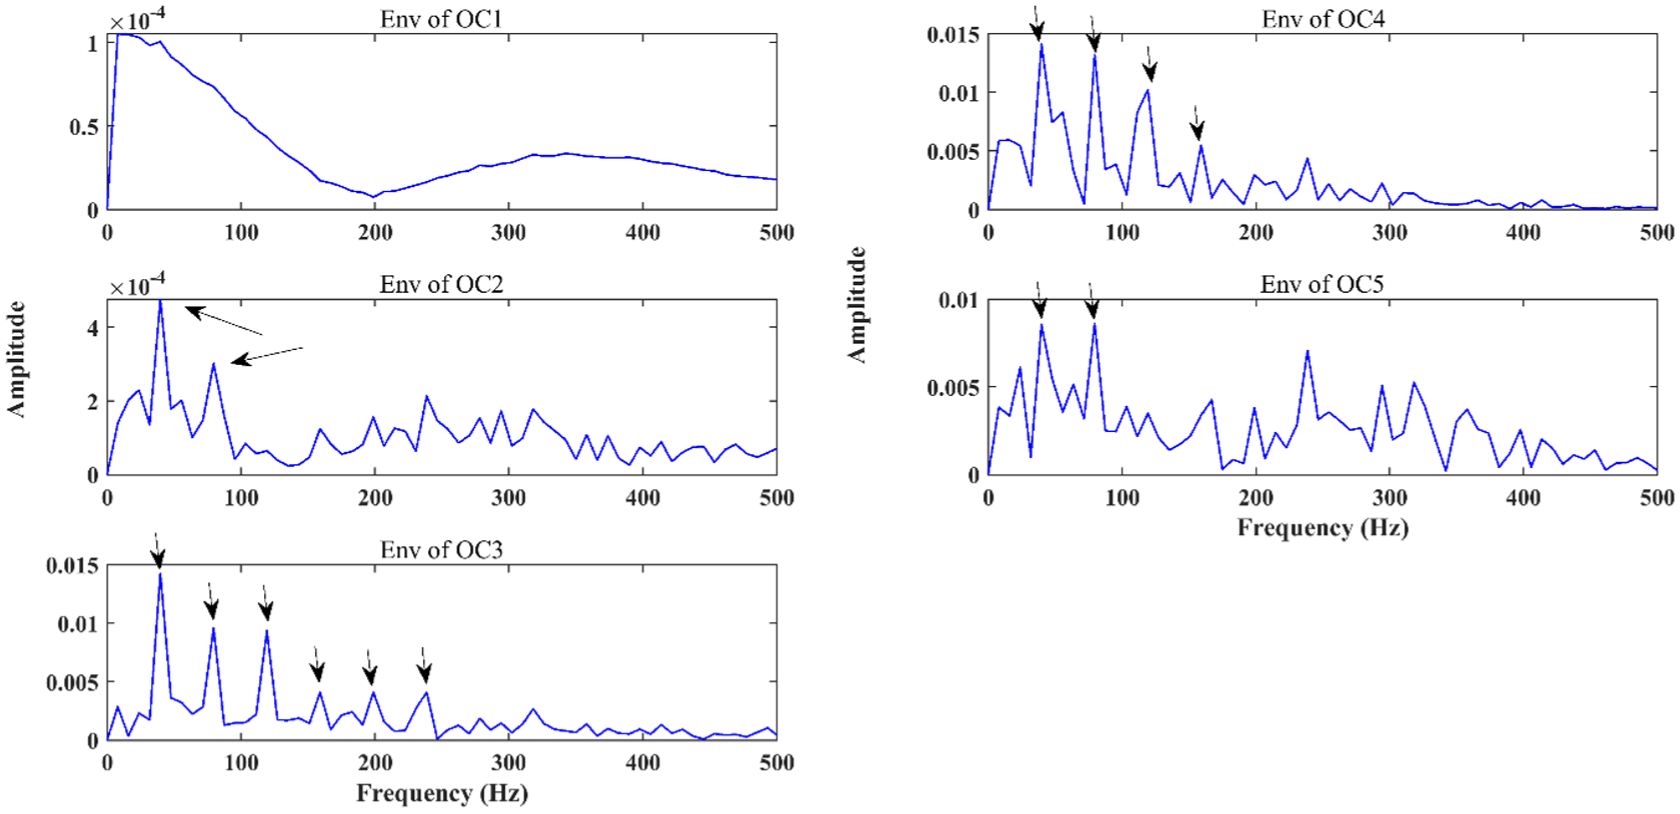
Finally, the results of the implementation of the proposed ISWD method are shown in Figure 18. According to this method, unlike other methods, with the use of ISWD, only two OCs have been obtained. On the other hand, the repetitive nature of the first OC is most similar to the periodic behavior of the impulses of simulated signal, and this feature is slightly more colorful in the second OC. Also, the presence of characteristic frequencies and its harmonics in the spectrum of these two components indicates the existence of a repetitive phenomenon in the main signal. Based on the interpretation given above, it can be concluded that the ISWD method is superior to the other methods discussed here in extracting the properties associated with fault impulses.

The oscillatory components obtained by ISWD and their envelope spectrum for the simulated signal.
Since the components extracted by ISWD clearly exhibit the fault characteristic frequency and its corresponding impulsive behavior consistent with the physical model of the defective bearing, the term “physically meaningful components” can therefore be used to refer to the outputs of ISWD.
The analysis of the decomposition results obtained from the simulated signal using SWD, OSWD, and ISWD strongly validates the proposed objective function in equation (13). Based on Figures 16 and 17, the OSWD approach produced an oscillatory component (OC1) whose envelope spectrum contains no information regarding the fault characteristic frequency or its harmonics. This indicates that optimization based solely on kurtosis cannot guarantee that all extracted components contain fault-related impulses or share similarity with the original signal.
In contrast, the ISWD method (Figure 18) extracts only two components, both of which clearly contain repeated impulses attributable to the fault. Their envelope spectra visibly demonstrate the fault characteristic frequency and its harmonics. This outcome is a direct result of simultaneously integrating kurtosis and cross-correlation into the numerator of the objective function, which both maintains sensitivity to fault impulses and prevents the appearance of irrelevant components.
Additionally, beyond the correlation term, the presence of the orthogonality index in the denominator prevents unnecessary duplication of false or redundant components (similar to OC4 and OC5 in the SWD method shown in Figures 14 and 15).
Application of ISWD for the bearing fault diagnosis
Experimental data set
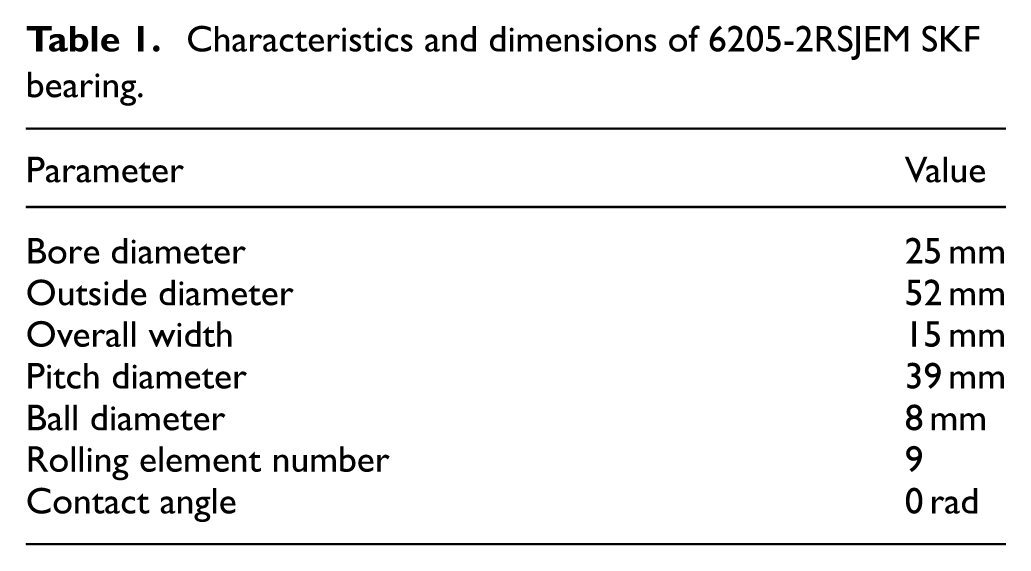
The laboratory set introduced by the Case Western Reverse University (CWRU) website is a valid reference for vibration data corresponding to various defects of bearings with different sizes obtained at different rotational speeds. 43 This data had been widely used by researchers to demonstrate the effectiveness of their proposed algorithms.13,23,29,44–46 A schematic illustration of the experimental system is shown in Figure 19. The main components of this set include an induction motor (left), torque converter and coupling (middle), and dynamometer (right) and bearings. The motor shown in Figure 19 has a power of 2 hp and it had been used as the main driver to move the shaft coupled to the bearing housing. Also, an electrical circuit had been used to control speed and create different rotary speeds (1730–1797 rpm) to obtain the data under the different operating conditions. The vibration data are collected by accelerometers mounted on the motor housing with the magnetic bases at the sampling frequency of 12 kHz. The accelerometers are installed on the bearing at 12 o’clock position. These sensors are capable of capturing data in a wide range of temperatures from −50°C to 120°C. These sensors have a small mass and size, and cover a wide range of sampling frequencies. Defects are generated by electrical machining methods. The bearings used in this setup are SKF 6205-2RS JEM. The geometric characteristics of these bearings are presented in Table 1. The flaws in the main components of bearings have the depth of 0.011 and different diameters from 0.007 to 0.021 in inches.

The experimental setup and its main parts. 43
Characteristics and dimensions of 6205-2RSJEM SKF bearing.
The envelope spectrum analysis of the vibration signals is one of the prevalent techniques in identifying the defects of bearings and gears. Each component of the bearing has its own frequency, which is called the characteristic frequency, and is a function of the geometric characteristics of the bearing and the rotational speed of the shaft. When one of the bearing parts fails, its characteristic frequency and its harmonics appear in the envelope spectrum. The characteristic frequencies of the inner ring and the outer ring are calculated using the following equations 29 :
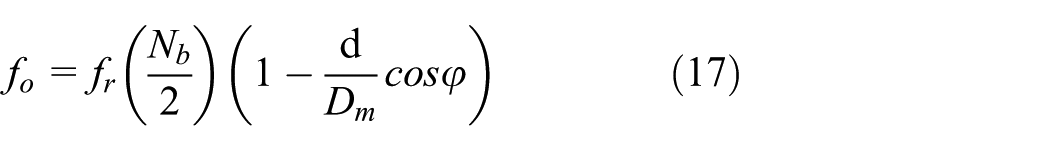

where f o and f i are the characteristic frequencies for the outer ring and the inner ring, respectively. f r is the shaft rotational frequency. N b is the rolling elements number, d is the diameter of rolling element, D m is the pitch diameter, and φ is the contact angle. According to Eqs (17) and (18), the characteristic frequencies f i and f o for f r = 1797 rpm are equal to 162.18 and 107.36 Hz, respectively.
Case 1: The faulty inner ring
In this subsection, the application of the proposed ISWD method for identifying the defects of the inner ring of bearings is presented. For this purpose, a vibration signal corresponding to the defective inner ring with a defect size of 0.007″ and the shaft speed of 1797 rpm has been used. This signal is illustrated in Figure 20. Also, in order to investigate the role of PSOSCALF algorithm and the proposed objective function in equation (1) in ISWD technique, the results of the proposed approach have been compared with other techniques such as EMD, EWT, SWD, and OSWD methods. When a fault occurs in the inner ring of the bearing, the characteristic frequency of the inner ring and its harmonics and the rotational frequency of the shaft and its second harmonic appear in the signal spectrum.
The vibration signal for the faulty inner ring case corresponding to the fault size of 0.007″ and rotational speed of 1797 rpm.
The results of analyzing the signal (shown in Figure 20) using the EMD method are presented in Figure 21. Also, the frequency distribution of IMFs of the defective inner race signal is shown in Figure 22. Due to the signal IMFs and their frequency spectrum, not all signal components contain useful information about the status of the bearings. In other words, in the IMF4 spectrum onwards, none of the characteristic frequencies of the bearings have appeared. Another point that can be seen in Figure 21 is the attendance of impulses in the components of IMF1, IMF2, and IMF4 due to create the bearing defect. The spectrum of these IMFs emphasizes this actuality. In fact, emerging the frequencies of f r , 2 × f r , f i and 2 × f i in the IMF1 spectrum, the frequencies of f r and f i in the IMF2 envelope spectrum and the frequencies of f i and 2 × f i in the IMF3 spectrum can be signs of the fault in the inner ring.

Intrinsic mode functions obtained by EMD for the faulty inner ring case.

The envelope spectrum of the IMFs of the faulty inner ring signal.
The experimental modes obtained by the EWT approach and their envelope spectrum are shown in Figures 23 and 24, respectively. Due to the empirical modes of the signal and their frequency distribution, it can be realized that mode 1, mode 3, mode 4, mode 10, and mode 11 do not contain any information about the defective inner ring. This fact demonstrates the incapacitation of the EWT method to extract the features from the vibration signals. On the other hand, in the spectrum of modes such as mode 2, mode 8, and mode 9, only the first harmonic of frequencies f i and f r are observed, respectively. There are more of these frequencies in the envelope spectrum of the sixth and seventh modes.
Empirical modes obtained by EWT for the faulty inner ring case.

The envelope spectrum of empirical modes of the faulty inner ring signal.
The results of decomposing the aforementioned vibration signal by the SWD, OSWD, and ISWD techniques are given in Figures 25 to 28. After processing the simulation signal using SWD and OSWD techniques, it was observed that the oscillatory components obtained by SWD are exactly the same as the OSWD results. In fact, the results represent that the SWD results do not improve with the use of the WOA optimization algorithm and the kurtosis index as the objective function. In other words, the target function used in OSWD, which is based on the kurtosis of envelope spectrum of the signal components, is an inappropriate choice for determining the key parameters of the swarm decomposition method. Examination of the envelope spectrum of OCs obtained by SWD and OSWD approaches in Figure 26 indicates that the oscillatory components of OC1 to OC4 do not include much information about the characteristic fault frequencies and their harmonics. The faulty inner ring-related frequencies have also appeared in the frequency distribution of the OC5 to OC7 components.

Oscillatory components obtained by the SWD and OSWD techniques for the faulty inner ring case.
The envelope spectrum of the oscillatory components obtained by SWD and OSWD for the faulty inner ring signal.
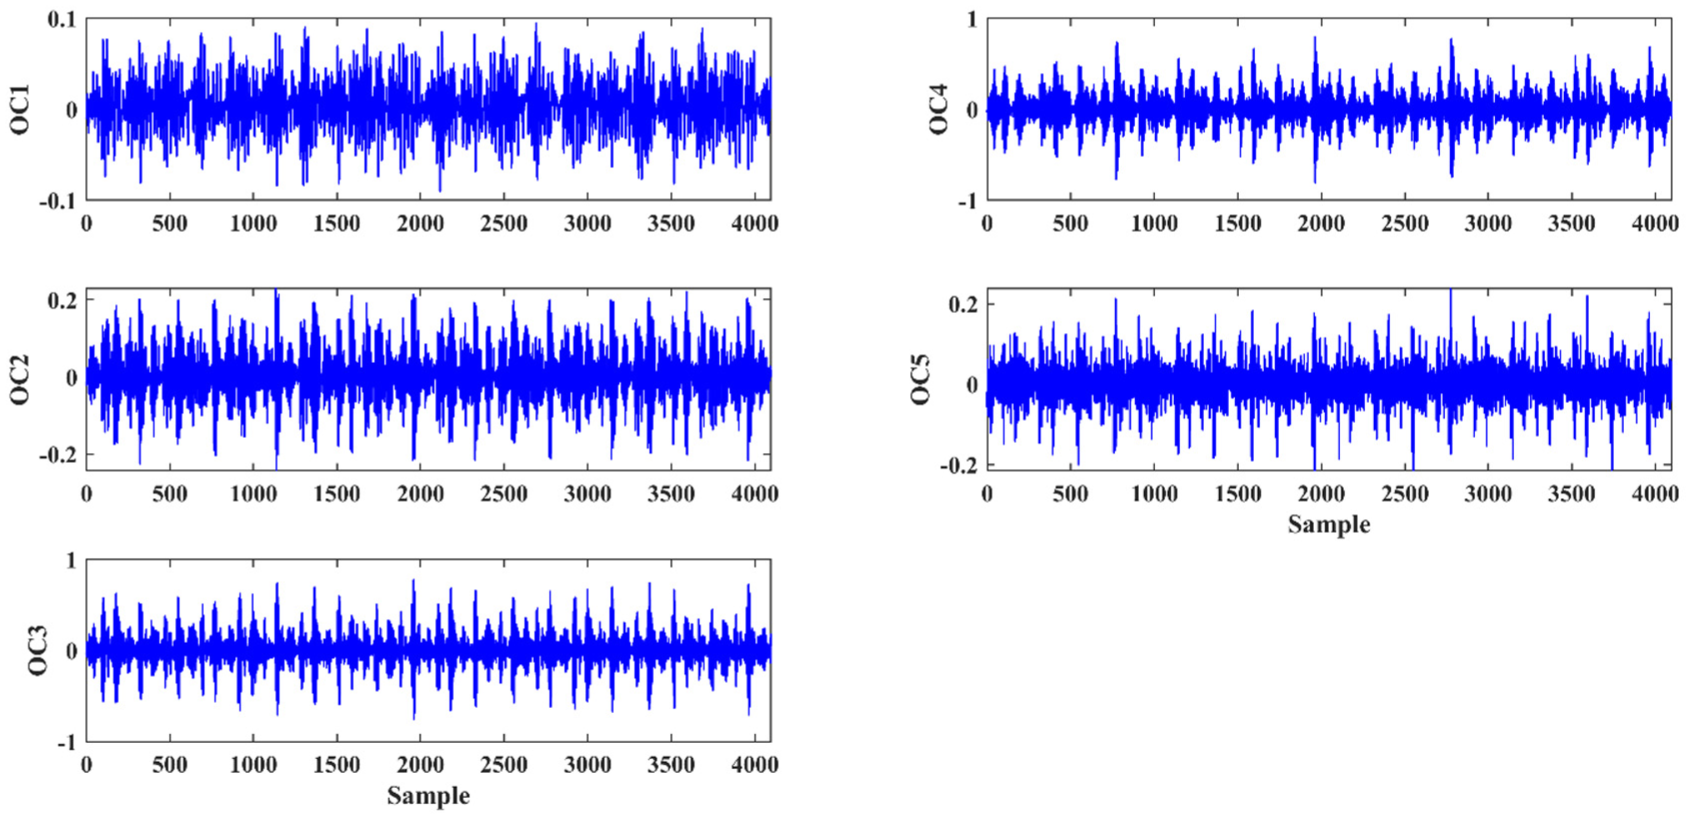
Oscillatory components obtained by the proposed technique for the faulty inner ring case.

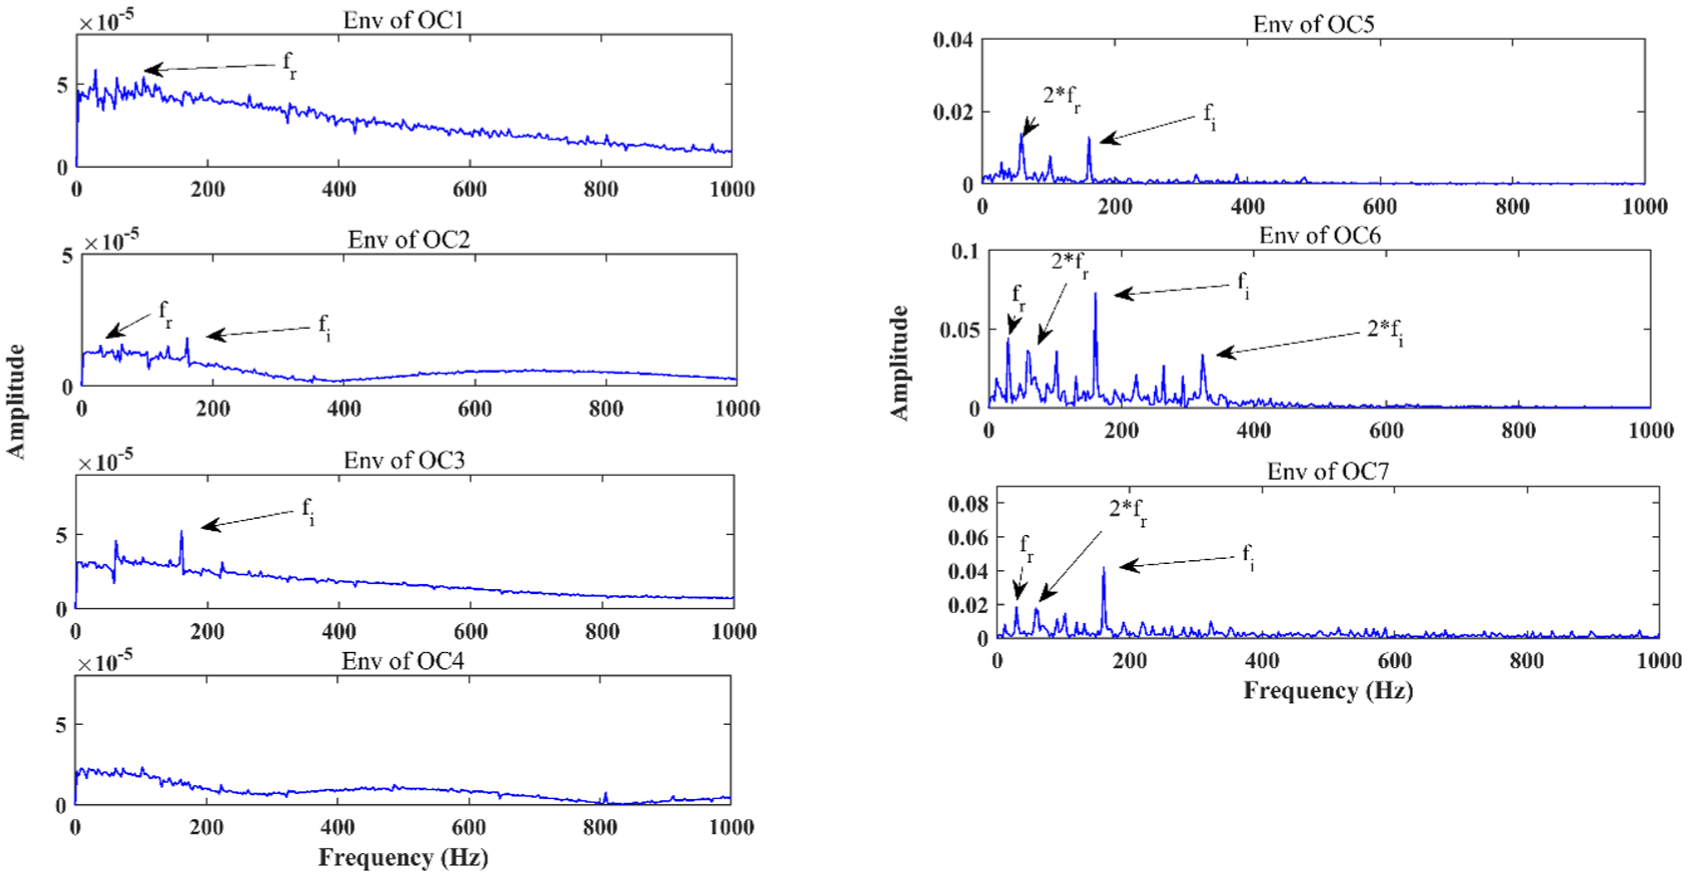
The envelope spectrum of the oscillatory components obtained by ISWD for the faulty inner ring signal.
Figures 27 and 28 indicate the oscillatory components resulting from applying the proposed ISWD method and their corresponding frequency spectrum, respectively. The number of components provided by ISWD is less than the two methods SWD and OSWD. On the other hand, the impulses of fault have appeared in all five oscillatory components obtained by ISWD. In other words, each of the five components of OC1 to OC5 can reflect the impulsive behavior due to the presence of a defect in the inner ring. This point can be clearly diagnosed on Figure 28. As can be seen in this configuration, each of the spectra related to these components alone indicates the existence of the fault in the inner ring.
Case 2: The faulty outer ring
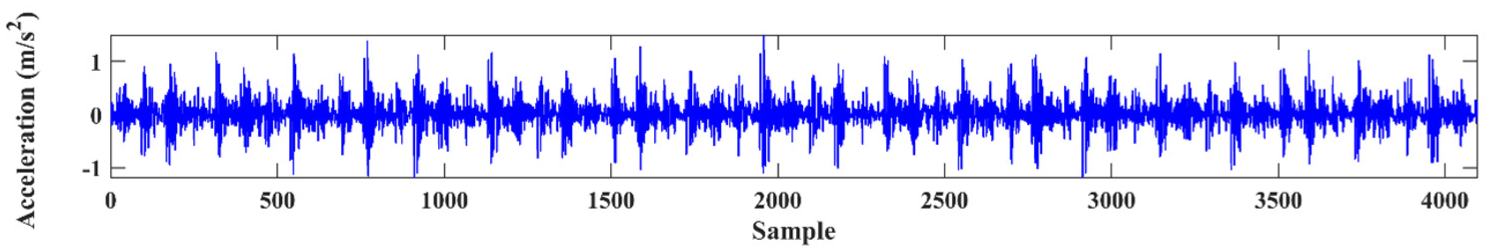
The second case study is related to the diagnosis of defects in the outer ring of bearings. Here, the ISWD technique is used to detect the early faults in the outer ring element. The created defect had a size of 0.007″, and the analyzed signal was acquired at the rotational speed of 1797 rpm. This signal is shown on Figure 29. The ISWD results are then compared with other signal processing methods to evaluate the presented technique.

The vibration signal for the faulty outer ring case corresponding to the fault size of 0.007″ and rotational speed of 1797 rpm.
The intrinsic mode functions of the vibration signal and their frequency distribution are illustrated in Figures 30 and 31, respectively. As can be seen in these illustrations, the first IMF has the largest share of information from the vibration signal. On the other hand, the IMFs 5–10 are meaningless components and do not give us much information about the conditions of the bearing.

Intrinsic mode functions obtained by EMD for the faulty outer ring case.

The envelope spectrum of the IMFs of the faulty outer ring signal.
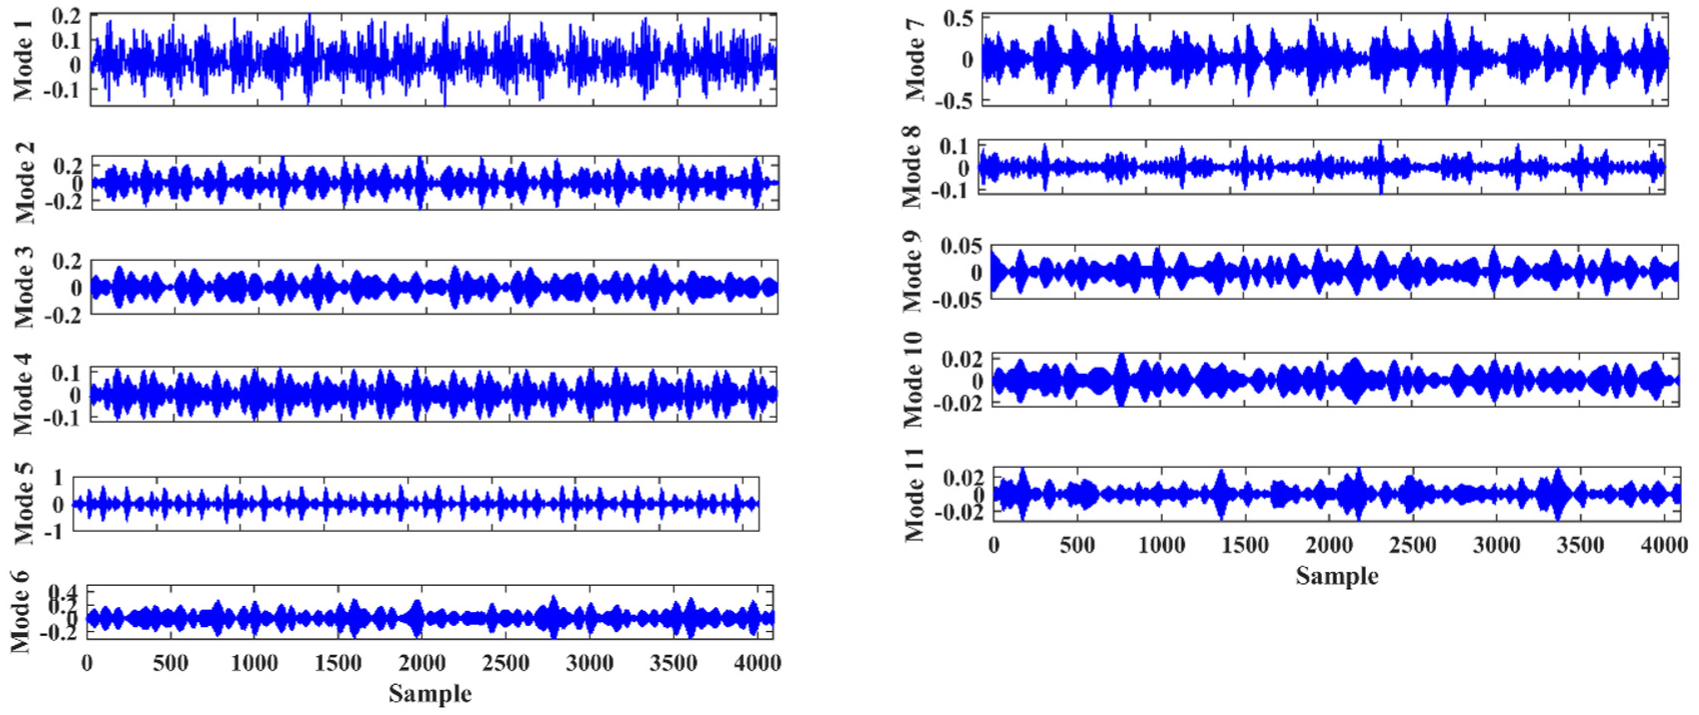
The results of the signal analysis using the EWT method are presented in Figures 32 and 33. The envelope spectrum of the signal empirical modes in Figure 33 indicates that the EWT, similar to the EMD, yields many unmeaning modes (Mode 1–Mode 6) that are ineffective for extracting the frequency features. However, the characteristic frequency of the outer ring and some of its harmonics are seen in the spectrum of the components Mode 7 to Mode 10 (see Figure 33). According to Figure 32, this reality can be observed as the appearance of the main vibration signal impulses in the seventh to tenth modes.

Empirical modes obtained by EWT for the faulty outer ring case.

The envelope spectrum of empirical modes of the faulty outer ring signal.
The vibration signal is processed using SWD and OSWD methods, and the oscillatory components and their envelope spectrum are plotted in Figures 34 and 35, respectively. In this study, the signal was decomposed several times using the OSWD approach and it was observed that the obtained results were exactly the same as the SWD results. In other words, the OSWD method does not take precedence over the SWD technique in the analysis of the second case study. The same point was perceived in analyzing the vibration signal corresponding to the defective inner race. Correspondent to Figure 34, the SWD and OSWD methods decompose the vibration data into three components. As can be seen in the spectrum of the oscillatory components in Figure 35, the characteristic frequency, f o , and a large number of its harmonics (2 × f o , 3 × f o , 4 × f o , 5 × f o , … .) have appeared in the spectrum of the second and third components. However, in OC 1, except for frequencies f o and f r , no specific frequency is viewed.

Oscillatory components obtained by SWD and OSWD for the faulty outer ring signal.

The envelope spectrum of the oscillatory components obtained by SWD and OSWD for the faulty outer ring signal.
The curves related to the obtained components after applying the proposed ISWD method to the vibration signal are demonstrated in Figure 36. The frequency spectrum of these components is calculated and represented in Figure 37. As can be seen, the number of components determined by the ISWD technique is greater than the SWD and OSWD methods. On the other hand, the impulses generated because of presentment of the damages are seen in all four components. The frequency distribution shown in Figure 37 proves the superiority of the proposed ISWD method over EMD, EWT, SWD, and OSWD techniques. As can be seen in Figure 37, the characteristic frequency and the large number of its harmonics in the envelope spectrum of all four components resulting from the proposed technique have emerged. In other words, the spectrums of these components in Figure 37 display that all the components attained by ISWD are physically meaningful and informative, and each alone reverberates the working conditions of the bearings.

Oscillatory components obtained by the proposed technique for the faulty outer ring case.

The envelope spectrum of the oscillatory components obtained by ISWD for the faulty outer ring signal.
Conclusion
The main subject of this article was the improvement of the SWD signal processing method for diagnosing bearings. For this purpose, a new index was defined as the objective function to determine the key SWD parameters. In this objective function, three factors the kurtosis value, the cross-correlation, and the orthogonal index were used to extract meaningful components. The PSOSCALF optimization algorithm was then used to minimize the objective function and determine the optimal values of the SWD technique. The proposed technique was evaluated by the simulation signal and compared with EMD, EWT, SWD, and OSWD methods. Then, the proposed approach was used to troubleshoot bearings in two cases: defective outer ring and defective inner ring. The results showed that the ISWD method was able to extract the meaningful components from the signals, and each of these components contains useful information about the status of the bearing. Also, investigation of the frequency spectrum of the obtained components shows that the quality of the ISWD results is superior to other methods in appearing information about the bearing conditions.
For future works, the ISWD technique presented in this study can be used for the following three cases:
Applying ISWD method to enhance the intelligent fault detection techniques for rotating machines
Applying ISWD approach to denoise the vibration signals acquired from the rotary machines
Footnotes
Handling Editor: Zuzana Murčinková
Ethical considerations
This article does not contain any studies with human participants or animals performed by any of the authors.
Author contributions
Saeed Nezamivand Chegini: Conceptualization, Methodology, Investigation, Writing—Original Draft, Validation, Visualization, Data curation, Software. Milad Saadatmand: Conceptualization, Methodology, Validation, Formal analysis, Data curation, Writing—Review & Editing. Bahman Ahmadi: Conceptualization, Methodology, Validation, Writing—Review & Editing. Junghwan Kook: Conceptualization, Resources, Writing—Review & Editing, Supervision.
Funding
The authors disclosed receipt of the following financial support for the research, authorship, and/or publication of this article: This work was supported by the National Research Foundation of Korea (NRF) grant funded by the Korea government (MSIT) (RS-2025-24535535). This work was supported by the Glocal University 30 Project Fund of Gyeongsang National University in 2025.
Declaration of conflicting interests
The authors declared no potential conflicts of interest with respect to the research, authorship, and/or publication of this article.
Data availability statement
All data generated or analyzed during this study are included in this article.