
Abstract
The fan is one of the main aerodynamic noise sources in a high-bypass-ratio turbofan engine. It is easy to reduce the rotating speed of a geared fan by increasing the reduction ratio of the gear without changing the original structure of the turbofan engine. In this paper, the effect of the load coefficient on the geared fan aerodynamic noise was investigated, where the load coefficient was varied by changing the fan rotating speed. The acoustic fields of three fans were simulated by a combination of unsteady flow field calculation using ANSYS CFX and acoustic BEM calculation using LMS Virtual Lab. software. The main results are as follows. For the rotor alone, the tonal noise and broadband noise dramatically decrease when the load coefficient increases with a decrease in rotating speed, and the acoustic power level of the fan stage also decreases because of the decrease in rotor rotating speed. In particular, for the ultra-highly loaded fan stage (load coefficient 0.88), both noise and aerodynamic performance are better than those for the fan stage with normal load (load coefficient 0.3), the acoustic power of the fan stage is decreased by 11.71 dBA, the efficiency is increased by 0.012 and the surge margin is increased by 28.5%.
Keywords
Introduction
The fan is one of the main aerodynamic noise sources in a high-bypass-ratio turbofan engine. The fan noise can be divided into tonal noise and broadband noise. The broadband noise is caused by pressure fluctuation, which results from shedding vortices from the blade trailing edges, tip clearance vortices, and boundary layer separations. The tonal noise is caused by periodical pressure fluctuations, which result from the constant rotation of the rotor blade and the large pressure gradient induced by the shock waves in the blade tip.1,2 The acoustic power level is proportional to the fourth power of the blade tip speed, so the noise effectively decreases when the fan rotating speed decreases, and reducing rotor tip speed below the speed of sound could eliminate noise associated with the production of local shock waves.3–5 Thus, reducing the fan rotating speed becomes one of the main measures to reduce the fan noise.
DLR Germany, SNECMA, and COMOTI France have built a test platform for high-bypass-ratio geared turbofans in the European SILENCE (Significantly Lower Community Exposure to Aircraft Noise) project. In their research, based on the above viewpoint, the fan rotating speed was designed to be 10% lower than the advanced design level at that time. 6 Bewick et al. 7 redesigned a fan with a 15% smaller rotating speed than that of its prototype, maintaining the mass flow rate and total pressure ratio at the design point of the prototype. The results showed that the prototype with a large rotating speed generated tonal noise when its rotating speed was higher than 80% of the design speed, but the tonal noise of the redesigned fan with the relatively small rotating speed was cut down at the rotating speed, at which the aerodynamic performance was identical to that of the prototype. Finally, the tonal noise decreased by 5–10 dB, but the broadband noise remained nearly unchanged. Brown et al. verified the synergistic effect of low speed (70% of design rotating speed) on fan noise (reduction of 5–8 dBA) and efficiency (improvement of 0.5%–1%), and analyzed the matching stability of the fan-compressor-turbine system. 8 Garcia and Miller reduced the rotating speed of a high-bypass fan to the 75% of design rotating speed, and the results showed that the stall margin increased by 18%–25%, compared with design rotating speed. 9
If the total pressure ratio at the design point is fixed, the fan load coefficient inevitably increases with a low rotating speed, which increases the boundary layer thickness on the blade surfaces and wake sizes behind the blades and decreases the aerodynamic efficiency and steady operating margin.10,11 Liu and Liu investigated the flow mechanisms and sound propagation characteristics of three types of tonal noise, implementing the unsteady three-dimensional numerical simulation under different rotational speed matching for CRDF and isolated rotor. The results show that the decrease of the rotor speed leads to the decrease of the potential flow interference and wake intensity, resulting in the decreased sound pressure level. 12 Antoine and Sebastien thoroughly investigated the effect of the rotating speed on the aerodynamic noise at a given total pressure ratio. It was shown that with a decrease in rotating speed, the tonal self-noise was effectively controlled, but the broadband self-noise and tonal noise from the interaction between the rotor and the stator increased. Therefore, the total noise does not surely decrease with the decrease in rotating speed when the total pressure ratio is given. This viewpoint is consistent with the results in Richard et al. 13 and David and James. 14
With an increase in the bypass ratio of a turbofan engine, the exhaust speed of the nozzle decreases, and the fan pressure ratio, rotating speed, and aerodynamic noise simultaneously decrease.
Furthermore, the propulsive efficiency increases, and the specific fuel consumption decreases.15–18 Therefore, the bypass ratio of a turbofan engine continually increases. However, with the increase in the bypass ratio, the rotating speed of the fan decreases, the stage pressure ratios of the coaxial booster and low-pressure turbine decrease, and the stage numbers of both the booster and low-pressure turbine must be increased, which increases the volume and weight of the engine. For a geared turbofan engine, a reduction gear is installed between the fan and the booster to achieve a low rotating speed of the fan and a high rotating speed of the booster and low-pressure turbine to prevent the increase in volume and weight of the engine. The bypass ratio of a geared turbofan can reach 17, whereas that of a direct drive turbofan cannot exceed 10. 19
It is easy to reduce the rotating speed of a geared fan with a high bypass ratio by increasing the reduction ratio of the gear without changing the original structure of the geared turbofan engine. This paper investigates the effect of the aerodynamic load of a high-bypass-ratio fan on its aerodynamic noise by changing the rotating speed at given total pressure ratio and mass flow rate at the design point. This study will be more adaptive to geared fans. The acoustic BEM is used to calculate the aerodynamic noise. A CFD method is used to calculate the unsteady flow field and obtain the unsteady pressure distribution on the solid boundaries.20,21
Comparison of the aerodynamic characteristics of high-bypass-ratio fans with different load coefficients
Brief description of the aerodynamic design method
In this paper, a 2D design method of the S1/S2 flow surfaces was used for the aerodynamic design of the fan rotors and their matching stators. The design procedure is as follows: (1) According to the given mass flow rate, total pressure ratio, its distribution along the blade span and flow angle at the stator outlet (zero in the axial direction), the flow parameters at the inlet and outlet of the rotor and stator were determined using the S2 through-flow design method. (2) Based on the above flow parameters of S2 design, several blade profiles in the S1 surfaces were designed. (3) The profiles in the S1 surface were stacked in the radial direction to form the three-dimensional blades, and the aerodynamic performances of the rotor and stator were analyzed using a 3D flow field simulation method. The aerodynamic design method is described in detail in Deng. 22
For the high-bypass-ratio fan design, generally, the rotor and stator blades designed by the above 2D design method are swept and curved to consider the 3D feature of the flow; that is, 3D aerodynamic design methods are applied to improve the 2D design results. Because the main intent of this paper is to investigate the effect of the load coefficient on aerodynamic noise and the fans designed by the 2D design method have notably good aerodynamic performance, the 3D design method was not performed.
Comparison of the aerodynamic characteristics of the fan stages with different load coefficients
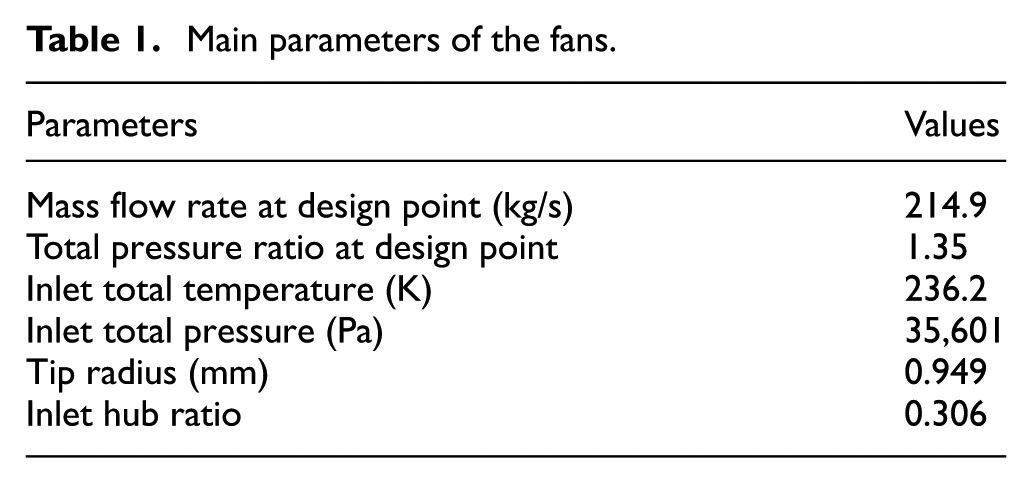
The main parameters for the high-bypass-ratio fans are listed in Table 1, where the inlet total pressure and total temperature at the fan inlet correspond with the atmospheric conditions at an altitude of 8000 m.
Main parameters of the fans.
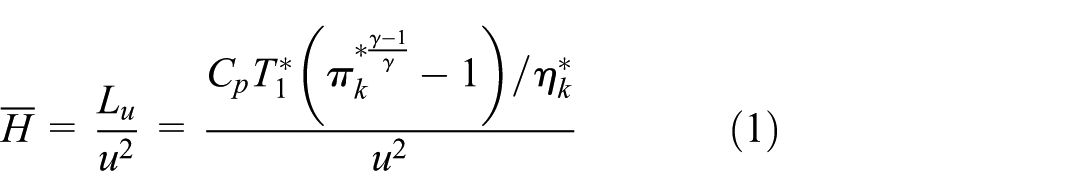
Equation (1) suggests that for a given total pressure ratio
To investigate the effect of the fan rotating speed on the fan aerodynamic noise, three fan stages were designed. Their load coefficients were set as 0.3, 0.6, and 0.88, which corresponded to the rotating speeds of 2790, 1965, and 1623 rpm. The three load coefficients (0.3, 0.6, and 0.88) were selected based on the actual operating envelope and new blade design of civil high-bypass-ratio turbofans. Specifically, the load coefficients of 0.3 represents the conventional load level of current turbofans, 0.88 is an ultra-high load enabled by a novel blade profile,27,28 and 0.6 is the median between them. As shown in Figure 1, compared to the conventional profile, the camber of the new profile was much larger, and its ability to operate on the flow that passed through the cascade was stronger. The outlet relative velocity crossed the axis of rotation, and the outlet relative flow angle was negative. The rear part of the cascade was convergent to control the development of the boundary layers on the blade surfaces and reduce flow losses.

Sketch of plane cascades: (a) conventional blade profile and (b) ultra-high-load blade profile.
In the three fan stage designs, first, the fan rotors were designed; then, their matching stators were designed at the axial positions near the rotor blade trailing edges and placed at the actual axial positions. To simplify our study, we did not use splitter casings to separate the flow through the fans into the core flow and the bypass flow. The flow passages of the three fan stages in the meridian plane are shown in Figure 2.

Flow passages in the meridian plane: (a) load coefficient 0.3, (b) load coefficient 0.6 and (c) load coefficient 0.88.
The flow fields in the three stages were simulated using the ANSYS CFX software. The 3D steady Reynolds averaged Navier–Stokes equation method with the RNG k − ε turbulence model was applied and total grids number is about 500,000 and most y+ values on the wall were within 10.
To examine validation of the numerical method and inspect grid independence, the flow fields in NASA fan rotor 67 were simulated, and the calculated results were compared with the experimental results. 29 NASA fan rotor 67 is a classic transonic axial fan rotor. Its key geometric parameters are: tip radius 0.3048 m, aspect ratio 1.2, blade number 22, design speed 17,188 rpm, tip Mach number 1.38. Grid cells were distributed in the flow fields as follows. Number of nodes in tangential direction was 57, in axial direction was 109 and in radial direction was 73 (including 17 nodes within blade tip clearance), which constructed a grid with about 500,000 of total grid cells. The other grids were constructed according to the same proportion as the above grid. From Table 2, if the number of grid cells is larger than 390,000 and the most y+ values on the wall is smaller than 10, it has negligible effects on performance parameters (total pressure ratio, isentropic efficiency, and mass flow rate) at the highest efficiency point; and values of the calculated parameters are quite close to the experimental values. In Figure 3, for 500,000 grid cells, at the highest efficiency point the calculated Mach contours in S1 surfaces coincide well with the experimental results.
Performance parameters at the highest efficiency point (updated).


Mach contour in the S1 surfaces: (a) 10% span, (b) 50% span and (c) 90% span.
From above investigation, the grid numbers were set as ∼500,000 in the rotor passage and 300,000 in stator blade passage (no blade tip clearance), respectively, and the most y+ values on the wall were within 10 in simulations of the flow fields in the fan stages in this paper.
Table 3 shows the designed aerodynamic parameters of the three fan stages. The load coefficient increased from was 0.3 to 0.88; the rotating speed decreased from 2790 to 1623 rpm. Actually, if the total pressure ratio is fixed and the efficiency is assumed to be constant, according to equation (1), the correlation between the rotating speed and the load coefficient can be derived from equation (2):
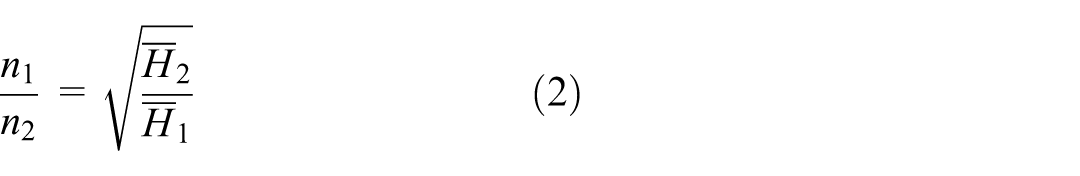
Aerodynamic parameters of the three fan stages.

At the designated mass flow rate of 214.9 kg/s, the designed pressure ratios of the three fan stages slightly deviated from the design target value of 1.35. For the fan stage with the load coefficient of 0.3, the relative deviation is maximal (0.36%, as shown in Table 3). The efficiencies of the three fan stages at the design point are reasonable, and differences in efficiency are small. Generally, when the load coefficient decreases, the fan load becomes light, and the designed fan efficiency increases. However, for the fan stage in this paper, when the load coefficient decreases, the rotating speed increases, the relative Mach number of the blade tip increases, and the shock wave strength increases, finally resulting in an increase in flow losses. Figure 4 shows that when the rotating speed decreases, the shock wave strength decreases, the supersonic area in the flow field was smaller and smaller as the load coefficient increased, and at load coefficient of 0.88 the flow velocity is subsonic in the whole field, so the shock wave disappeared. With an increase in static pressure at the fan stage outlet, the shock wave will exit the blade passage from the rotor blade inlet, which results in a decrease of the surge margin. Thus, when the load coefficient decreases, the surge margin decreases (Table 3). Comparing Figure 4(c) with (a) and (b); Figure 5(c) with (a) and (b), we observe that for the ultra-high load rotor blade design, because of the large camber of the blade, the rear part of the blade passage was convergent, which could effectively control the development of the boundary layers on the blade sur-faces. Therefore, the efficiency of this fan stage at the design point was high, and the surge margin was wide (Table 3) because of the flow separation control of the convergent passage. Figure 6 shows the aerodynamic performance of the three fan stages. Figure 6 shows that a higher load coefficient corresponds to a smaller mass flow rate at the surge point and consequently a wider surge margin.

Mach number contours at 90% span at the design point: (a) load coefficient 0.3, (b) load coefficient 0.6 and (c) load coefficient 0.88.

Mach number contours at 10% span at the design point: (a) load coefficient 0.3, (b) load coefficient 0.6, and (c) load coefficient 0.88.

Performances of the three fan stages.
Comparison of the aerodynamic noise of the fan stages with different load coefficients
The turbomachinery aerodynamic noise source can be divided into monopole sound source, dipole source, and quadrupole source. Generally, the monopoles and quadrupoles can be neglected, and only the dipole sound source is dominant, which comes from solid boundaries. 30 Therefore, the acoustic boundary element method (BEM) can be used to calculate the aerodynamic noise. First, a CFD method should be used to calculate the unsteady flow field and obtain the unsteady pressure distribution on the solid boundaries (including the blade suction surfaces, pressure surfaces, hub, and shroud walls), which is used as the input of the acoustic BEM to calculate the sound field and acoustic power.
Three-dimensional unsteady flow fields in the three fan stages were simulated using the ANSYS CFX software, and the corresponding acoustic fields were simulated using the LMS. Virtual. Lab software. 31
In the 3D unsteady calculations, the Reynolds-averaged Navier–Stokes equations and RNG k-ε turbulence model were used. The steady flow fields were calculated using the frozen-rotor method to process the rotor and stator interface, which can quickly obtain a near-real initial flow field value and avoid the initial oscillation when directly calculated by the sliding grid. Then, the transient rotor/stator interface method was used to calculate the unsteady flow fields, ensuring the accuracy of the noise spectrum of the fundamental frequency (1 BPF) and low-order harmonics (2–3 BPF).
Take the rotor with load coefficient of 0.6 as an example: the rotor has a cycle of 2.15e-2 s, each cycle is divided into 360 physical time steps, and the step size is 5.97372e-5 s. The iteration number in each physical time step was set to 20 steps, and the total time was set to 1 s. After a certain number of steps are calculated, when the axial force on the stator blade changes periodically, it can be judged to be convergent.
In the next section, first, the aerodynamic noise of the three rotors alone are compared to understand the effect of the rotating speed on the rotor noise. Then, the noise levels of the three fan stages are compared to examine the noise from the rotor, stator, and rotor/stator interference.
Comparison of the aerodynamic noise of the three rotors alone
Identical grid structures and grid node numbers were used for the flow field calculations of the three rotors alone. The grid structure was O4H, as shown in Figure 7, the number of axial grid nodes was 77, and the number of tangential grid nodes was 45; the number of grid nodes was 300,000. Table 4 shows the parameter settings in the unsteady calculation. The flow field at every physical time was calculated by the virtual time advance. In the process, the iteration number was set to 20 steps, and the convergence residual was set to 10e-5. The aerodynamic force of the rotor blade was used to determine whether the unsteady-flow-field calculation could be terminated. Figure 8 shows the performance parameter variations with the time step for the fan rotor with the load coefficient of 0.6 as an example. Figure 8 shows that when the time step is larger than 300, the calculated flow field is periodical in time; the differences in the total pressure ratio and efficiency between the steady calculation and average value of the unsteady calculation are small.
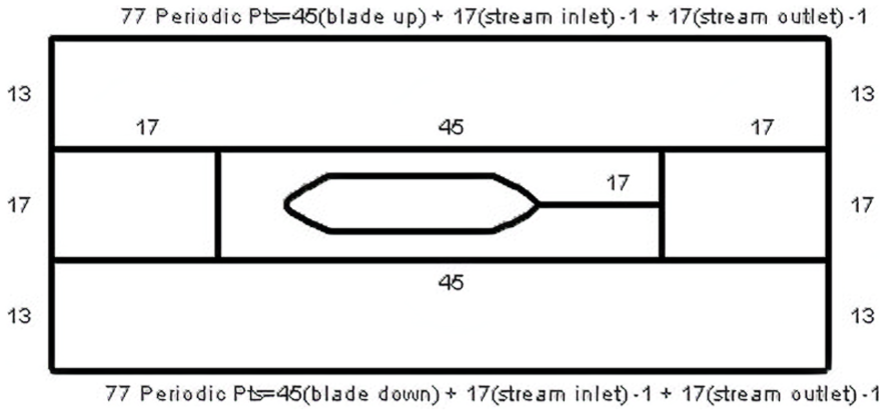
Rotor grid topology.
Parameter settings in the unsteady calculation of the rotors.

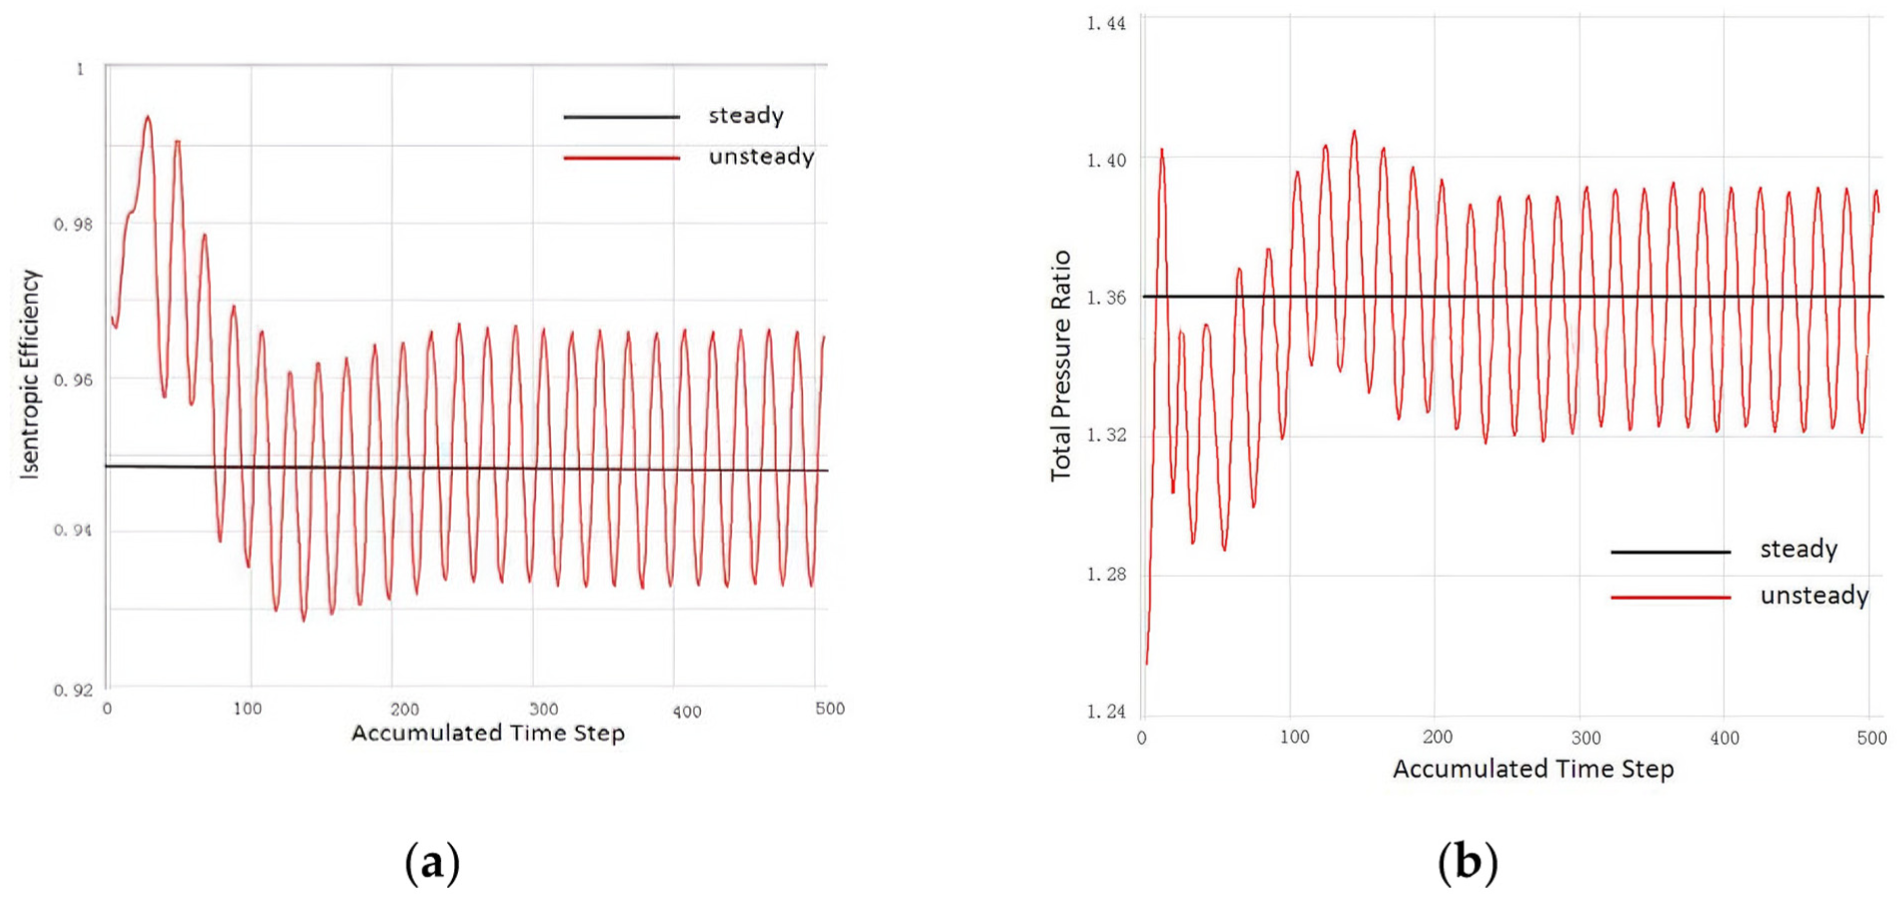
Performance parameter variations with the time step: (a) efficiency and (b) total pressure ratio.
When the unsteady calculation converges, the pressure distributions on the blade surfaces, hub, and shroud in one-time period were outputted and used as the noise source data for the acoustic calculations. A spherical field (Figure 9) with its center point at the fan rotor axis was defined as the acoustic response field to obtain the total acoustic power level radiated from the fan. The A-weighted method was used to measure the total acoustic power of the noise.

Acoustic response model.
The results in Figure 10 show that for the rotor, with an increase in load coefficient, the rotor rotating speed decreases, and the acoustic power of the rotor noise significantly decreases.

Rotor acoustic power level.
The acoustic power spectrum of the rotor alone is shown in Figure 11. In Figure 11, 1, 2, and 3 BPF are one time, two times, and three times the blade passing frequency, that is, the fundamental frequency and the second- and third-order harmonic frequencies. The blade passing frequency is BPF (BPF = N × r/60), where N is the number of rotor blades and r is the rotating speed (rad/min); the harmonic frequency is NBPF, where N is an arbitrary integer. Figure 11 shows that the tonal noise of the fundamental and harmonic frequencies was much larger than the broadband noise for the rotor alone. For the rotor alone, the tonal noise is mainly from the pressure distributions due to the constant rotation on the rotor blade surfaces and the pressure gradients generated by the shock waves at the inlet of the blade tip. Figure 4 shows that with the decrease in rotating speed, the shock wave strength decreases, and the flow field was fully subsonic for the rotor with the load coefficient of 0.88. Therefore, with the decrease in rotating speed or increase in load coefficient, the tonal noise generated by the shock waves decreases. From the radial equilibrium of the flow in the blade passage, the static pressure increases along the blade span. Thus, the tonal noise is mainly generated by the blade upper parts. This conclusion is confirmed by the sound pressure level contours on the blade surfaces of the three rotors in Figure 12. The pressure increases with the increase in blade span, so the pressure distributions on the blade surfaces at 95% blade span of the three rotors were extracted for their comparison, as shown in Figure 13. Figure 13 shows that when the load coefficient increases, the pressure on the blade suction and pressure surfaces decreases. Therefore, the tonal noise from the static pressure distributions due to the constant rotation on the blades surfaces decreases with the increase in load coefficient. From the above analysis, with the increase in load coefficient, the shock waves weaken until they vanish, and the pressures on the blade suction and pressure surfaces decrease, so the tonal noise decreases.

Acoustic power level spectrum.

The pressure fluctuation intensity contours on the blade surfaces: (a) pressure surface and (b) suction surface.

Pressure distribution at 95% blade span.
From Figure 14, for the rotor with the load coefficient of 0.3, the fundamental frequency is the main contributor to the tonal noise, and a higher harmonic order corresponds to a lower sound power level. However, with the increase in load coefficient, the ratio of the acoustic power of the fundamental-frequency noise to the harmonic-order noise decreases, that is, the high-order harmonic noise increases. For the rotor with the load coefficient of 0.88, the high-order harmonic has a larger acoustic power than the fundamental frequency (it can also be seen in Figure 11).

Acoustic power level at 1–3 BPF.
The broadband noise results from the pressure fluctuation on the blade surfaces, which is caused by the shedding vortices at the blade trailing edges, tip clearance shedding vortices, and turbulence of the boundary layers. Therefore, the broadband noise is positively correlated with the amplitude of pressure fluctuation on the blade surface. Figure 15 shows the pressure fluctuation amplitude distributions at 90% blade span of the three rotors. In general, the pressure fluctuation on the blade surfaces of the rotor with the load coefficient of 0.6 has the maximum amplitude, and the corresponding broadband noise is also maximal; the rotor with the load coefficient of 0.88 has the smallest amplitude of pressure fluctuation on the blade surfaces and minimal broadband noise (as shown in Figure 11).

Pressure fluctuation amplitude distributions at 90% blade span.
Comparison of noise among the three fan stages
For the three fan stages of the closely adjoining and relatively far apart rotor/stator, the aerodynamic noises were calculated. To reduce the computational workload, the number of stator blades was reduced from 37 to 36. When the number of rotor blades is 18, only one blade passage in the rotor and two in the stator are taken in the flow field and acoustic field calculations.
When the stator is matched with the rotor, the interaction between the rotor and the stator will become an important cause of aerodynamic noise, and the interaction noise is presented in the acoustic power spectrum in two forms: tonal interaction and broadband interaction noise. 3
Figure 16 shows the acoustic power levels of the three rotors alone and three fan stages of closely adjoining and relatively far apart rotor/stator. In Figure 16, Case 1 represents the rotor alone; Case 2 represents the fan stages of relatively far apart rotor/stator; and Case 3 represents the fan stages of closely adjoining rotor/stator. In Figure 16, the fan stage has a much larger acoustic power than the rotor alone because of the stator self-noise and tonal noise from the interaction between its rotor and stator. The fan stage of relatively far apart rotor/stator (Case 2) has a lower acoustic power than the fan stage of closely adjoining rotor/stator (Case 3) because of the decrease in rotor/stator interaction. This result is true for all load coefficients of 0.3, 0.6, and 0.88. Table 5 was deduced from Figure 16 for a comparison of specific acoustic noise values. For the fan stage with the load coefficient of 0.88, when the stator is matched with the rotor to form the stage, the acoustic power level most strongly increases compared to the fan stages with the load coefficients of 0.3 and 0.6 because the reaction degree for the fan stage with the load coefficient of 0.88 is quite small, and the ratio of static pressure in the rotor to that in the stator is also quite small. Therefore, the proportion of stator self-noise to total noise of the stage is quite large. In addition, for the fan stage with a load coefficient of 0.88, the difference in acoustic power level between the fan stages of closely adjoining rotor/stator and relatively far apart rotor/stator is quite small. It implicates that wake sizes of the rotor blades are small, and the acoustic power generated by the rotor/stator interaction is small.

Comparison of the acoustic power levels.
Differences of the acoustic power levels.

Figure 17 shows the acoustic power spectrum of the three fan stages. The broadband noise was the highest for the stage with the load coefficient of 0.3, particularly when the rotor/stator closely adjoined (Figure 17(b)). However, in Figure 11, for the rotor alone with the load coefficient of 0.3, the broadband noise was low, and the tone noise was high. IT can be inferred that for a fan stage with a low load coefficient, the relative strong rotor/stator interaction makes the large broadband noise increase when the stator is matched with the rotor. Figure 17 also shows that when the distance between the rotor and the stator increases, the difference in broadband noise among the three fan stages decreases.

Sound power spectrum: (a) relatively far apart rotor/stator and (b) closely adjoining rotor/stator.
Figure 18 shows the third-order harmonic acoustic power level. Case 2 represents the fan stages of relatively far apart rotor/stator; Case 3 represents the fan stages of closely adjoining rotor/stator, identical to the above definition. Figure 18 shows that the acoustic power levels at 1–3 BPF in the stages of closely adjoining rotor/stator were obviously larger than those in the stages of relatively far apart rotor/stator, which indicates that the distance between the rotor and the stator has a greater effect on the tonal noise. For the three fan stages, the fundamental frequency had the highest acoustic power levels, and the acoustic power levels decreased with an increase in the order of harmonic frequency. However, for the stage of closely adjoining rotor/stator with the load coefficient of 0.88, the sound power levels at 1, 2, and 3 BPF only slightly varied.

Harmonic sound power level of the fan stages.
Conclusions
In this paper, a BEM method was used to simulate the acoustic fields of three high-bypass-ratio fans with nearly identical mass flow rates and total pressure ratios at the design point, whose load coefficients were 0.3, 0.6, and 0.88, which corresponded to 2790, 1965, and 1623 rpm rotating speeds. The conclusions are as follows.
For the rotor alone, with decrease of the rotating speed (increase in load coefficient), relative flow velocity in the rotor passage decreased, the supersonic area in the flow field was smaller and smaller as the load coefficient increased, and at load coefficient of 0.88 the flow velocity is subsonic in the whole field, the shock waves vanished, the tonal noise significantly decreased. In this case, the aerodynamic noise of the rotors was mainly from the tonal noise; therefore, with the increase in load coefficient, the total acoustic power level significantly decreased.
A fan stage had a much larger acoustic power than the rotor alone because of the stator self-noise and tonal noise from the interaction between the rotor and stator. The fan stage of the rotor/stator that are relatively far apart had a lower acoustic power than the stage of closely adjoining rotor/stator because of the decrease in rotor/stator interaction.
The fan stage with an ultra-high load coefficient had a small reaction degree, and a high stator self-noise ratio. But the rotor wake size is small and the rotor-stator interference noise is weak. Finally, collaborative optimization of noise and aerodynamic performance is achieved (sound power level is reduced by 11.71 dBA, efficiency is increased by 0.012, and surge margin is increased by 28.5%).
Footnotes
Appendix
Handling Editor: Divyam Semwal
Author contributions
Conceptualization, E.L. and Z.Z.; methodology, E.L.; software, E.L.; formal analysis, E.L.; investigation, E.L.; data curation, E.L. and S.S.; writing—original draft preparation, E.L.; writing—review and editing, E.L., Z.Z., and S.S. All authors have read and agreed to the published version of the manuscript.
Funding
The authors received no financial support for the research, authorship, and/or publication of this article.
Declaration of conflicting interests
The authors declared no potential conflicts of interest with respect to the research, authorship, and/or publication of this article.
Data availability statement
Data are contained within the article.