
Abstract
Flexible thin-walled elliptical bearings (FTEBs), essential to harmonic reducers, generate vibration signals dominated by strong background elliptical impacts and random noise, which obscure weak fault features. To overcome this challenge, we propose a novel hybrid diagnostic framework that integrates optimized sparse maximum harmonic-to-noise ratio deconvolution (OSMHD) with multipoint optimal minimum entropy deconvolution adjusted (MOMEDA). The framework introduces two innovations: (1) a frequency-domain energy characteristic ratio (FECR) combined with the Superb Fairywren Optimization Algorithm (SFOA) to adaptively determine filter parameters, and (2) a fault frequency energy ratio (FFER) index to quantitatively assess feature extraction. By sequentially applying OSMHD and MOMEDA, residual impacts and noise are effectively suppressed, enabling clear recovery of fault characteristic frequencies and their harmonics. Experimental verification on outer- and inner-ring faults demonstrates that the proposed approach consistently outperforms envelope spectrum analysis, OSMHD, MOMEDA, and OVMD–MCKD, while robustness tests under strong noise confirm its superior anti-interference capability.
Introduction
The flexible thin-walled elliptical bearing (FTEB), serving as a critical component in high-precision transmission systems such as harmonic reducers, is widely used in industrial robotics, aerospace, precision equipment, and other fields. 1 Characterized by a lightweight structure, capacity for elastic deformation, and strong load transmission capability, this type of bearing is nevertheless more susceptible to early-stage damage—such as fatigue spalling, cage fracture, and rolling element wear—under complex operating conditions due to its compliant structure and elliptical geometry. 2 Since the incipient fault signals are relatively weak compared to periodic elliptical impacts and are easily masked by strong background noise, conventional signal analysis methods often struggle to achieve effective feature extraction. Therefore, developing a highly robust and high-resolution signal processing method is of significant theoretical importance and engineering value for enhancing early fault identification in FTEBs.
Currently, research on bearing fault feature extraction has primarily focused on time-frequency analysis methods,3–6 yet conventional approaches in this category are inherently limited in various aspects. For example, wavelet transform (WT), a typical multi-scale signal processing technique, offers good localization properties and can reveal multi-scale frequency components of non-stationary signals. 7 However, its performance heavily depends on the selection of the mother wavelet. When the impulse signals are weak or the frequency structure is complex, WT often suffers from insufficient time-frequency resolution and feature leakage. 8 To address this issue, ensemble empirical mode decomposition (EEMD)9–13 was introduced, which adds auxiliary white noise and applies averaging to suppress mode mixing and end effects. Nevertheless, the decomposition results of EEMD are sensitive to the noise amplitude, and its intrinsic mode functions lack clear physical interpretation. 14 As an alternative, variational mode decomposition (VMD)15–17 emerged, which decomposes a signal into a set of band-limited mode functions through a variational optimization framework, thereby improving stability and spectral separation. However, VMD requires pre-setting the number of modes and the penalty factor, leading to difficulties in parameter selection and often insufficient extraction of periodic components—particularly under high noise or sparse signal conditions, where its performance is unsatisfactory.18–20 In summary, while these time-frequency analysis methods offer certain advantages in capturing energy distribution features of non-stationary signals, they largely rely on energy or frequency domain characteristics of vibration signals and exhibit limited capability in enhancing transient periodic impulses in the time domain. 21 Especially when the fault-induced impulses are weak or contaminated by strong background noise, time-frequency methods often fail to accurately extract periodic fault components, resulting in ambiguous fault feature representation and reduced diagnostic reliability.22,23
In recent years, blind deconvolution methods based on impulse demodulation have attracted widespread attention. These methods enhance fault features by constructing an optimization objective function to invert a filter, thereby focusing periodic impulse signals in the time domain.24,25 In the field of rolling bearing fault diagnosis, researchers have developed a series of enhanced deconvolution methods tailored to complex operational conditions, aiming to improve the accuracy and efficiency of fault feature extraction. Liao et al., introduced a classifier-guided neural blind deconvolution approach, which serves as a physics-informed denoising module. This method achieves a balance between noise suppression and fault feature extraction in noisy environments, thereby enhancing the reliability of bearing fault diagnosis. 24 Chen et al., proposed a blind deconvolution technique based on squared envelope sparsification. 25 Applied to railway axle-box bearing diagnostics, it balances signal sparsification and feature enhancement, leading to improved identification accuracy of fault characteristics. Xu et al., presented an improved MOMEDA method by shifting the target vector’s impulse interval from the time domain to the angular domain, making it robust against speed variations. 26 This modification extends the applicability of MOMEDA under variable speed conditions. Furthermore, by incorporating harmonic modulation intensity and the average Gini index, the method effectively highlights the inherent cyclic modulation orders in filtered signals, enabling accurate health state identification and significantly boosting fault diagnosis performance. Wei et al., addressed random impulse noise environments with the IAMOMED approach. This technique utilizes the envelope autocorrelation function to automatically estimate cyclic impulse periods, eliminating the subjectivity of manual period range selection. 27 It also rearranges the original MOMED target vector and employs particle swarm optimization to determine the optimal filter length, substantially enhancing fault feature extraction under heavy noise. Shi et al., integrated ACMD and OMOMEDA into a unified framework. ACMD, guided by the Gini index, effectively isolates low-resonance impulse components in fault signals, thereby reducing noise interference. 28 OMOMEDA further refines the extraction of fault-related impulses through optimized key parameters. This combined approach demonstrates superior performance in high background noise scenarios, enabling precise identification of rolling bearing fault types. Wang et al., focused on the diagnosis of compound faults and introduced a methodology integrating multipoint kurtosis spectrum (MKS) with aquila optimizer multipoint optimal minimum entropy deconvolution adjusted (AO-MOMEDA). 29 In this approach, VMD is employed to attenuate noise and enhance the identification capability of MKS. By constructing a comprehensive indicator I, the parameters of MOMEDA are optimized via the aquila optimizer (AO), enabling effective deconvolution and feature extraction of signals corresponding to different fault types. Further, the application of 1.5-dimensional envelope spectrum analysis improves the accuracy in identifying compound fault patterns, thereby significantly boosting the reliability and precision of fault diagnosis. These methods exhibit distinct characteristics and, through various optimization strategies and enhancements, effectively elevate the performance of rolling bearing fault diagnosis, offering robust tools for fault detection under complex operational conditions. However, in the context of FTEBs, the fluctuating fault period and low signal-to-noise ratio often lead to inaccurate period estimation, which adversely affects the deconvolution performance of MOMEDA.
To further improve the accuracy of periodic impulse identification, sparse maximum harmonic-to-noise ratio deconvolution (SMHD) 30 was proposed. This method introduces the harmonic-to-noise ratio (HNR) as the objective function and incorporates sparsity constraints, effectively enhancing both the energy ratio and robustness of periodic impulses—particularly in scenarios with strong background noise.31,32 Algburi et al., introduced a sparse singular spectrum analysis method integrated with SMHD for detecting weak defect signals in industrial robots. 30 By employing sparse representation and deconvolution techniques, this approach effectively enhances the signal-to-noise ratio, enabling the extraction of subtle fault-related features from complex background noise. It thus offers a novel technical solution for fault diagnosis in industrial robotics. Tang et al., proposed a damage identification strategy for wind turbine pitch bearings based on optimized variational mode extraction (OVME) and SMHD. 31 In this method, the white shark optimizer (WSO) is utilized to optimize the parameters of variational mode extraction, allowing more effective isolation of specific signal components from composite signals. Subsequent application of SMHD further improves the signal-to-noise ratio, facilitating accurate identification of characteristic frequencies associated with bearing damage. Furthermore, Tang et al., developed an approach combining variable entropy-weighted fusion based on intrinsic time-scale decomposition (VEITD) with OSMHD for bearing damage diagnosis in wind turbines. 32 The VEITD process decomposes the original signal and applies variable entropy-based weighting during reconstruction to prevent information loss. The weighted fusion signal is then processed via OSMHD, which effectively extracts the characteristic frequencies indicative of bearing damage. Collectively, these methods provide effective solutions for extracting weak fault features under strong background noise, contributing robust tools for condition monitoring and early fault detection in rotating machinery. Nevertheless, SMHD still relies on manual selection of parameters such as the HNR threshold and filter length, and its performance is highly sensitive to these parameters, limiting its broader application in practical engineering.
In response to the aforementioned challenges, this study aims to develop a method for extracting fault-induced impulse features from FTEBs, capable of effectively suppressing elliptical periodic impacts and noise interference. The proposed approach offers a new pathway for investigating the failure mechanisms of FTEBs. To achieve this objective, the SMHD is employed to process vibration signals from FTEBs, reducing interference from elliptical impacts and noise while efficiently extracting the fault-related modal signal. Subsequently, to address the complexity of parameter selection in SMHD, a frequency-domain energy characteristic ratio (FECR) indicator is constructed as the objective function. This serves as a guideline for selecting key parameters of SMHD, including filter length L and the sparse regularization coefficient λ. The splendid fairywren optimization algorithm (SFOA) 33 is introduced to optimize these parameters within the solution space, effectively resolving the difficulty in SMHD parameter selection. This optimized approach is referred to as OSMHD. Finally, the periodic information obtained through OSMHD is used to accurately guide the impulse interval estimation in MOMEDA, mitigating its reliance on manual period setting and enhancing the extraction of periodic fault impulses in the damaged signal. The main contributions of this work are as follows:
To address the complexity of parameter selection in SMHD, a frequency-domain energy characteristic ratio (FECR) indicator is constructed as the objective function. This serves as a guideline for selecting key parameters of SMHD, including filter length L and the sparse regularization coefficient λ. The splendid fairywren optimization algorithm (SFOA) is introduced to optimize these parameters within the solution space, effectively resolving the difficulty in SMHD parameter selection. This optimized approach is referred to as OSMHD.
A dual-stage deconvolution framework of “period estimation–impulse focusing” is established. For the first time, OSMHD and MOMEDA are synergistically integrated: the periodic information extracted by OSMHD is used to accurately guide the impulse interval estimation in MOMEDA, overcoming its strong reliance on manual period setting and reducing subjectivity. This framework combines the advantages of both period identification and time-domain focusing, significantly enhancing the detectability of weak impulse features.
A fault frequency energy ratio (FFER) indicator is proposed to quantitatively evaluate the effectiveness of different signal processing methods in extracting fault characteristic frequencies.
Experimental and comparative analyses demonstrate the effectiveness and superiority of the proposed method in extracting fault features from FTEBs. The results also confirm its strong noise robustness in challenging environments.
The structure of this paper is organized as follows: Section 2 provides a brief introduction to the theoretical background of SMHD, the FECR-based parameter selection method, and the SFOA. Section 3 describes the relevant theory of MOMEDA, the fault diagnosis procedure of the proposed method, and details of the quantitative indicator for evaluating fault feature extraction performance. Section 4 introduces the test rig for vibration signal acquisition from FTEBs, presents analysis and fault diagnosis for healthy, outer race fault, and inner race fault vibration signals, compares the feature extraction results of different methods, and validates the noise robustness of the proposed approach. Conclusions are summarized in Section 5.
Related theory
Sparse maximum harmonic-to-noise ratio deconvolution (SMHD)
SMHD is an efficient signal enhancement method whose core principle is to maximize the harmonics-to-noise ratio (HNR) through an iterative optimization process. By treating HNR as the objective function, the method aims to reconstruct the signal so that the harmonic components of periodic impulses are enhanced relative to aperiodic noise. A sparsity constraint is incorporated to further promote the extraction of transient impact pulses. 32
Assume that the original observed signal y(t) can be expressed as:

Where, x(t) represents the original periodic sparse impulse signal, h(t) denotes the impulse response function of the filter, n(t) is the additive noise, and “*” denotes the convolution operator.
The objective of SMHD is to recover the original impulse signal x(t) by designing a deconvolution filter ω, which satisfies:

where z(t) denotes the deconvolved signal, and its frequency-domain representation Z(f) is given by:

Where FFT(⋅) denotes the fast Fourier transform operation applied to the signal.
Assume that the set of harmonic frequencies composed of the fundamental frequency f0 and its harmonics is denoted as H = (f0, 2f0, …, Kf0). The harmonic energy E H and the noise energy E N in the signal can be, respectively, expressed as:

Thus, the harmonics-to-noise ratio (HNR) can be defined as:
where ε is a regularization term introduced to prevent division by 0.
Introducing
By integrating both harmonic enhancement and sparsity constraints, the optimization objective function of SMHD can be formulated as:

Where, λ denotes the sparsity regularization coefficient.
Frequency-domain energy characteristic ratio (FECR)
In SMHD, the filter length L and the sparsity regularization coefficient λ of the deconvolution filter ω critically influence the deconvolution performance, feature enhancement capability, and algorithm stability. The filter length L directly affects the deconvolution quality: if too short, it may fail to capture sufficient waveform details and lead to poorly resolved impulses; if too long, it increases the risk of overfitting and reduces both sparsity and frequency resolution. The sparsity regularization coefficient λ controls the strength of the sparsity penalty, balancing the harmonic-to-noise ratio (HNR) and signal sparsity. A larger λ enhances sparsity and noise suppression but may weaken harmonic components. Conversely, a smaller λ places greater emphasis on maximizing HNR during optimization.
Zhao et al., 34 established through dynamic modeling that the vibrational energy in FTEBs fundamentally originates from two distinct mechanical mechanisms: Firstly, the elliptical structure induces periodic stress impacts, whose energy is concentrated at twice the rotational frequency and its harmonics—termed elliptical impacts. Secondly, abnormal contact deformation due to faults leads to nonlinear abrupt changes in contact force. Specifically, in the case of outer raceway faults, the fault depth varies cosinusoidally with the elliptical radial deformation, whereas for inner raceway faults, the depth remains constant due to interference fit with the elliptical cam. In both scenarios, the resulting vibrational energy localizes predominantly at the characteristic fault frequency and its harmonics. In the context of fault diagnosis in FTEBs, characteristic fault signatures—such as the characteristic frequencies of inner race, outer race, and rolling element faults, along with their harmonics—manifest as concentrations of periodic impulse energy. When a fault occurs in a FTEB, the resulting impulses excite the system’s natural frequencies, causing energy to concentrate around clusters of the characteristic fault frequency (i.e. the fundamental frequency (f c ), and its harmonics (2f c , 3f c , …, nf c )). When a fault occurs, the instantaneous energy of the time-domain fault signal x(t) can first be computed. Subsequently, its energy spectrum E(f) is obtained via Fourier transform to extract and identify fault features from the frequency domain. To further enhance the effectiveness of SMHD in fault feature extraction, this paper designs a new objective function—the frequency-domain energy characteristic ratio (FECR)—for the automatic optimization of the key parameters L and λ. The expression of FECR is given as follow:

Where, the numerator
As indicated by equation (8), the design of FECR directly aligns with the mechanical differences revealed by Zhao et al. 34 : the denominator is defined as the squared sum of the energy of the fault characteristic frequency and its harmonics, which specifically captures the energy anomalies induced by fault-related contact deformations. The numerator, chosen as the square of the root mean square of the energy spectrum, characterizes the combined energy interference from elliptical stress impacts and noise. Furthermore, from a mathematical logic perspective, FECR represents the ratio of the “average energy concentration across the full frequency band” to the “energy concentration within the fault characteristic frequency band.” When the fault feature concentration is high, the denominator increases significantly, while the numerator exhibits relatively moderate changes. Consequently, the FECR decreases, indicating that the fault energy is more concentrated within the characteristic frequency clusters rather than dispersed across the full frequency band—reflecting a higher degree of fault feature concentration. Conversely, when the fault feature concentration is low (such as during early fault stages or under strong noise interference), the proportion of the denominator decreases, leading to an increase in FECR. This implies that the fault energy is relatively dispersed across the full frequency band, and the characteristic features become less distinct.
Since the optimization of SMHD involves two parameters, a brute-force search is computationally infeasible. Therefore, the SFOA is introduced to efficiently address this problem, as detailed in the following subsection.
Superb Fairywren Optimization Algorithm (SFOA)
The Superb Fairywren Optimization Algorithm (SFOA), 33 is a novel metaheuristic algorithm inspired by three natural behaviors of the splendid fairywren: chick growth, breeding and nesting, and predator avoidance. By incorporating a random number r and a risk coefficient s, the algorithm triggers different search strategies to efficiently and accurately accomplish optimization tasks. The detailed optimization procedure is described as follows:
Prior to the commencement of the optimization process, the positions of all individuals within the population must be initialized:

where U and L represent the upper and lower bounds of the parameter search space, respectively, and “rand” denotes a random number uniformly distributed in the interval (0, 1).
If the number of young birds in the population is relatively high (i.e. r > 0.5), it is considered unfavorable for population survival. Under this condition, the young birds must engage extensively in learning, accumulate experience, and continuously update their positions to enhance global search capability:

Where,
When the number of young birds in the population is relatively small (i.e. r < 0.5), the risk coefficient s of the survival environment is calculated as follows:

Where, r1 and r2 are both random numbers uniformly distributed in the interval (0, 1).
When the r < 0.5 and s < 20, the population is considered to be in a secure survival environment. Under this condition, the population enters a cooperative breeding state, where individuals perform localized iterative optimization around the current global best solution to enhance local exploitation capability. The position update is conducted as follows:
Where, X b represents the current global best solution, C is a contraction factor that guides the algorithm toward the optimal solution (typically set to C = 0.8), p is a teaching factor simulating the intensity of experience transfer from adult birds to young birds, and m is an iteration progress factor dynamically adjusting the search step size, defined as m = (t/T) × 2, with T denoting the maximum number of iterations.
When the r < 0.5 and s > 20, the population is deemed to be in a high-risk survival environment. In this scenario, the population exhibits collective escape behavior by integrating Lévy flight and an adaptive balancing strategy to avoid becoming trapped in local optima. The position update is performed using the following expression:

Where, l denotes the step size of Lévy flight, introduced to enhance the ability to effectively traverse local optima in the solution space; k denotes the step size of Lévy flight, introduced to enhance the ability to effectively traverse local optima in the solution space; w is a normalized parameter reflecting the iteration progress, defined as w = (π/2) × (t/T), with T representing the maximum number of iterations.
The above steps are repeated iteratively until the maximum number of iterations is reached, ultimately yielding the optimal parameters.
Implementation steps of OSHMD
The OSMHD is implemented through the following procedure:
Initialize SFOA parameters: Set the population size of splendid fairywrens (SF), convergence criteria, and maximum number of iterations. Generate initial positions randomly and evaluate their fitness.
Load signal and define objective: Input the fault vibration signal of the FTEB. Define the frequency-domain energy characteristic ratio (FECR) as the fitness function, with the parameter pair (L, λ) in SMHD representing an individual solution.
Signal processing and fitness evaluation: Apply SMHD to process the signal x(t) using the current parameters. Compute the fitness value of the extracted signal after each iteration, and update the positions of the SFs accordingly.
Termination check: If the maximum iteration count is reached, terminate the process; otherwise, continue evaluating the fitness of the extracted modal signal and update the positions iteratively.
Optimal parameter selection and signal extraction: Identify the parameter combination corresponding to the minimum fitness value as the optimal set. Use these parameters in OSMHD to process the fault signal and obtain the primary deconvolved signal for further analysis.
The proposed method
Multi-point optimal minimum entropy deconvolution adjusted (MOMEDA)
MOMEDA 29 is a non-iterative deconvolution method, the principle of which can be described as follows:

Where
The MOMEDA algorithm can solve for the optimal filter


Where,
Where
Combining equations (16) to (18), the following can be obtained:
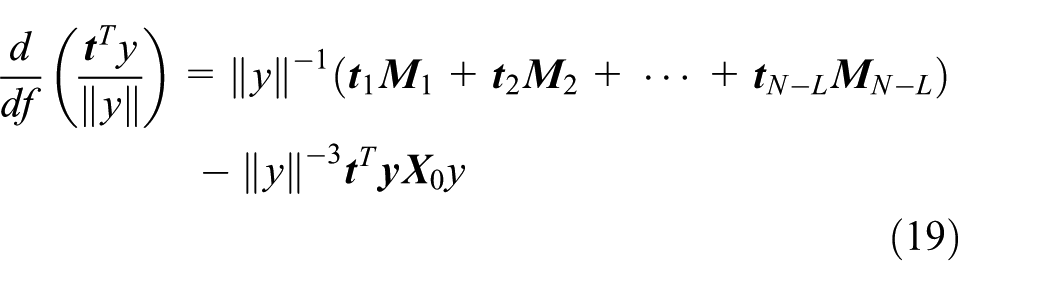
Where
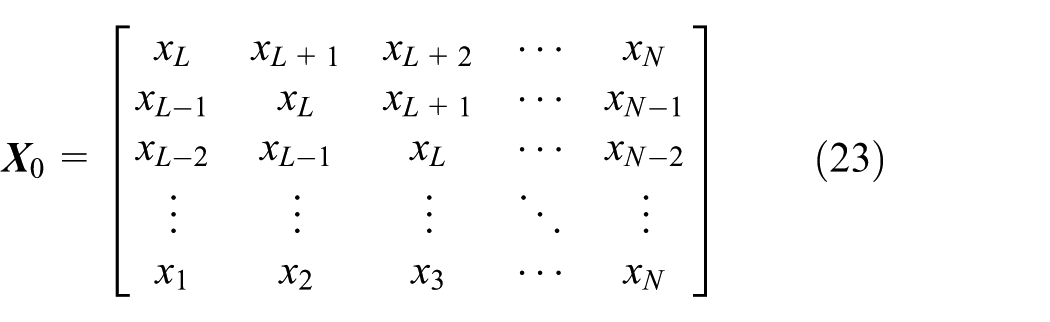
Let

Substituting

The optimal filter is calculated as:

Substituting equations (22) and (23) into
To accurately extract the fault impact features of FETBs, it is necessary to estimate the deconvolution period T used in the MOMEDA algorithm. This value is determined by the fault characteristic frequency f fault and the sampling frequency f s , and can be estimated using the following equation:

The coupling mechanism between OSMHD and MOMEDA
To elucidate the coupling mechanism between OSMHD and MOMEDA, the following aspects are addressed: functional complementarity, hierarchical logic in signal processing, and the principle of synergistic enhancement of fault features.
Functional complementarity: OSMHD focuses on primary feature enhancement. By optimizing filter parameters based on sparse deconvolution principles, it suppresses background noise and amplifies harmonic structures of faults, thereby achieving an initial breakthrough in making fault features discernible from noise-dominated signals. However, residual elliptical impulses and complex noise may persist. In contrast, MOMEDA specializes in deep interference removal. Applying the minimum entropy criterion to the OSMHD’s output, it further purifies the signal by eliminating residual disturbances, transitioning fault features from “discernible” to “clean.” Thus, the two methods complement each other functionally: OSMHD enables preliminary feature enhancement, while MOMEDA accomplishes in-depth interference suppression.
Hierarchical logic in signal processing: The signal processing follows a hierarchical logic of graded deconvolution and stepwise refinement. At the OSMHD stage (primary deconvolution), the frequency energy concentration ratio (FECR) serves as the objective function. Filter parameters are optimized via the SFOA algorithm, applying sparse deconvolution to the raw vibration signal. This will awakens the harmonic energy of fault impulses and increases the energy proportion of fault-related frequency components. Nevertheless, elliptical impulses and residual noise interference may remain. Subsequently, at the MOMEDA stage (secondary deconvolution), the output from OSMHD is taken as input. Leveraging the multipoint optimal minimum entropy criterion, MOMEDA thoroughly filters out residual non-fault periodic elliptical impulses and random noise. By minimizing the signal entropy, it accentuates the periodicity of fault impulses, ultimately yielding a nearly pure impulse sequence containing mainly fault-related components.
Principle of synergistic enhancement of fault features: The coupling of OSMHD and MOMEDA is not a simple series connection but a functionally complementary synergy. This synergistic mechanism can be analyzed from two perspectives: First, it involves dual-domain collaboration in frequency and time domains. OSMHD enhances the energy proportion of fault harmonics in the frequency domain, while MOMEDA improves the purity of fault impulses in the time domain by entropy reduction. Together, they sculpt the fault features through coordinated frequency-time domain operations, achieving enhanced feature representation. Second, a hierarchical progression in interference removal is established. OSMHD primarily suppresses broad-spectrum background noise, whereas MOMEDA specifically targets particular interferences such as elliptical impulses. The precision of interference filtering improves with each processing stage, ultimately transforming fault features from “masked by interference” to “fully prominent.”
Fault diagnosis procedure of the proposed method
To address the fault identification problem in FTEBs, this study proposes an integrated approach combining OSMHD and MOMEDA. The overall procedure is illustrated in Figure 1, with detailed steps outlined below:
Step 1: Load the vibration signal from the faulty FTEB. Initialize the SFOA parameters, setting the population size of the SFs to 20 and the maximum number of iterations to 15.
Step 2: Define FECR as the fitness function. Represent the parameter combination of SMHD, (L, λ), as an individual solution in the SF population. Set the search ranges for L and λ to (600, 5120) and (rms(x(t)), 2rms(x(t))), respectively, where rms(x(t)) denotes the root mean square value of the signal.
Step 3: Using the lower bound (600, rms(x(t)) and the upper bound (5120, 2rms(x(t)) for the search space, iteratively compute the fitness value of the signal component extracted by SMHD after processing the fault signal.
Step 4: Once the fitness value is minimized or the maximum number of iterations is reached, output the optimal parameter combination for SMHD, thereby obtaining the optimized OSMHD algorithm.
Step 5: Apply OSMHD to process the vibration signal and obtain the primary deconvolved signal. Simultaneously, extract and save the estimated fault period T for subsequent analysis.
Step 6: Initialize MOMEDA using the fault period T obtained in the previous step. Apply MOMEDA to the primary deconvolved signal to extract the secondary deconvolved signal with enhanced periodicity.
Step 7: Perform envelope spectrum analysis on the secondary deconvolved signal. Compare the prominent frequency components in the envelope amplitude at the kth harmonic of the fault characteristic frequency in the vibration signal spectrum, and K = 10 is chosen to balance evaluation accuracy and computational efficiency. Ai (i = 1, 2, …, N) represents the amplitude at each frequency component in the spectrum.
According to equation (25), the FFER is primarily used to evaluate the energy proportion of the fault characteristic frequency and its first K harmonics. It is calculated from the vibration signal, and a higher value indicates that the energy concentrated at the fault characteristic frequency and its harmonics accounts for a larger proportion of the total spectral energy. This demonstrates greater prominence of the fault-related frequencies in the spectrum, reflecting the superior effectiveness of the algorithm in extracting fault features from the vibration signal.

Fault diagnosis procedure of OSHMD–MOMEDA.
Experimental research
Experimental platform
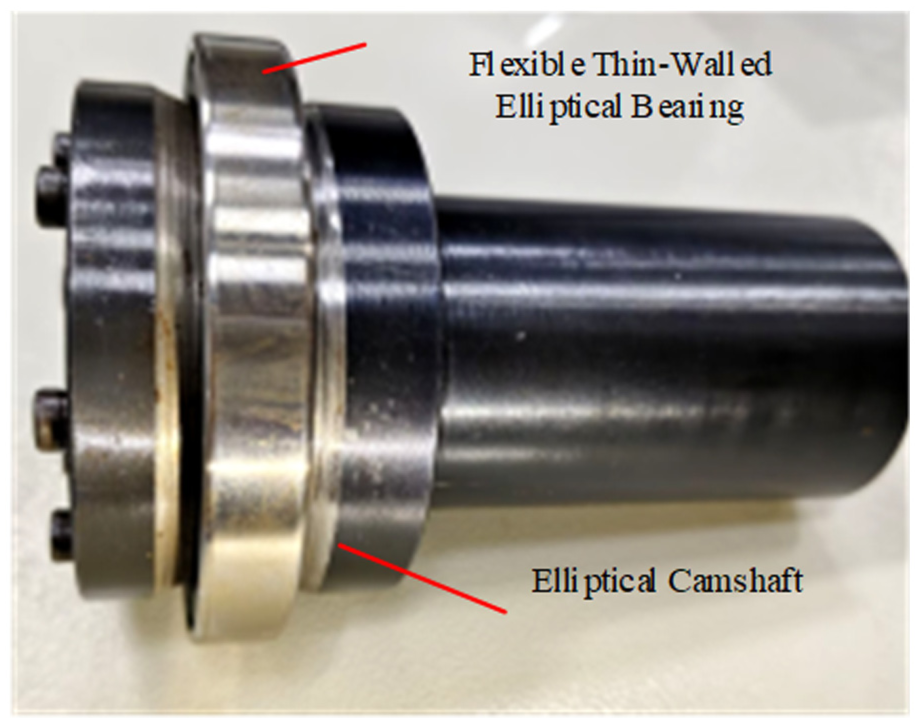
As a specialized type of bearing, the FTEB exhibits significantly different vibration characteristics compared to conventional rolling bearings. Therefore, traditional vibration test rigs designed for standard rolling bearings are not directly applicable for measuring vibration signals of FTEBs. To address this need, the research team independently developed a dedicated vibration test platform for FTEBs, as illustrated in Figure 2. The platform primarily consists of a test frame, a driving device, and a loading mechanism. To accommodate the elliptical structural characteristics of FTEBs, a custom installation device was specifically designed, shown in Figure 3. This device ensures controlled elliptical deformation of the bearing inner ring when assembled onto a high-precision elliptical camshaft. The entire system is directly driven by the output shaft of a three-phase asynchronous motor. The vibration signals of the FTEBs are acquired using an accelerometer mounted on the radial loading block, in conjunction with an HD2000 data acquisition system.

The vibration detection platform for FTEBs.
Installation device for FTEBs.
Calculation of fault frequencies in FTEBs
Existing studies, such as those cited in Zhao and Ye, 35 have indicated that the fault characteristic frequencies of FTEBs exhibit periodic variations. The specific formulas for calculating the fault characteristic frequencies of the outer and inner rings are provided in equations (25) and (26), respectively.


Where, f bfo and f bfi denote the outer- and inner-race fault characteristic frequencies of the FTEB, respectively; z denotes the number rolling elements; r g is radius of rolling elements; β refers to contact angle; t is time; f i and ω i are rotational frequency and angular velocity of the inner ring, respectively. Other variables and their detailed definitions and values are provided in Table 1.
Key parameters of FTEBs.

Based on the aforementioned formula and the parameters listed in Table 1, the fault characteristic frequencies of the FTEB with outer or inner race faults can be calculated. Figure 4 displays the variation curves of these fault characteristic frequencies over one operational cycle. As observed, both the outer and inner race fault characteristic frequencies exhibit periodic fluctuations following a cosine-like pattern, a behavior distinctly different from that of conventional rolling bearings. Specifically, the minimum, maximum, and average values of the outer race fault frequency are 152.03, 152.62, and 152.32 Hz, respectively. Similarly, the inner race fault frequency values are 188.93, 189.52, and 189.23 Hz, respectively.

Fault frequency curves of the FTEB with (a) outer race fault, as well as (b) inner race fault.
Vibration signal analysis of FTEBs
Case 1: Normal signal analysis
Figure 5 shows the vibration signal measured from a healthy FTEB operating at 891 r/min (rotational frequency: 14.85 Hz). As illustrated in Figure 5(a), periodic impulse signals, referred as elliptical impacts, are evident in the vibration response of the healthy FTEB. The envelope spectrum presented in Figure 5(b) reveals a fundamental frequency of these impacts at 29.7 Hz—exactly twice the rotational frequency of 14.85 Hz. This phenomenon originates from the unique geometry of the elliptical raceway: during each complete revolution of the inner ring, the major and minor axes of the ellipse undergo two full cycles of variation, inducing periodic compliance fluctuations. Therefore, the rotation of the elliptical inner ring constitutes the primary mechanism generating these characteristic vibrational impacts in healthy bearings of this type.

Vibration signal of the healthy FTEB: (a) time-domain waveform and its (b) envelope spectrum.
To distinguish these elliptical impacts from potential fault-induced impulses, the signal was processed using the proposed method. The results, shown in Figure 6, confirm the absence of defect-related frequency components and support the attribution of the observed impulses to the bearing’s elliptical design.

Deconvolution results by OSMHD: (a) the convergence curve, (b) the filtered signal waveform, and its (c) envelope spectrum.
Based on the optimization results of SFOA, the parameters (L, λ) for SMHD are adaptively selected. As shown in Figure 6(a), the fitness value begins to converge after just one iteration, yielding the optimal parameter combination for SMHD: L = 843, λ = 6.9. Using these optimized parameters, the SMHD is updated to OSMHD, which is then applied to process the healthy signal. The filtered signal (Figure 6(b)) and its envelope spectrum (Figure 6(c)) are obtained. Analysis of Figure 6(b) and (c) confirms that the impulse components in the OSMHD-filtered signal correspond to the elliptical impact-frequency of 29.7 Hz and its higher harmonics, rather than fault characteristic frequencies induced by raceway defects. Subsequently, the OSMHD-filtered signal is further processed using MOMEDA, with the results presented in Figure 7.

Deconvolution results by OSMHD–MOMEDA: (a) time-domain waveform and its (b) envelope spectrum.
As observed in Figure 7(a), the signal filtered by OSHMD–MOMEDA exhibits periodic impulses with a time interval of T = 0.0367 s, corresponding to a fundamental frequency of f = 29.7 Hz, which aligns precisely with the frequency of elliptical periodic impacts. This result indicates that even in a healthy state, the FTEB generates inherent periodic impacts during operation due to its elliptical contact geometry—a mechanism fundamentally distinct from the conventional understanding that impacts in rolling bearings are solely fault-induced. Figure 7(b) shows that the envelope spectrum only contains the elliptical impact frequency and its integer-order higher harmonics, with no fault characteristic frequencies (i.e. f bfo , f bfi ) associated with localized defects. This frequency-domain observation further confirms that the vibrational response of the healthy FTEB is dominated by elliptical impacts, with stable amplitude and harmonic structure, and exhibits no modulation components related to damage.
Case 2: Outer ring fault signal analysis
The experiment was conducted at a rotational speed of 891 r/min, with a sampling frequency fs of 12,800 Hz and 8192 sampling points. The measured vibration signal for the outer race fault is shown in Figure 8.
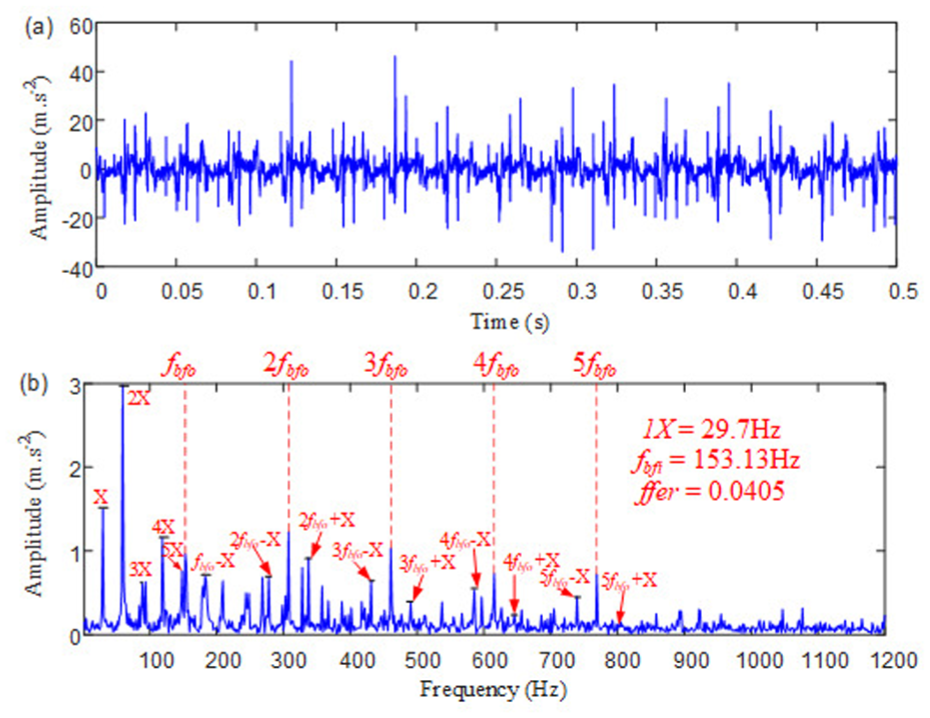
Vibration signal of the outer ring fault FTEB: (a) time-domain waveform and its (b) envelope spectrum.
By comparing Figures 8(a) with 5(a), it is evident that both the outer race fault signal and the healthy signal exhibit distinct periodic impacts, with the maximum amplitude of the former being approximately three times that of the latter. This indicates a significant enhancement in impact energy within the vibration signal when an outer race fault is present. In the envelope spectrum shown in Figure 8(b), clear spectral lines corresponding to the outer race fault frequency and its harmonics (f bfo , 2f bfo , 3f bfo , 4f bfo , 5f bfo ) are observed, accompanied by prominent modulation sidebands (f bfo ± X, 2f bfo ± X, 3f bfo ± X, 4f bfo ± X, 5f bfo ± X, etc.). The modulation frequency X = 29.7 Hz is exactly twice the rotational frequency (14.85 Hz), resulting from the alternating variation of the major and minor axes of the elliptical raceway during each rotation—hence referred to as the elliptical impact frequency.
Additionally, the spectrum contains the elliptical impact frequency and its harmonics (X, 2X, …), along with broadband colored noise. Notably, the amplitudes of the elliptical impact frequency and its second harmonic exceed those of the fault-induced frequencies. These observations demonstrate that the vibration signal of a faulty FTEB with an outer race defect is a composite signal comprising both fault-induced and elliptical impacts, along with multiple interference components, where the fault-related impacts are relatively weak compared to the elliptical impacts. Subsequently, the proposed method was applied to analyze the outer race fault signal, with the results presented in Figure 9.

Deconvolution results by OSMHD: (a) the convergence curve, (b) the filtered signal waveform, and its (c) envelope spectrum.
Based on the optimization results obtained via the SFOA, the parameters (L, λ) of the SMHD were adaptively determined. As illustrated in Figure 9(a), the fitness value converges after two iterations, resulting in an optimal parameter set for SMHD with L = 843, λ = 6.91. These values were used to configure the OSMHD, which was subsequently applied to the outer race fault signal. The filtered time-domain signal (Figure 9(b)) and its corresponding envelope spectrum (Figure 9(c)) are derived from the OSMHD processing. Compared to the raw signal in Figure 8(a), the fault-induced impulses in Figure 10(b) exhibit enhanced periodicity and amplitude. The envelope spectrum further confirms the improvement, with the FFER increasing from 0.045 to 0.3189, indicating a substantial enhancement in fault feature separability. Nevertheless, it is observed that higher-order harmonics of the outer race fault frequency (e.g. 6f bfo , 7f bfo ) remain relatively weak and are partially obscured by residual noise components, suggesting opportunities for further refinement in harmonic recovery.
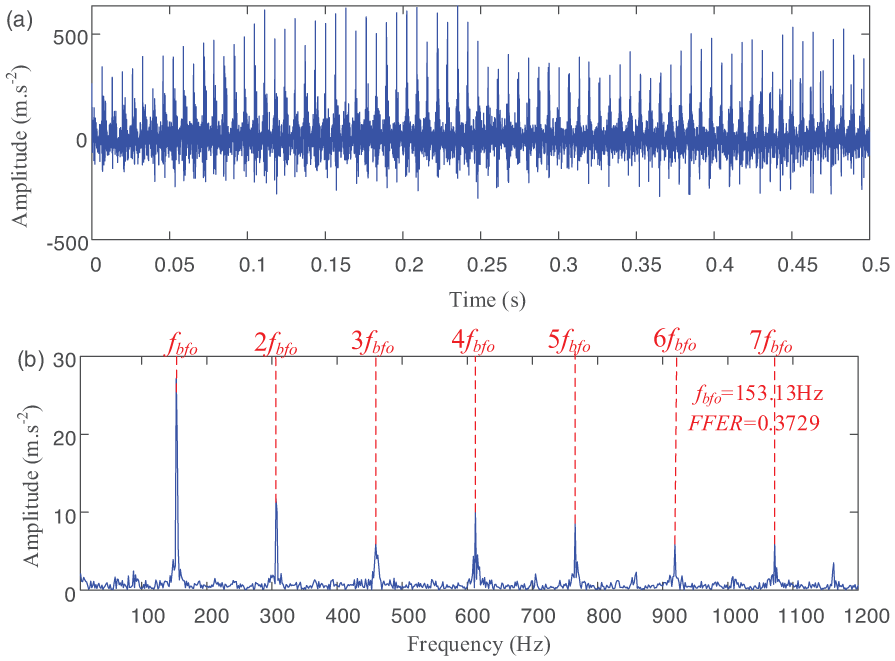
Deconvolution results by OSMHD–MOMEDA: (a) time-domain waveform and its (b) envelope spectrum.
Subsequently, the filtered signal was processed using MOMEDA to obtain the secondary deconvolved signal and its envelope spectrum, as shown in Figure 10.
It can be observed from Figure 10 that the outer race fault frequency and its higher-order harmonics are clearly identifiable, while interfering frequency components have been substantially suppressed, confirming the presence of an outer race fault in the bearing. Moreover, as evidenced in Figure 10(b), the fault-related frequency components become more prominent after the secondary demodulation, with the FFER value increasing from 0.3189 in the previously processed envelope spectrum to 0.3729, demonstrating further enhancement in fault feature extraction. Additionally, higher-order harmonics such as 6f bfo and 7f bfo exhibit significantly amplified amplitudes. These results indicate that the proposed method successfully identifies outer race faults in the FTEB, underscoring its effectiveness and superiority. It is also noted that the measured outer race fault frequency is 153.13 Hz, which is slightly higher than the theoretical average value of 152.32 Hz—a deviation that remains within acceptable tolerances and does not affect the reliability of the diagnosis.
For comparison, the aforementioned outer race fault signal is processed using OVMD–MCKD, 21 with the results illustrated in Figure 11. Compared with the original signal waveform in Figure 8(a), the elliptical shock components in the filtered signal waveform (Figure 11(a)) are substantially suppressed. Although distinct impulses can be observed in the waveform, significant random noise interference remains prominent, obscuring the local fault characteristics of the signal. As shown in Figure 11(b), only the first three harmonics (i.e. f bfo , 2f bfo , 3f bfo ) of the outer race fault frequency are clearly distinguishable in the amplitude spectrum of the filtered signal, while higher-order harmonics (i.e. 4f bfo , 5f bfo , …) are submerged in noise. Although the FFER value of the filtered signal increases from 0.045 in the original envelope spectrum to 0.1437, indicating a noticeable improvement in fault feature extraction, the overall performance remains considerably inferior to those obtained by OSMHD–MOMEDA shown in Figure 10.

Deconvolution results by OVMD–MCKD: (a) time-domain waveform and its (b) envelope spectrum.
Case 3: Inner ring fault signal analysis
Maintaining the same experimental conditions as those used for the outer race fault analysis—including rotational speed, sampling frequency, and number of sampling points—the vibration signal for the inner race fault was acquired, as shown in Figure 12.

Vibration signal of the inner ring fault FTEB: (a) time-domain waveform and its (b) envelope spectrum.
As shown in Figure 12(a), the inner race fault signal exhibits pronounced impulsive characteristics. A comparison with Figure 8(a) reveals that the vibration amplitude of the inner race fault is ∼10 times greater than that of the outer race fault, indicating significantly stronger vibration energy release from inner race defects. This amplitude difference is primarily due to the more direct vibration transmission path and lower energy dissipation for inner race faults, whereas outer race faults suffer from stronger attenuation and interference through housing interfaces.
In the envelope spectrum (Figure 12(b)), the first three harmonics of the inner race fault frequency (i.e. f bfi , 2f bfi , 3f bfi ) are clearly visible. However, higher-order harmonics (i.e. 4f bfi , 5f bfi , …) are masked by noise and unrelated spectral components, making definite fault identification challenging using conventional envelope analysis alone. To improve diagnostic clarity and accuracy, the proposed OSHMD–MOMEDA method was applied to the inner race fault signal. The results, given in Figure 13, demonstrate enhanced feature extraction performance, enabling reliable detection and confirmation of the inner race fault.

Deconvolution results by OSMHD: (a) the convergence curve, (b) the filtered signal waveform, and its (c) envelope spectrum.
The parameters (L, λ) of the SMHD were adaptively selected using the SFOA algorithm. As shown in Figure 13(a), the fitness value begins to converge after three iterations, yielding the optimal parameter combination for SMHD: L = 1457, λ = 19.28. These values were used to update SMHD to its optimized version, OSMHD, which was then applied to process the inner race fault signal. The primary deconvolved signal and its envelope spectrum are presented in Figure 13(b) and (c), respectively. Compared to the original signal in Figure 12(a), the inner race fault impulses in Figure 13(b) exhibit enhanced periodicity and amplitude. The envelope spectrum in Figure 13(c) shows more distinct fault frequency components, with the FFER value increasing from 0.089 in the original signal to 0.1627, indicating a notable improvement in fault feature extraction. Although OSMHD effectively reduces irrelevant frequency components in the envelope spectrum, higher-order harmonics of the inner race fault frequency (i.e. 4f bfi , 5f bfi ) remain obscured by residual noise. To further enhance feature clarity, the primary deconvolved signal was subsequently processed using MOMEDA. The resulting secondary deconvolved signal and its envelope spectrum are shown in Figure 14.

Deconvolution results by OSMHD–MOMEDA: (a) time-domain waveform and its (b) envelope spectrum.
As illustrated in Figure 14, the inner race fault frequency and its higher-order harmonics are clearly identifiable, confirming the presence of an inner race fault in the bearing. Furthermore, Figure 14(b) demonstrates that the fault-related frequency components become more prominent after secondary demodulation, with the FFER value increasing from 0.1627 in the primary demodulated envelope spectrum to 0.3939, indicating a substantial enhancement in fault feature extraction. Notably, higher-order harmonics such as 4f bfo and 5f bfo exhibit significantly amplified amplitudes. These results validate the effectiveness and superiority of the proposed method in successfully diagnosing inner race faults in FTEBs. Additionally, the measured inner race fault frequency is 189.06 Hz, which is slightly lower than the theoretical average value of 189.23 Hz—a deviation that remains within acceptable tolerances and does not compromise the reliability of the diagnosis.
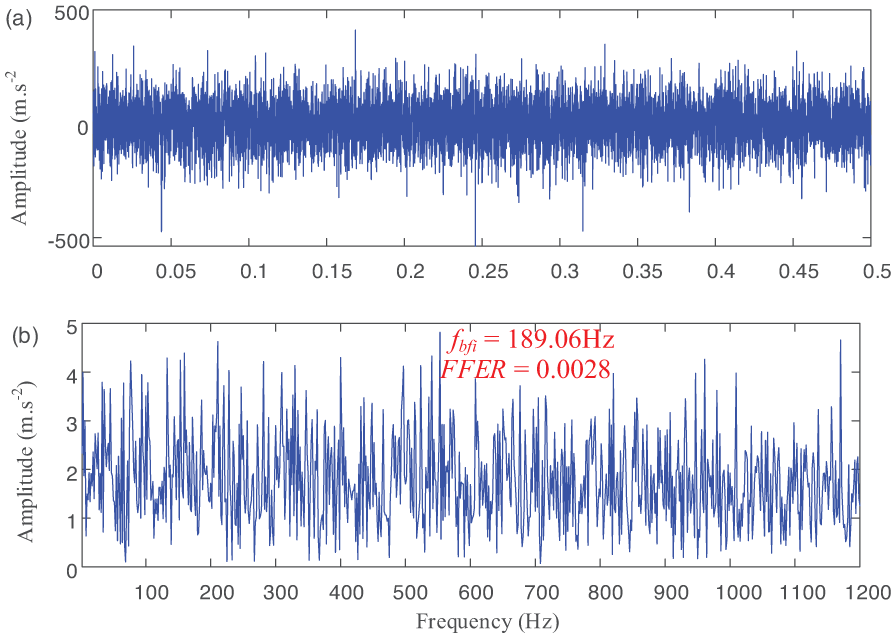
In contrast, the inner race fault signal mentioned above was processed via OVMD–MCKD, 21 and the corresponding results are displayed in Figure 15. A direct comparison with the original signal waveform (Figure 12(a)) reveals that the elliptical impulse components in the filtered signal waveform (Figure 12(a)) have been substantially suppressed, while the fault impulse features remain distinctly prominent. Specifically, as shown in Figure 15(b), the first four harmonic components of the inner race fault frequency are clearly distinguishable in the amplitude spectrum of the filtered signal. In contrast, higher-order harmonics appear relatively weak and become submerged in background noise. Although the FFER value of the filtered signal increases from 0.089 (in the envelope spectrum of the original signal) to 0.2457—signifying a notable enhancement in fault feature extraction effectiveness—this performance is still considerably inferior to the deconvolution result achieved by OSMHD–MOMEDA (Figure 14).

Deconvolution results by OVMD–MCKD: (a) time-domain waveform and its (b) envelope spectrum.
Comparison with other methods
The relative amplitude of the fault characteristic frequency compared to other spectral components serves as a direct indicator of the effectiveness of fault feature extraction in FTEBs. Therefore, the fault frequency energy ratio (FFER), as defined in equation (25), is employed for quantitative assessment. A higher FFER value signifies that a larger proportion of the total spectral energy is concentrated at the fault frequency and its harmonics, indicating greater prominence of fault-related frequency components and, consequently, better performance of the algorithm in extracting fault features from vibration signals.
To further evaluate the effectiveness and superiority of the proposed method, four approaches—namely OSMHD, MOMEDA, OVMD–MCKD, 21 and the proposed OSMHD–MOMEDA—were applied to the outer and inner race fault signals introduced previously. The corresponding FFER values obtained from these analyses are summarized in Table 2.
Comparison of fault feature extraction effects using different methods.

As shown in Table 2, the proposed OSHMD–MOMEDA method yields the highest FFER values for both outer and inner race fault signals, demonstrating its superior performance in fault feature extraction. For the outer race fault signal, the ranking of feature extraction effectiveness is: OSHMD–MOMEDA > OSHMD > MOMEDA > OVMD–MCKD. 21 For the inner race fault signal, the ranking is: OSHMD–MOMEDA > OVMD–MCKD 21 > MOMEDA > OSHMD. These results indicate that the integrated OSHMD–MOMEDA approach effectively combines the advantages of OSHMD in enhancing harmonic-to-noise distinction and MOMEDA in reinforcing multi-point periodicity, thereby simultaneously addressing issues of harmonic interference and periodic fluctuation. Using either method individually leads to compromised performance, confirming that the combination of both deconvolution techniques is both effective and necessary.
In contrast, the OVMD–MCKD 21 method, which relies solely on kurtosis maximization and pre-set center frequencies, is prone to mode mixing and inaccurate fault period estimation, resulting in the poorest fault extraction performance. Furthermore, Table 2 also reveals that the kurtosis value is highly sensitive to elliptical impacts and noise, indicating that it alone is not a reliable indicator for diagnosing faults in FTEBs.
Noise resistance analysis
Taking the inner race fault signal (Figure 12) as an example, to validate the noise robustness of the proposed method, white noise with signal-to-noise ratios (SNRs) of −20 and −40 dB was added to the original signal. The resulting contaminated signals are shown in Figures 16 and 17, respectively.

Inner race fault simulation signal contaminated with −20 dB white noise: (a) time-domain waveform and its (b) envelope spectrum.
Inner race fault simulation signal contaminated with −40 dB white noise: (a) time-domain waveform and its (b) envelope spectrum.
The proposed method was subsequently applied to analyze the simulated inner race fault signal with added −20 dB white noise. The results are presented in Figure 18. The parameters (L, λ) of SMHD were adaptively optimized using the SFOA algorithm. As shown in Figure 18(a), the fitness value converges after three iterations, yielding the optimal parameter set L = 75, λ = 24.23. These values were used to configure OSMHD, which was then applied to process the noisy signal. The primary deconvolved signal is shown in Figure 18(b). Although the impulse characteristics become more discernible in Figure 18(b), significant noise interference remains. Therefore, MOMEDA was employed to further refine the signal. The secondary deconvolved signal and its envelope spectrum are shown in Figure 18(c) and (d), respectively. These figures demonstrate that the fault impulses are significantly enhanced after the secondary processing phase. This improvement is quantitatively reflected in the FFER values: it increased from 0.0035 in the original noisy signal to 0.0046 after the first deconvolution, and further to 0.2715 after the second deconvolution, indicating a remarkable enhancement in fault feature extraction. Moreover, interfering frequency components were effectively suppressed, while higher-order harmonics of the fault impact frequency were successfully re-covered.

Analysis results method of the simulation signal with −20 dB white noise added the proposed: (a) the convergence curve, (b) the filtered signal waveform by OSMHD, (c) the filtered signal waveform by OSMHD–MOMEDA, and its (d) envelope spectrum.
Similarly, the proposed method was applied to the simulated inner race fault signal with added −40 dB white noise. The results are shown in Figure 19. The parameters (L, λ) of SMHD were adaptively selected based on the SFOA algorithm. As observed in Figure 17(a), the fitness value begins to converge after three iterations, yielding the optimal parameter combination for SMHD as L = 1640 and λ = 203.32. Using this optimized parameter set, the corresponding parameters of SMHD were updated to form OSMHD, which was subsequently applied to process the simulated signal. The first-stage deconvolution signal is illustrated in Figure 19(b). It can be seen that the impact characteristics of the simulated signal become more distinct, although significant noise interference remains. Therefore, MOMEDA was employed to further process the signal, resulting in the secondary deconvolution signal and its envelope spectrum, as shown in Figure 19(c) and (d), respectively. These figures demonstrate that the fault impact waveforms become more prominent after the secondary demodulation process. This improvement is also reflected in the increase of the FFER value: from 0.0028 for the original signal, to 0.0122 after the first deconvolution, and further to 0.1808 after the second deconvolution, indicating a significant enhancement in fault feature extraction. Moreover, it is evident that extraneous frequency interference has been effectively suppressed, and higher harmonic components of the fault impact frequency have been recovered.

Analysis results of the simulation signal with −40 dB white noise added using the proposed method: (a) the convergence curve, (b) the filtered signal waveform by OSMHD, (c) the filtered signal waveform by OSMHD–MOMEDA, and its (d) envelope spectrum.
These results validate the strong noise resistance of the proposed method. The approach is also applicable to outer race fault signals under heavy noise interference, though detailed results are not presented here due to space limitations.
Conclusion
In this study, an OSMHD–MOMEDA-based method was proposed to address the difficulty of extracting weak fault features from FTEB vibration signals, where strong background elliptical impacts and random noise often dominate. Experimental analysis revealed that healthy FTEBs inherently exhibit periodic impacts caused by the elliptical raceway rotation, rather than structural defects. The proposed method was shown to effectively suppress these background impacts and noise, enabling accurate identification of fault characteristic frequencies and their higher-order harmonics, and demonstrating significantly enhanced feature extraction capability compared with conventional envelope spectrum analysis.
Further evaluation under strong noise conditions confirmed the method’s robustness, as it successfully recovered fault frequencies and harmonics while suppressing spurious interference. Comparative results also indicated that OSMHD–MOMEDA outperforms OSMHD, MOMEDA, and OVMD–MCKD individually, validating its diagnostic effectiveness and superiority. Future work will focus on mitigating deconvolution period estimation errors in MOMEDA at ultra-high frequencies, potentially through swarm intelligence optimization or deep learning-based adaptive parameter tuning, to further improve the real-time fault diagnosis performance of FTEBs under complex operating conditions.
Footnotes
Handling Editor: Yawen Wang
Funding
The authors disclosed receipt of the following financial support for the research, authorship, and/or publication of this article: This work supported by the National Natural Science Foundation of China (NSFC, no. 52375538), Natural Science Foundation of Guangxi Province (no. 2025GXNSFHA069192), Middle-aged and Young Teachers’ Basis Ability Promotion Project of Guangxi (no. 2025KY0346), Doctoral foundation of Guangxi University of Science and Technology (no. XKB21Z59), Innovation Project of Guangxi Graduate Education (no. YCSW2025574).
Declaration of conflicting interests
The authors declared no potential conflicts of interest with respect to the research, authorship, and/or publication of this article.