
Abstract
Mechanical seals are essential for ensuring the reliability of rotating machinery. However, direct acquisition of acoustic emission (AE) signals at the seal interface is infeasible due to structural constraints, and indirect measurements are often employed that result in significant attenuation, leading to significant attenuation, especially in high-frequency components that are critical for condition monitoring. To address this, a novel soft measurement method based on a hybrid deep learning framework called PILFN was proposed. The LSTM module captures the temporal dynamics of the AE signal, while the Fourier feature layer extracts frequency features. Additionally, physical knowledge is integrated via a modified power-law attenuation formula, guiding the model to recover pre-attenuation signal characteristics. Experiment results demonstrate that the PILFN model achieves better reconstruction accuracy, with an average RMSE of 0.0062, compared to 0.2 obtained by the LSTM-only model. This improvement allows the reconstructed signals to better represent the tribological information of the seal interface, enhancing the accuracy and reliability of mechanical seal condition monitoring.
Introduction
Mechanical seal as an essential device of rotating machinery, which is widely used to prevent fluid leakage and ensure the stable operation of rotating equipment such as pumps, compressors, and mixers. 1 A typical mechanical seal consists of a rotating ring, a stationary ring, a spring, and the secondary seals. The seal interface consists of the rotating ring and stationary ring. The performance of mechanical seals relies on the seal interface, which prevents leakage through the rotating and stationary rings operating in close proximity. The survey 2 showed that the dry running and wear are the main reasons leading to failure of mechanical seals, causing the damage of the seal interface. Once the seal interface fails due to wear or damage, it can lead to leakage, equipment malfunction, downtime, and significant economic loss. 3 The running condition of the mechanical seals including rotational speed, fluid pressure, temperature, and vibration which significantly affects the seal interface. 4 Therefore, the core functional area of the mechanical seal is the seal interface, and its running condition directly determines the mechanical seal’s effectiveness and performance. Nowadays, condition monitoring has received more and more attention in most industry employing rotation machines. 5 Accordingly, the running condition monitoring of the seal interface is of great importance, as it ensures the reliability and longevity of machine and reduces the risk of machine downtime.
Acoustic Emission (AE) technology has emerged as a promising approach for condition monitoring of mechanical seals, especially for the seal interface. Various techniques have been proposed for monitoring the running condition of mechanical seals, such as AE monitoring, ultrasonic wave monitoring, dynamic behavior measurement, and Air-born acoustic noise monitoring. Among these, Fan et al. 6 proposed that dynamic behavior measurement is mainly applicable to non-contacting mechanical seals and has limited scope. Ultrasonic wave monitoring, while effective in detecting dry-run conditions, falls short in identifying other common failure modes. In contrast, AE monitoring is capable of capturing a wide range of failure conditions, especially those occurring at the seal interface. AE refers to a phenomenon in which local stress concentrations in materials rapidly release energy in the form of stress waves. 7 The energy content of AE signals reflects tribological status between seal faces, making the AE technique highly suitable for detecting early-stage faults such as leakage and dry running. 8 Moreover, AE signals provide meaningful indicators of the tribological condition of seal interfaces.
Miettinen and Siekkinen 9 showed that by analyzing AE responses under different operating conditions, early-stage phenomena such as leakage, dry running, and cavitation in mechanical seals can be effectively detected. Similarly, like the seal face of mechanical seal, the study by Shanbhag et al. 10 focused on is hydraulic cylinder seals, demonstrated that the tribological condition of seals could be effectively identified by analyzing the mean and root mean square (RMS) of AE signals, successfully distinguishing between unworn, semi-worn, and severely tribological conditions. These findings validate AE as one of the most suitable techniques for real-time tribological condition monitoring in sealing systems.
In recent years, several studies have demonstrated that AE features extracted from AE waveform in time domain combined with spectra analysis is widely used for the purpose of condition monitoring in mechanical seals. 11 Among various frequency components, high-frequency AE signals are particularly informative in reflecting the true tribological state at the seal interface. Towsyfyan et al. 12 found that tribological events such as dry contact and wear tend to generate transient AE signals that are predominantly concentrated in the high-frequency domain. This phenomenon arises from short-duration, high-energy stress waves produced by micro-scale interactions like asperity contacts, micro-cracking, adhesive wear, and abrasive particle impacts. These events typically emit ultrasonic stress waves with dominant high frequency components,13,14 making them crucial for detecting the early stages of degradation at the seal interface. Ding et al. 15 proposed that the arrangement should allow the AE testing probe to be as close as possible to the tested sealing ring, improving testing accuracy and reducing signal attenuation. The compact and enclosed structure of mechanical seals makes such installation difficult, so AE sensors are often mounted outside the sealing chamber or on nearby stationary components. 16 Consequently, the AE signals, particularly their high-frequency components, are subject to attenuation during propagation. 17 This attenuation can significantly degrade the quality of tribological information reaching the sensor, potentially limiting the early detection of critical failure modes. 18
In order to recover the AE signal that monitoring the condition of mechanical seal after attenuation, the soft measurement techniques can be used to solve it. Soft measurement is a technical way to indirectly estimate unmeasurable or difficult variables through measurable variables and mathematical modeling method, and its core lies in establishing a mapping model between input variables and target variables. Common approaches include purely data-driven deep learning models and hybrid semi-physical models. The source of the AE is mainly from the seal interface in the mechanical seal, so take the AE source signal as the true AE signal and the signal measured outside of the chamber is called the attenuated AE signal. Hase et al. 19 proposed that the frequency composition and energy content of the attenuated AE signal are affected due to attenuation but still can be recognized and utilized. These retained features can thus be leveraged to reconstruct the true AE signal from attenuated AE signal by using network-based soft measurement method. Through the signal recovery of the soft measurement method, a more accurate signal can be measured by a more convenient arrangement of sensor, so as to better monitor the operating condition of the mechanical seal.
Since AE signals are a form of time-dependent, non-stationary time series, it is natural to first consider using Long Short-Term Memory (LSTM) networks for their modeling. LSTM networks are capable of capturing temporal dependencies and dynamic patterns across time steps, making them well-suited for analyzing AE signals in time domain. For instance, Zhang et al. 20 proposed a method to predict the mapping relationship between AE signal and value dynamic characteristics based on LSTM neural network by analyzing the AE signal of compressor valve. The results indicate that the LSTM has higher accuracy in processing time series signals of AE. While LSTM models perform well in learning temporal dependencies of AE signals, they are not well-suited for capturing frequency-domain characteristics. This limitation makes them insufficient for preserving high-frequency features, which are essential for early fault detection at the seal interface. To address this issue, Fourier Feature Mapping was introduced by Tancik et al., 21 which enhances a neural network’s ability to learn frequency features by embedding a Fourier feature layer that maps input signals into a frequency space. This not only improves the model’s sensitivity to subtle, high-frequency fault features, but also reduces the depth required for capturing complex frequency structures, thereby increasing training efficiency and interpretability. And Zheng et al. 22 further demonstrated the effectiveness of Fourier feature mapping in retaining critical high-frequency characteristics in AE signals. Lu et al. 23 proposed a method that applied FFT-based preprocessing to construct a frequency-domain matrix and then combined with LSTM and SENet modules for anomaly detection in time series, Pham 24 integrated time–frequency representations with LSTM to improve robustness in classifying complex time series, such as physiological signals, which all indicate that integrating frequency-domain information with LSTM is a common and effective practice in engineering tasks.
Moreover, in the field of engineering or machinery, the system itself often contains explicit physical laws and physical equations, which can be used as additional constraints to assist neural network training and enhance the explainability of neural network model, especially in the case of limited data. Raissi et al. 25 proposed the concept of Physics-Informed Neural Networks (PINNs), which embed physical constraints directly into the neural network loss function. This enables a fusion of data-driven learning with physics-based modeling. For example, Chen et al. 26 incorporated prior knowledge of bearing degradation into the loss term to predict remaining useful life (RUL), thereby improving both accuracy and physical consistency. Even without solutions to the partial differential equations, PINNs have shown strong adaptability to real-world engineering applications and is a promising framework in data-scarce environments.
Existing studies either rely on purely data-driven models such as LSTM, which struggle to capture complex frequency-domain characteristics or incorporates frequency-domain information to enhance feature extraction, yet these approaches still overlook physical consistency. Therefore, there remains a research gap in developing a framework that simultaneously ensures temporal modeling capability, high-frequency feature retention, and physical consistency. Consequently, a soft measurement method based on Hybrid Physics-Informed LSTM and Fourier feature layers to monitor the running condition of the seal interface in mechanical seals was proposed. The model first employs a LSTM network to extract the temporal characteristics of the AE signal, effectively modeling the time-dependent behavior of the non-stationary signal. Then, a Fourier feature mapping layer is introduced, which projects the input into a higher-dimensional frequency-related space, thereby enabling the model to better represent frequency characteristics—particularly the high-frequency components that contain critical tribological information for seal condition monitoring. Moreover, physical domain knowledge is incorporated through a power-law attenuation formula. The attenuation coefficient is treated as a trainable parameter, guiding the model toward physically consistent signal recovery. This hybrid design represents a novel framework that addresses both the frequency-domain drawbacks of conventional models and the lack of physical guidance in purely data-driven methods, improving the recovery accuracy.
LSTM, Fourier feature layer, and attenuation power-law formula
LSTM
LSTM is a special type of RNN designed to address the gradient vanishing or explosion problem in long sequences. 27 By introducing gating mechanisms, it effectively retains and updates long-term dependencies, improving the model’s learning ability and stability.
At time step t, the LSTM unit calculates the value of each gate based on the current input xt and the hidden state ht−1 at the previous moment by gating the following mechanism:

W and b are the weight matrix and the bias term, respectively. LSTM consists of a forget gate
Subsequently, the cell state and hidden state are updated according to the following equations:

where ⊙ denotes the element-wise (Hadamard) product. The cell state
Fourier feature layer
Neural Networks learns frequency functions on low-dimensional inputs (such as coordinates and time series) by explicitly mapping Fourier features (projecting the input into a frequency sine/cosine space). 21
Standard Multilayer Perceptron (MLP) is difficult to learn high frequency signals both in theory and practice, that is called “spectral bias.” In order to overcome this bias, the Fourier feature mapping function γ is used to transform the input, and then it is sent into the MLP network. Let the input be

this mapping function transforms the neural tangent kernel (NTK) into a stationary kernel, which the parameters bj determine the frequency spectrum of the mapping and are generally initialized from a Gaussian distribution, while aj control the relative amplitude and are initialized uniformly. Both parameters are optimized during training to balance low- and high-frequency components, which is critical for alleviating spectral bias and enhancing high-frequency feature extraction.
Attenuation power-law formula
Physical-Informed Neural Network (PINN)—such as empirical formulas or conservation law into the neural network loss function to improve model accuracy and interpretability. Attenuation may arise as a result of reflection, refraction, diffraction, or scattering of the wave. 28 Beyond these, attenuation is also dependent on frequency. 29 Mamvura et al.’s 28 study shows that acoustic emission signals propagate in solids in the form of exponential attenuation, expressed by the formula:

where

Evaluation metrics
To quantitatively evaluate the reconstruction accuracy, the root mean square error (RMSE) is adopted. It is defined as:

where
The physical-informed LSTM with Fourier feature layers network (PILFN)
To monitor the running condition at the seal interface, it is essential to recover internal acoustic emission (AE) signals that reflect the true tribological state, which are otherwise attenuated during propagation. This recovery process can be regarded as a soft measurement task, where the attenuation AE signals collected from nearby components are used to infer the true signal that are difficult to measure directly. Given the time-dependent and non-stationary nature of AE signals, LSTM networks are employed to model their temporal dependencies and dynamic changes. The LSTM-based structure serves as the core of the soft measurement framework, allowing us to learn the temporal mapping between the attenuation signals and the true AE signals.
However, conventional LSTM networks may struggle to capture frequency components that carry key tribological information due to the signal attenuation in the propagation process. To address this limitation, a Fourier Feature Layer was incorporated into the model to enhance the representation of frequency information. This technique maps the original input into a frequency domain space, improving the model’s sensitivity to rapid signal changes and aiding the extraction of fine-grained features. Moreover, in order to constrain the recovery process with physically consistent behavior, the AE signal attenuation law was embedded to expressed via a power-law formulation into the model as a physical prior. This physics-informed component guides the network to reconstruct AE signals that not only fit the observed data but also adhere to known propagation characteristics.
The structure of the PILFN model
Figure 1 illustrates the structure of the PILFN, which contains four parts. The indirectly measured data

The structure of PILFN model.
Soft measurement method based on the PILFN model
Followed by, based on the PILFN model, the soft measurement is proposed. The flowchart of soft measurement based on the PILFN is showed in Figure 2. Firstly, the AE signal in different conditions was measured separately by indirect measurement sensor and the direct measurement sensor at the data preparing part. The original data signal was preprocessed by removing the mean, discrete and taking the window, and then converts the part of the data of the windowed part into a program-readable matrix form. Second, the data under two different measurement methods are formed into datasets that includes time series information and are delivered to the network based on the PILFN. Finally, the soft measurement model was formed. When a series of AE signal measured by the indirect measurement sensor delivered to the soft measurement model through constant calibration, a series signal close to the true AE signal can be obtained.

The flowchart soft measurement based on the PILFN model.
Test, results, and discussion
The test rig of mechanical seal
The test mechanical seal showed in Figure 3 and the test rig of mechanical seal is shown in Figure 4, the test mechanical seal is mounted in the chamber, and the mechanical seal mainly comprises the rotation ring, stationary ring, spring, and the secondary seals four components. The material of the stationary ring and rotation ring is graphite and silicon carbide. Rotation ring and stationary ring together constitute the seal faces, the rotation ring is the primary ring, moves in tandem with shaft, stationary ring is designed to form a sealing pair with the primary ring. The secondary seals are components that provide static sealing area within the mechanical seal assembly which improve the seal’s performance and reliability. The spring provide the necessary load to the seal faces, ensuring the constant contact between stationary ring and rotation ring.

The test mechanical seal: (a) entity structure of the mechanical seal and (b) dimensional configuration of the mechanical seal.

The test rig of mechanical seal: (a) the perspective of chamber for test rig of mechanical seal, (b) the arrange of sensors for test rig of mechanical seal and (c) the overall for test rig of mechanical seal.
One AE sensor (GM150) directly measures the data of seal interface and reflects the accurate tribological condition of seal interface, which is installed on the back of the stationery ring and another sensor (G150) mounted on the chamber, indirectly measures the data of seal interface which exist attenuation. In the flowing description, the designation of measured data by different sensor was separately substituted by G150 and GM150 as shown in Table 1. The sampling rate of AE sensors are 1 MHz and 1 million sampling points will be measured.
The substitution of the designation of data measured by different sensor

It should be noted that the GM150 sensor has a frequency response range of 3–380 kHz, while the G150 sensor covers 3–450 kHz. To ensure reliability, only the frequency components below 380 kHz were considered valid in this study. Signals above 400 kHz cannot be guaranteed to be accurate due to the inherent limitations of the sensor frequency response.
The introduction of test data
In order to validate the viability of the soft measurement in different running states, the fault of the mechanical seal was simulated by applying different width of laser treatment to the rotation ring, and the groove width includes two types, 0.1 and 0.3 mm, and measured acoustic emission data at 3000 r/min, and then generated a test dataset showed in Table 2. Take the three operating conditions separately as normal condition, RR0.1 and RR0.3. The simulated damage situation figures are shown in Figure 5.
The description of the test datasets.

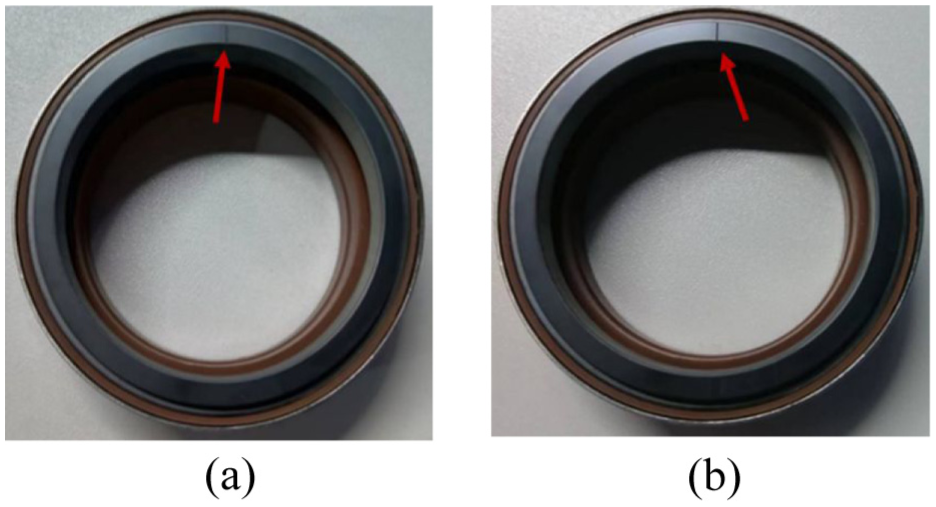
Simulated faults for rotating ring: (a) RR0.1 and (b) RR0.3.
Before data collection, the AE sensors were calibrated by the equipment supplier to ensure measurement accuracy and consistency. The PXIe-9818 high-speed digitizer provides high-speed, high-quality synchronous data acquisition, ensuring temporal alignment of the recorded signals. Furthermore, to enhance signal quality and ensure data stability and reliability for model training, the acquired AE signals were pre-processed by de-mean operation, de-trend, and outlier removal based on the Z-score criterion. Due to the large sampling frequency and large amount of data in the original data, in order to facilitate the training, the data is truncated to select part of the length for training. Subsequently, the data in three states were mixed together to train for optimizing the hyperparameter and then test the three conditions separately. The hyperparameters were set up to be optimized during training to optimize the model, and the detailed hyperparameters are described in Table 3.
The description of the hyperparameters.

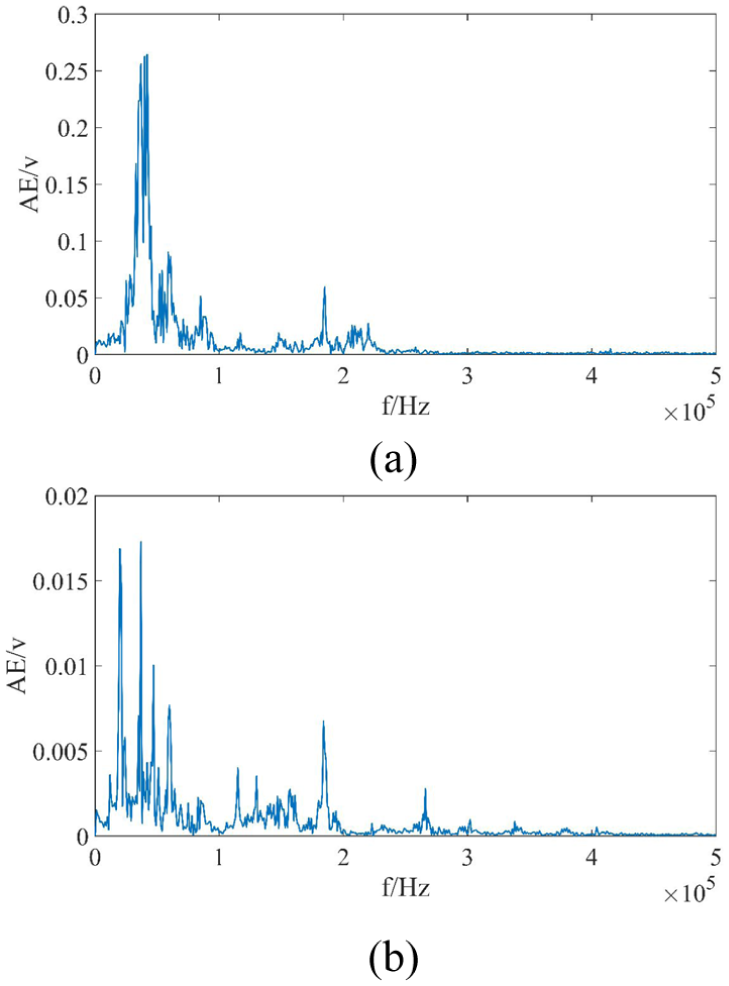
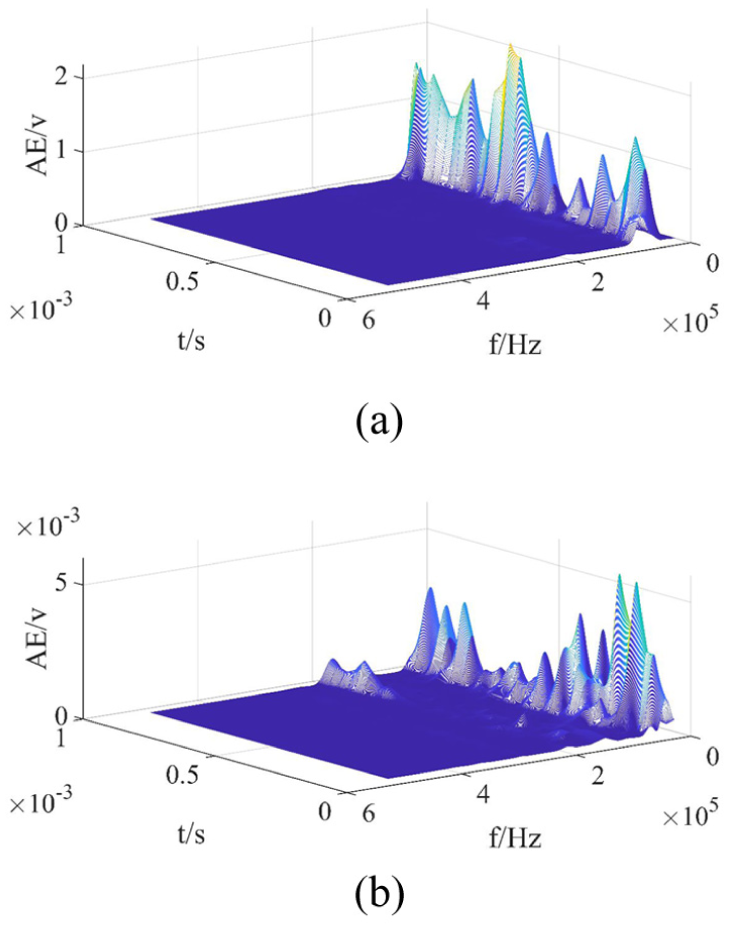
In order to verify the validity of the reference signal, a background noise test was conducted. The sensor layout and acquisition parameters were kept identical to those in the sealing experiments. The recorded AE waveforms exhibited extremely small amplitudes in the time domain, and the corresponding frequency-domain spectra results showed negligible components. This indicates that the background noise and structural vibration interference are minimal, and that the high-frequency features observed in the sealing experiments are primarily generated by the sealing friction process rather than environmental noise. The time-domain diagram, FFT diagrams of G150 and GM150 under the background noise test are shown in Figures 6 and 7.

The wave form of background noise test: (a) G150 and (b) GM150.
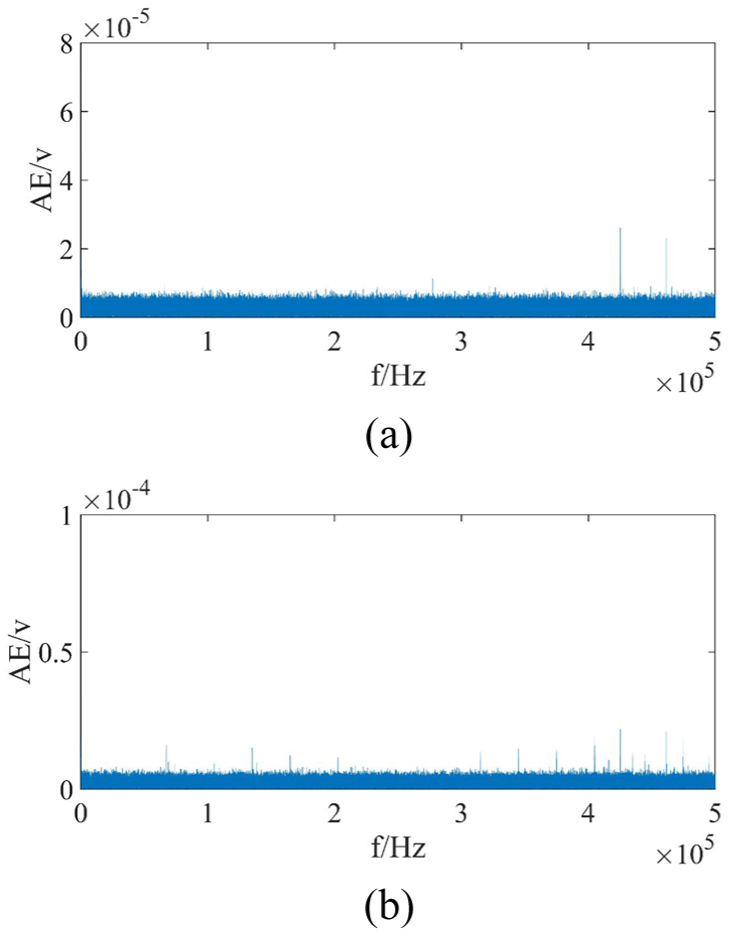
The FFT of background noise test: (a) G150 and (b) GM150.
The time domain waveform can judge the operating condition of the seal interface through the time-domain waveform amplitude, spikes, and comparison of before and after states. The FFT can definitely show the main frequency components of the signal. The STFT plot can reflect how the frequency of signal changes at different time points obviously.
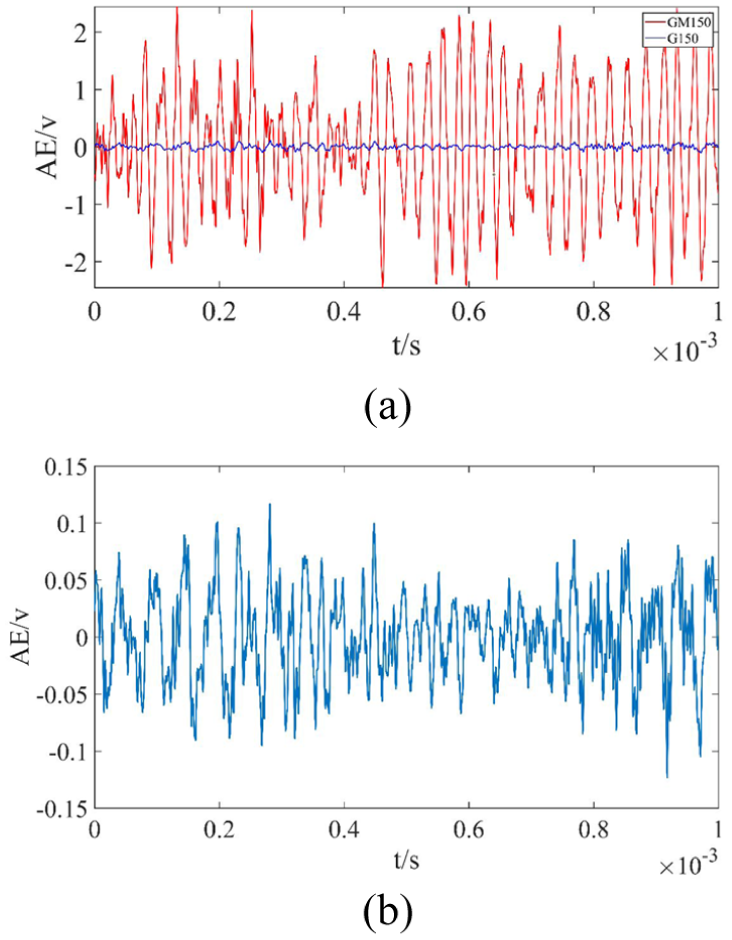
The waveform, FFT of G150 & GM150 showed in Figures 8 and 9. Under the normal condition, the time series plot of G150 presents relatively limited amplitude, indicating signal attenuation during propagation. In contrast, GM150 exhibits higher amplitude, indicating stronger signal responses generated at the seal interface. The FFT plot further supports this observation: G150 shows lower energy in all frequency bands, while GM150 retains high-frequency components, which are crucial for capturing tribological contact behavior.

The wave form of GM150 and G150 under normal condition: (a) GM150 and G150 and (b) G150.
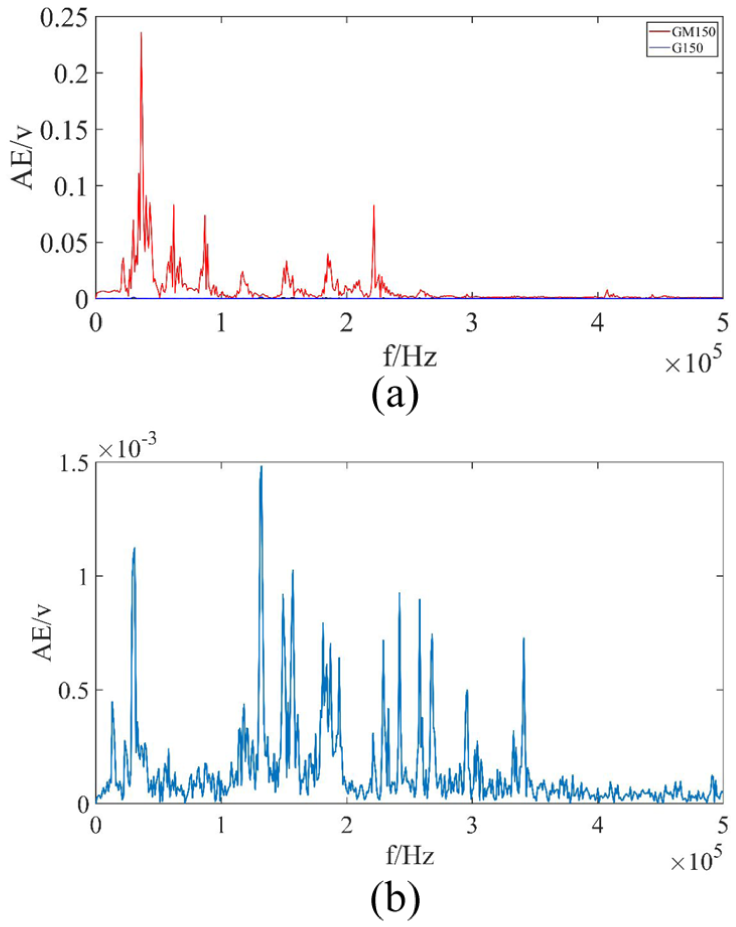
The FFT of GM150 and G150 under normal condition: (a) GM150 and G150 and (b) G150.
The waveform, FFT of G150 & GM150 under RR0.1 condition showed in Figures 10 and 11. Under RR0.1 condition, the time-domain waveform of GM150 and G150 shows an increase in amplitude compare to normal condition, suggesting the presence of initial abnormal tribological contact or wear. In the FFT plots, GM150 contains strong peaks in both low and mid-frequency ranges, while G150 shows dampened frequency content.

The wave form of GM150 and G150 under RR0.1 condition: (a) GM150 and G150 and (b) G150.

The FFT of GM150 and G150 under RR0.1 condition: (a) GM150 and G150 and (b) G150.
The waveform, FFT of original G150 and GM150 under RR0.3 condition showed in Figures 12 and 13. Under RR0.3 condition, compared with normal conditions, GM150 and G150 still show higher amplitude.
The wave form of GM150 and G150 under RR0.3 condition: (a) GM150 and G150 and (b) G150.

The FFT of GM150 and G150 under RR0.3 condition: (a) GM150 and G150 and (b) G150.
The waveform, FFT representations of G150 exhibit a common limitation: high-frequency features crucial to tribological monitoring are significantly attenuated due to signal propagation. As a result, signal amplitude decreases, and the high frequency component are missing, highlighting the need for signal reconstruction through soft measurement methods.
The waveform, FFT diagrams of GM150 under various conditions share consistent features, including clear high-frequency components, complete signal structures, and coherent changes with operating conditions. These characteristics confirm that GM150 signals provide high-fidelity tribological information suitable for use as ground truth in soft measurement evaluation.
The results of reconstructed G150 recovered by PILFN
The reconstructed G150 using PILFN model under normal condition is showed in Figures 14 to 16(a). The reconstructed G150 using PILFN model under RR0.1 condition is showed in Figures 17 to 19(a). The reconstructed G150 using PILFN model under RR0.3 condition is showed in Figures 20 to 22(a).

The wave form comparison between PILFN model and LSTM-only under normal condition: (a) reconstructed G150 by PILFN and (b) reconstructed G150 by LSTM-only.

The FFT comparison between PILFN model and LSTM-only under normal condition: (a) reconstructed G150 by PILFN and (b) reconstructed G150 by LSTM-only.

The STFT comparison between PILFN model and LSTM-only under normal condition: (a) reconstructed G150 by PILFN and (b) reconstructed G150 by LSTM-only.

The wave form comparison between PILFN model and LSTM-only under RR0.1 condition: (a) reconstructed G150 by PILFN and (b) reconstructed G150 by LSTM-only.

The FFT comparison between PILFN model and LSTM-only under RR0.1 condition: (a) reconstructed G150 by PILFN and (b) reconstructed G150 by LSTM-only.

The STFT comparison between PILFN model and LSTM-only under RR0.1 condition: (a) reconstructed G150 by PILFN and (b) reconstructed G150 by LSTM-only.

The wave form comparison between PILFN model and LSTM-only under RR0.3 condition: (a) reconstructed G150 by PILFN and (b) reconstructed G150 by LSTM-only.
The FFT comparison between PILFN model and LSTM-only under RR0.3 condition: (a) reconstructed G150 by PILFN and (b) reconstructed G150 by LSTM-only.
The STFT comparison between PILFN model and LSTM-only under RR0.1 condition: (a) reconstructed G150 by PILFN and (b) reconstructed G150 by LSTM-only.
The hyperparameter optimization training results are showed in Table 4.
The results of the hyperparameters optimization.

Ablation and comparative experiment: LSTM-only model
To further verify the necessity and effectiveness of the proposed PILFN model, we conducted an ablation and comparative experiment by removing the Fourier feature layer and the physics-informed module, retaining only the LSTM model, which represents the mainstream deep learning method for time series regression tasks. This setting corresponds to a pure data-driven model without incorporating frequency-domain features or physical prior knowledge.
The reconstructed G150 by LSTM-only under normal condition is showed in Figures 14 to 16(b). The reconstructed G150 by LSTM-only under RR0.1 condition is showed in Figures 17 to 19(b). The reconstructed G150 by LSTM-only under RR0.3 condition is showed in Figures 20 to 22(b).
Comparison and discussion
To evaluate reconstruction performance under different operating conditions, the RMSE values obtained by PILFN and LSTM-only are compared. As shown in Table 5, PILFN exhibits consistently lower errors than LSTM-only, highlighting the necessity of integrating Fourier features and physical priors.
RMSE values of signal reconstruction for PILFN and LSTM-only.

Comparison with result and true GM150 under normal condition
Under normal condition, the reconstructed G150 signal from PILFN shows closer similarity to GM150 in both time and frequency domains. The time-domain waveform recovers amplitude variations, the FFT restores high-frequency components, and the STFT shows clearer time–frequency evolution. Compared with LSTM-only model, which fails to recover high-frequency content and produces blurred time–frequency bands, PILFN demonstrates a significant advantage in preserving tribological features.
Comparison with result and true GM150 under RR0.1 condition
At RR0.1, the reconstructed signal with PILFN restores amplitude modulation, frequency peaks, and richer time–frequency components, resembling GM150 more closely. In contrast, LSTM-only model reconstruction shows limited improvement and fails to capture early fault-related spectral details, highlighting the effectiveness of PILFN.
Comparison with result and true GM150 under RR0.3 condition
At RR0.3, PILFN reconstruction successfully recovers the strong oscillations and periodic bursts in the GM150 signal. Both FFT and STFT results confirm that high-frequency fault characteristics are well recovered. By comparison, LSTM-only model produces weak and incomplete recovery, struggling to recover the accurate information, whereas PILFN maintains robustness even under harsher conditions.
The ablation study confirms that both the Fourier feature layer and the physics-informed module are indispensable components of the proposed framework, and the combination of them with LSTM achieves superior predictive performance compared to the LSTM-only. Overall, the soft measurement via PILFN consistently recovers higher amplitudes, recovers missing high-frequency information, and provides richer tribological features than the original G150 signal. Compared with LSTM-only, PILFN yields clearer and more accurate reconstruction across all operating states, validating its advantage in condition monitoring.
Conclusion
In order to develop a soft measurement method that reconstructs AE signals from attenuated measurements, thereby enhancing their effectiveness for seal condition monitoring, this study proposes a physics-informed LSTM–Fourier network (PILFN) for soft measurement of mechanical seals. By combining Fourier-enhanced inputs, LSTM-based temporal modeling, and a physics-informed attenuation constraint, the method balances learning flexibility with physical plausibility.
Experiments show that PILFN reconstructs AE signals at the seal interface more accurately than the LSTM-only model, with higher amplitude fidelity, richer frequency content, and clearer time–frequency structures. These improvements enable more reliable extraction of tribological features such as dry contact and wear severity, providing a solid basis for real-time condition monitoring.
While the framework demonstrates clear advantages, its current design still relies on a simplified representation of the physical attenuation process. Although a physics-informed constraint has been incorporated, the integration of physical knowledge remains preliminary and could be further refined to better capture the complex tribological mechanisms of the sealing interface. Future work will therefore focus on enhancing the physical modeling component, for example by introducing more detailed tribological priors, while also extending the framework toward diagnostic and prognostic modules to support predictive maintenance.
Footnotes
Handling Editor: Carmen Bujoreanu
Author contributions
Longfei Shi: Writing-original draft, Software, Data curation. Ruyi Li: Writing-original draft, Software, Data curation. Shuyang Liu: Writing-original draft, Software, Data curation. Chen He: Data curation. Xiaoran Zhu: Supervision, Conceptualization, Methodology, Writing-review & Editing, Data curation. Peng Yue: Funding acquisition, Supervision.
Funding
The authors disclosed receipt of the following financial support for the research, authorship, and/or publication of this article: This research is supported by the International Cooperation Project of Science and Technology of Henan (252102521092) and Project of Science and Technology of Henan (242102220071).
Declaration of conflicting interests
The authors declared no potential conflicts of interest with respect to the research, authorship, and/or publication of this article.