
Abstract
High-precision part welding imposes stringent requirements on ambient temperature, making efficient temperature control within the welding chamber a critical prerequisite for ensuring weld quality. This study focuses on optimizing the ventilation layout design of a welding chamber in a high-precision welding production line, aiming to achieve rapid and stable temperature control within the target range of (310 ± 1) K, thereby ensuring high-precision welding quality under specific temperature conditions. Based on an established finite element model of the welding chamber, three-dimensional steady-state fluid-thermal coupling numerical simulations were conducted. The influence of varying the number and positions of air inlets on the temperature distribution inside the welding chamber was analyzed. Using orthogonal experiments, range analysis, and variance analysis, the position parameters of the air inlets were optimized with the objective of minimizing the time required for the temperature field to reach the target stable range. The optimal ventilation layout was determined: employing six air inlets, uniformly and symmetrically arranged along the top, bottom, left, and right directions of the welding chamber. This optimized solution significantly reduces the temperature stabilization time and effectively enhances the temperature control efficiency of the welding chamber, providing reliable support for the stable implementation of high-precision welding processes.
Keywords
Introduction
High-precision part welding imposes stringent requirements on ambient temperature, making efficient temperature control within the welding chamber a critical prerequisite for ensuring weld quality. To maintain a constant process temperature, ventilation systems are typically installed in welding chambers. However, unreasonable equipment placement and configuration not only increase procurement costs but also compromise temperature control efficiency.1,2 Thus, optimizing the ventilation layout design of welding chambers is of utmost importance.
This study focuses on a high-precision structural component for spacecraft. Process practice indicates that welding within a temperature range of (310 ± 1) K meets the technical standards. However, obtaining detailed flow field and temperature data inside the welding chamber through experiments is complex, costly, and time-consuming.3,4 In contrast, finite element simulation based on fluid-thermal coupling theory offers a significant advantage.
Fluid-thermal coupling problems have attracted extensive scholarly attention. For example, Li and Li 5 conducted a fluid-thermal coupling analysis of a wind tunnel support model using CFX software, which revealed the distribution patterns of temperature and flow velocity on the model surface. Calzolari and Liu 6 investigated grid generation strategies for turbulence models applicable to fluid simulations, providing methodological guidance for the mesh division in this study. Cui et al. 7 established a fluid-thermal coupling calculation method by solving the fluid dynamics continuity equation and turbulence model, which achieved high consistency with experimental results and laid the theoretical foundation for this research. In summary, finite element simulation methods based on fluid-thermal coupling theory have become an important means of studying indoor airflow.
However, existing research has primarily focused on ventilation in large factory buildings, emphasizing overall dust removal and cooling.8–12 These studies typically address three scenarios:
Large industrial plants (e.g. machining workshops), where the goal is macroscopic dust removal and cooling, without considering ultra-narrow range temperature stability.
Civil buildings (e.g. high-rise residences), where ventilation design centers on human thermal comfort, airflow velocity, and humidity regulation, which is unrelated to welding temperature control.
Urban tunnels and utility tunnels, where the primary goal is removing harmful gases, with temperature control being only a secondary concern.
Conversely, studies on the ventilation layout of specialized environments such as high-precision welding chambers with strict temperature control requirements remain insufficient. Existing research rarely takes into account the ultra-narrow temperature control range requirement (such as ±1 K) for high-precision welding processes, especially in the context of welding high-precision components for spacecraft. Consequently, there is a lack of studies on optimized ventilation systems for welding aerospace precision components. Systematic research on the number, position, and layout of ventilation openings, based on fluid-thermal coupling theory, is still needed.
This study focuses on optimizing the ventilation layout design of the welding chamber in a high-precision welding production line. The core objective is to quickly stabilize the temperature within the welding chamber within the range of (310 ± 1) K, thereby filling the research gap in combining ventilation layout optimization with high-precision temperature control requirements in aerospace welding scenarios.
To address this gap, we established a full-scale three-dimensional (3D) finite element model of the welding chamber using the CFX module in ANSYS Workbench, which included the high-precision structural component. We then systematically analyzed how the number and position of air inlets influenced the temperature distribution via fluid-thermal coupling simulations. Furthermore, employing orthogonal experiments, range analysis, and variance analysis methods, we optimized the ventilation position parameters with the temperature field stabilization time as the objective function to determine the optimal layout scheme. This approach significantly reduces experimental costs and timeframes, offering valuable insights for related research fields.
Design and analysis
Computational fundamentals
Fluid dynamics continuity equation
The continuity equation describes the law of mass conservation in fluid mechanics. Under the assumption of a continuous medium, the time rate of change of fluid mass within an arbitrary control volume is equal to the net mass flow rate through its boundaries.13–15 Its differential form is given by:
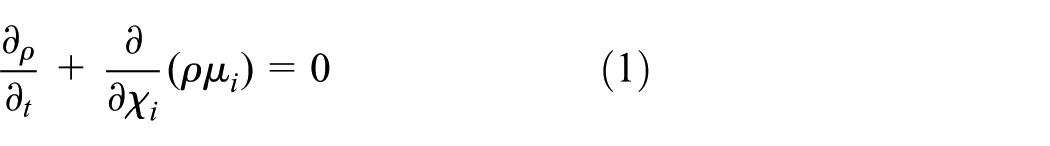
Where t is time, ρ is fluid density,
Turbulence model
When the flow Reynolds number (Re) exceeds a critical value, the fluid exhibits turbulent flow characterized by high complexity and irregularity, which significantly increases the computational complexity of numerical simulations.16,17 This study employed the SST k-ω turbulence model integrated in the CFX module. This model combines the robustness of the k-ω formulation in the far field with its accuracy in near-wall regions, offering excellent precision and reliability.18,19 Its governing equations are as follows:

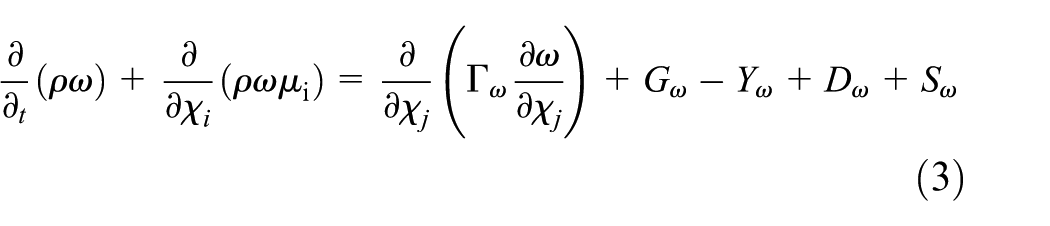
Where G
k
is turbulent kinetic energy, G
w
is the generation term of dissipation rate,
Based on the above theoretical foundation, a fluid-thermal coupling finite element simulation model of the welding chamber was established.
Geometric modeling
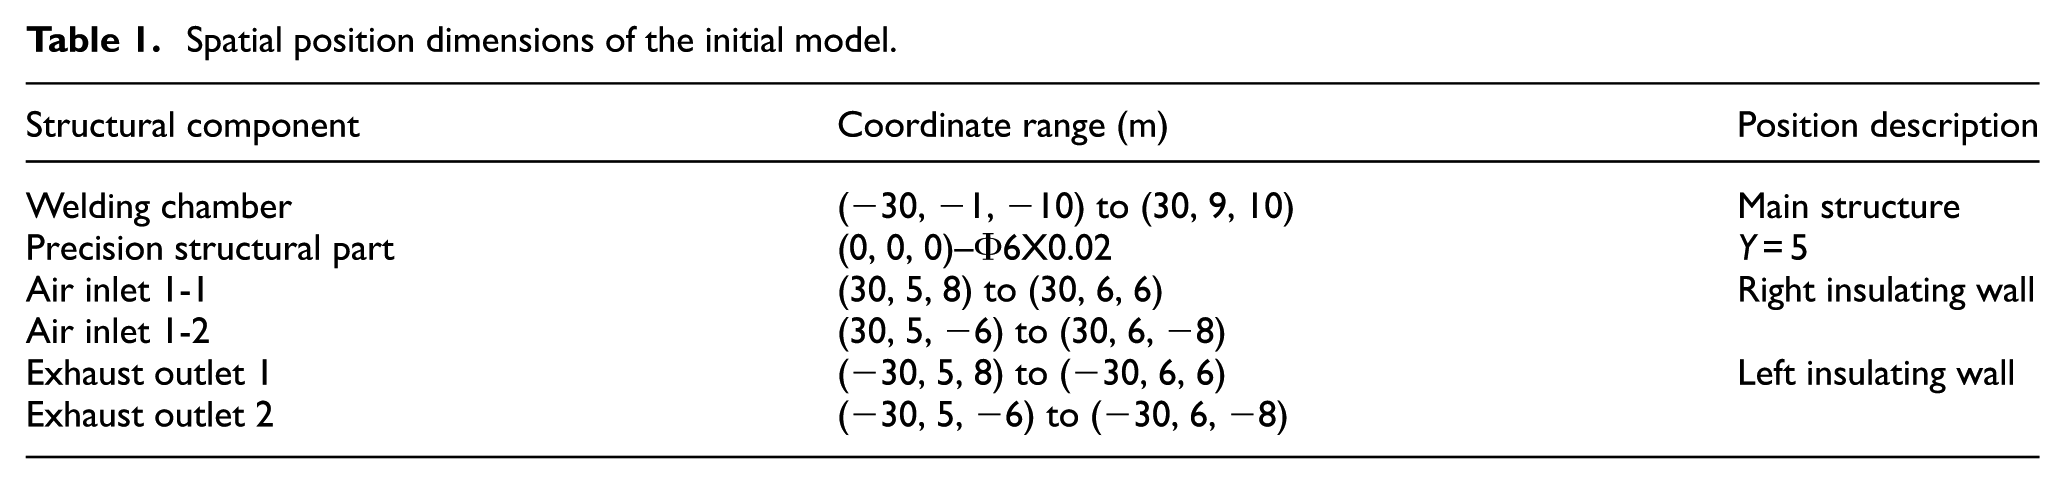
A full-scale geometric model was constructed using the Design Modeler module in Workbench based on the actual dimensions of the welding chamber. During the modeling process, ancillary structures such as doors and windows were appropriately simplified. Ventilation openings were arranged on the surrounding walls based on the chamber’s environment, with their diameters determined according to the equipment specifications. The main components of the model include the welding chamber body, the precision structural component, two air inlets, and two exhaust outlets. The spatial dimensions of each structure are detailed in Table 1, and the overall layout is illustrated in Figure 1, where components are labeled with text annotations.
Spatial position dimensions of the initial model.

Overall spatial layout diagram.
Material properties
The research object is a large precision structural component for spacecraft (7 m in height, 3 m in width), manufactured from high-performance 2214 aluminum alloy. To accurately simulate its fluid-thermal coupling characteristics, the physical property parameters of the material were precisely defined in the numerical model. The specific parameters are listed in Table 2. 20
Physical property parameters of 2214 aluminum alloy.

Based on comprehensive considerations of computational efficiency and engineering accuracy, the model was simplified. The chamber walls were set as adiabatic boundary conditions, neglecting heat exchange with the external environment. The computational domain outside the solid structural components was defined as air medium, with its physical properties assigned according to standard atmospheric conditions. 21
Mesh generation
The computational domain of the welding chamber was discretized using the ICEM CFD module in Workbench. An unstructured grid generation strategy was employed. Based on a reasonable simplification of the geometric model, local grid refinement was applied to the air inlet regions. When the grid size was reduced to 10 mm, the distribution pattern of the temperature field stabilized, and the oscillation amplitude of the numerical solution was less than 1%, meeting the requirements for computational convergence. The final grid parameters were as follows: a refined boundary layer grid size of 5 mm at the air inlets, a total of 909,941 nodes, and 4,520,160 elements. The mesh generation result (Figure 2) shows a uniform grid distribution in the main region, with gradient refinement at the air inlets and good orthogonality of the boundary layer grids.
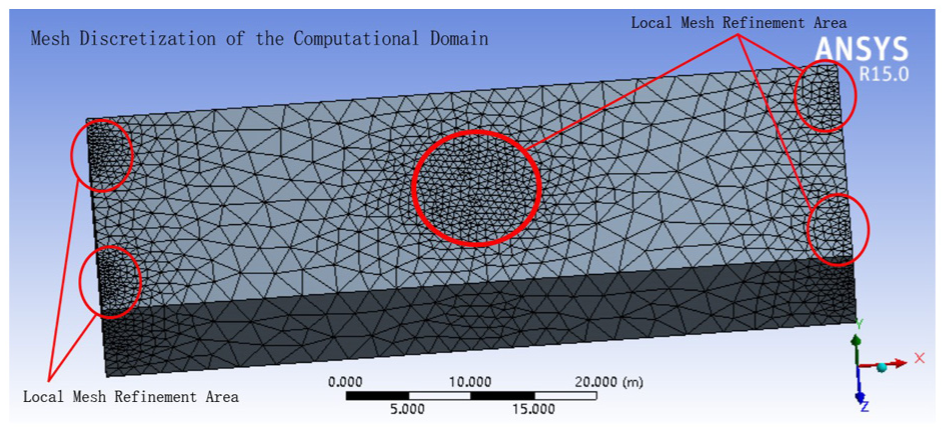
Refined mesh diagram.
Boundary conditions and solver setup
After mesh generation was completed, boundary conditions and initial parameters were defined in the CFX-Pre module, as listed in Table 3. A “velocity inlet-pressure outlet” combination was used for the boundary condition setup. The two air inlets were defined as velocity inlets, assigned a normal velocity of 8 m/s and a total temperature of 310 K to characterize the mass flow rate and enthalpy at the inlet. The two exhaust outlets were defined as pressure outlets, with a static pressure of 1 atm, providing a fully developed outflow boundary for the fluid. This configuration accurately corresponds to the physical process of forced convection heat transfer.
Initial condition parameter settings.
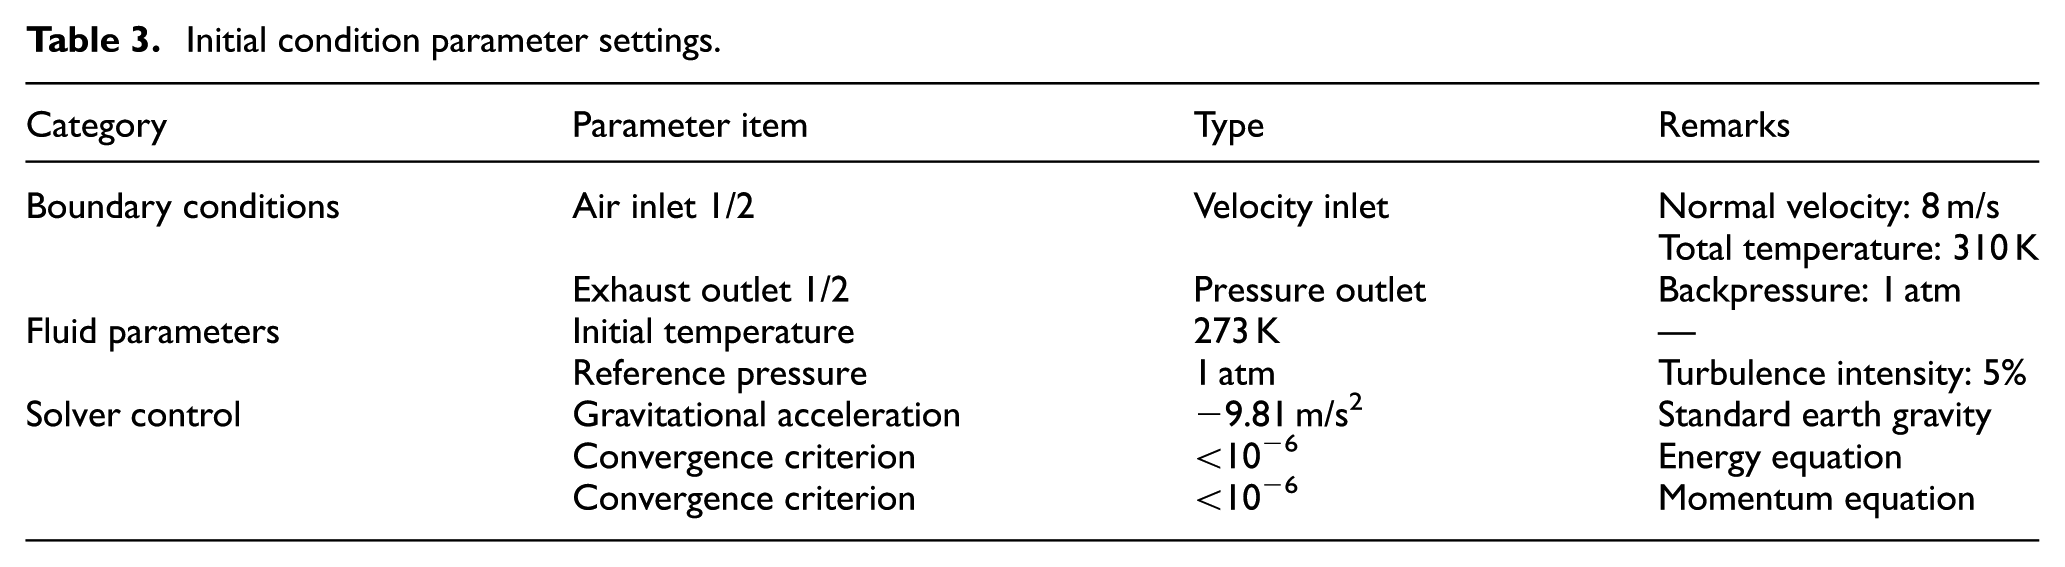
The fluid medium was set as air conforming to the ideal gas law, with an initial temperature field of 273 K. The model accounted for the effect of standard Earth gravity (−9.81 m/s2). Solver convergence was monitored via equation residuals, with the residual targets for the energy equation and momentum equation set to less than 10−6 and 10−5, respectively. These strict convergence criteria ensured the high precision and reliability of the numerical solution.
Results and discussion
Initial model calculation results
Based on the fluid-thermal coupling heat transfer model, transient numerical simulations (total duration: 3600 s) were performed using the CFX solver to analyze the evolution of the temperature field within the welding chamber. The results indicated that the chamber reached thermal equilibrium within 1500 s, with the temperature stabilizing within the range of (310 ± 1) K. Figure 3 shows the temperature distribution contours on the Y = 5 m cross-section at characteristic time points. The temperature evolution process was as follows:
Initial phase (t = 400 s): The temperature field begins to evolve from its initial uniform state (273 K), with low-temperature regions (blue) migrating toward the outlet along with the airflow.
Transition phase (t = 800 s): The medium-temperature region (green) expands significantly, and a high-temperature core region (orange) begins to form.
Stable phase (t = 1500 s): The temperature field stabilizes, with the entire domain reaching the target value (310 K). The high-temperature region (red) accounted for over 90% of the area.

Temperature distribution contours at typical time points.
To quantitatively evaluate the temperature field evolution, a monitoring path (Path 1) was set along the main airflow direction (Figure 4), with 11 temperature monitoring points (S1–S11) equally spaced along it. The temperature-time history curves for each point are shown in Figure 5. The results showed that the temperature rise rate near the air inlets (S1–S4) was significantly higher than in the downstream regions. All monitoring points reached 310 ± 1 K at t = 1420 ± 30 s. The parameters for each monitoring region are listed in Table 4.

Layout diagram of monitoring path 1 and the 11 monitoring points.

Temperature variation curves at coordinate points over time.
Parameter values of monitoring regions.

Influence of air inlet configuration on temperature field distribution
Using the finite element model, we systematically investigated the influence of the number and spatial layout of air inlets on the temperature field distribution.
Influence of air inlet number on temperature field distribution
The number of air inlets is a critical design parameter affecting the heat transfer efficiency of the welding chamber. An insufficient number reduces heat exchange efficiency, delaying the temperature response. Conversely, excessively increasing the number yields diminishing marginal benefits and increases system complexity and cost. 22 Therefore, optimizing the number of air inlets is essential for efficient temperature control.
This study adopted the control variable method, maintaining constant chamber dimensions, heat source parameters, and exhaust configuration. Four comparative schemes (4/6/8/10 inlets) were constructed, as shown in Figure 6. The spatial coordinates of the air inlets for each scheme are detailed in Table 5.

Layout diagrams of the four configuration schemes: (a) four air inlets, (b) six air inlets, (c) eight air inlets, and (d) ten air inlets.
Spatial layout dimensions of air inlets for the four schemes.

By analyzing the temperature evolution data from the 11 characteristic points along Path 1, the dynamic response characteristics of the different schemes were obtained. Figure 7 shows a comparison of the temperature rise history curves, and key data is summarized in Table 6.

Comparison of temperature rise history curves for the four schemes.
Temperature evolution data at characteristic points (Unit: K).
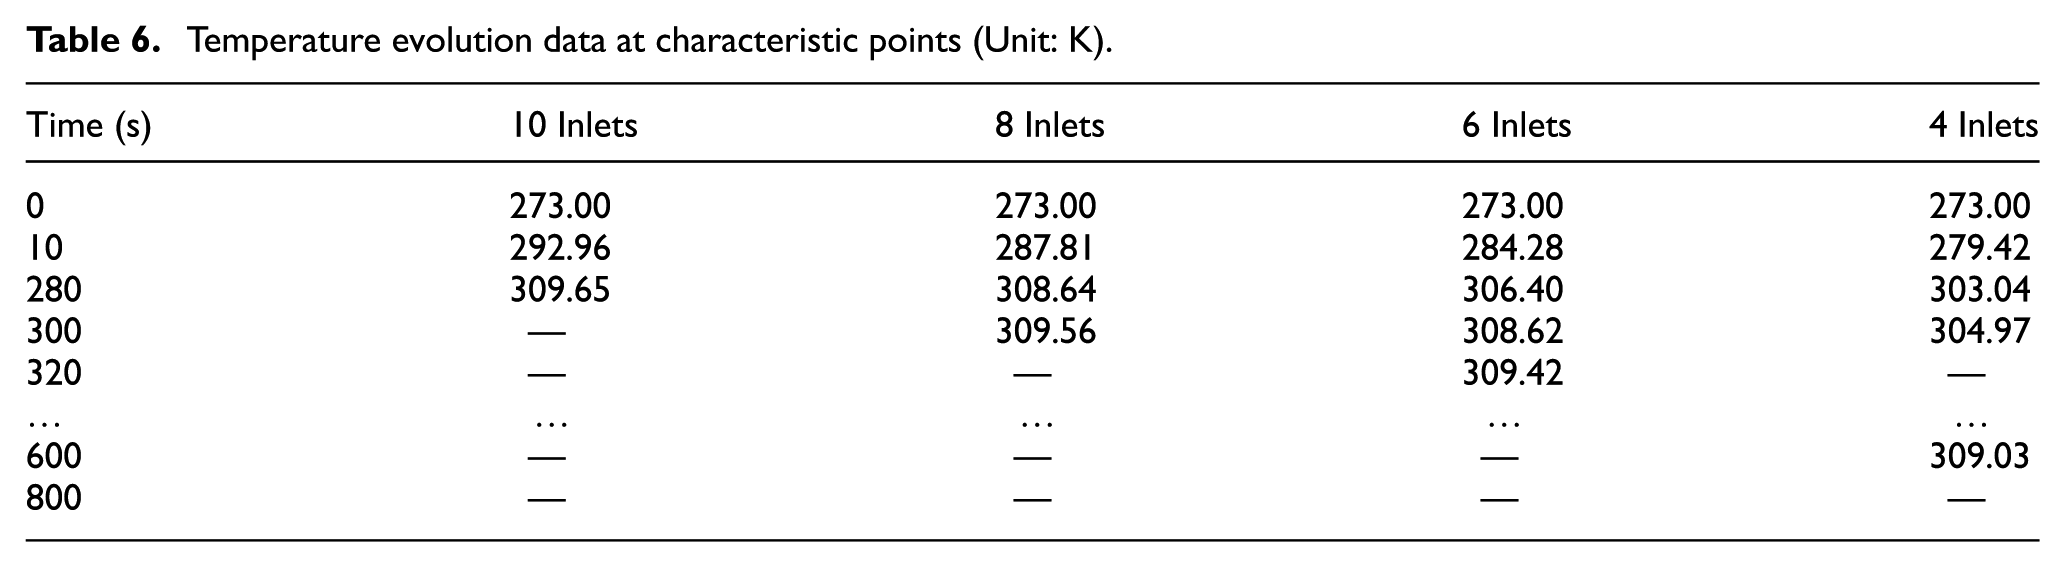
The analysis revealed the following:
Temperature rise kinetic characteristics: All four schemes exhibit typical exponential temperature rise characteristics: rapid initial increase (0–200 s), intermediate transition (200–400 s), and gradual stabilization (>400 s).
Thermal stabilization time comparison: The 4-inlet scheme stabilized at 600 s; the 6-inlet scheme stabilized at 320 s (50% faster than 4-inlet); the 8-inlet scheme stabilized at 300 s; and the 10-inlet scheme stabilized at 280 s.
Economic evaluation: The 6-inlet scheme demonstrated a markedly shorter stabilization time (280 s less) than the 4-inlet scheme (p < 0.01). Compared to the 8-inlet and 10-inlet schemes, the time difference was only 20–40 s (ΔT < 1 K). Marginal benefit analysis revealed that when the number of inlets exceeded six, the improvement in temperature control efficiency per unit cost dropped to 7.14%.
In summary, increasing the number of air inlets effectively reduces the thermal equilibrium time. This mechanism works by enhancing flow field disturbance and improving thermal convection efficiency. The 6-inlet scheme achieves an optimal balance between temperature control efficiency (320 s equilibrium time) and economic considerations (lowest equipment cost). It is noteworthy that the spatial layout of the air inlets also significantly affects the uniformity of the temperature field.
Influence of air inlet spatial layout on temperature field distribution
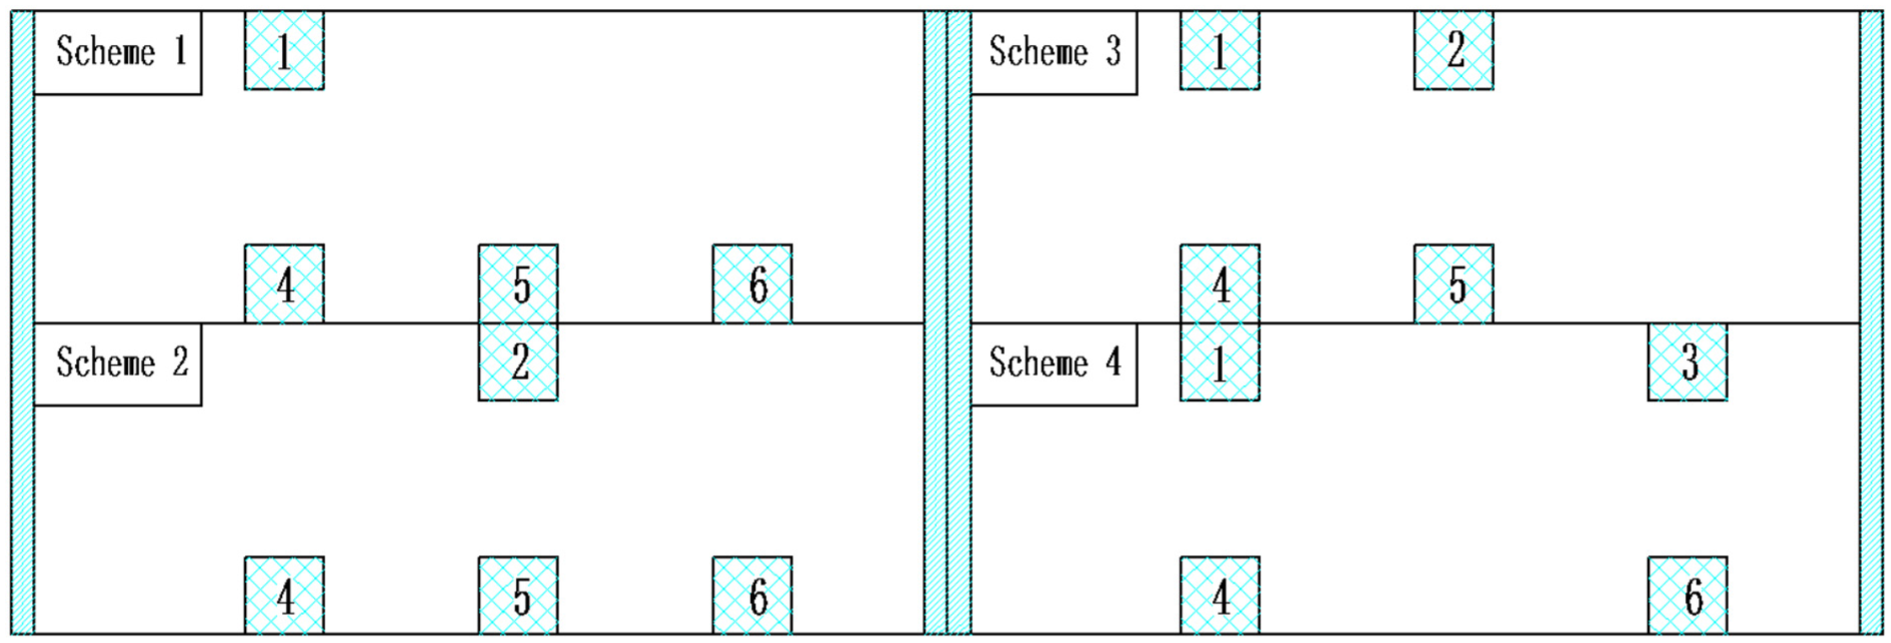
To investigate the influence of air inlet spatial layout on the temperature field distribution in the welding chamber, four comparative schemes were designed under the condition of a fixed number of air inlets (6). By adjusting the spatial distribution of the air inlets, four layout schemes were constructed as shown in Figure 8.
Scheme 1: Points (1, 4, 5, 6)—asymmetric in both vertical and horizontal directions;
Scheme 2: Points (2, 4, 5, 6)—vertically asymmetric/horizontally symmetric;
Scheme 3: Points (1, 2, 4, 5)—vertically symmetric/horizontally asymmetric;
Scheme 4: Points (1, 3, 4, 6)—fully symmetric in both vertical and horizontal directions.
Table 7 quantifies the stabilization time required to reach the target range (310 ± 1) K for each scheme.
Four air inlet layout schemes.
Temperature stabilization times for four air inlet layout schemes.
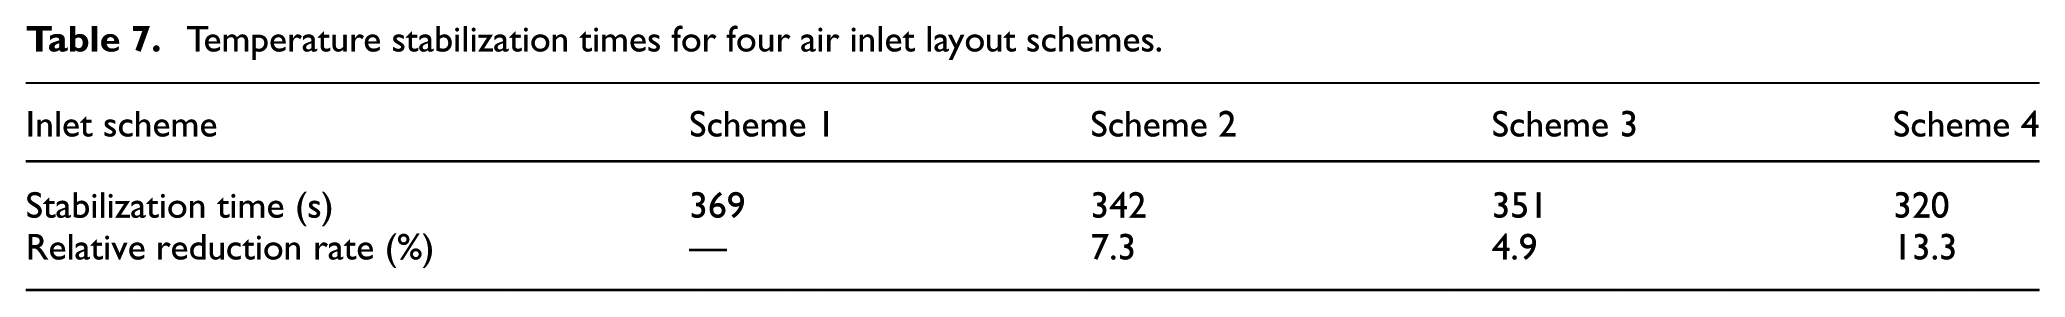
The results in Table 7 show that Scheme 4 has the shortest stabilization time (320 s), representing a 13.3% reduction compared to Scheme 1. Scheme 2 (342 s) and Scheme 3 (351 s) show reductions of 7.3% and 4.9% respectively. In other words, the fully symmetric layout (Scheme 4) achieves the highest temperature rise efficiency, followed by the semi-symmetric layouts (Schemes 2 and 3), while the asymmetric layout (Scheme 1) shows the lowest temperature rise efficiency. This conclusion further demonstrates that the spatial layout of air inlets significantly affects the thermal response characteristics of the welding chamber. Optimizing the symmetry of air inlet distribution can effectively reduce temperature stabilization time and improve heating efficiency. Among the schemes, the fully symmetric layout in both vertical and horizontal directions (Scheme 4) demonstrates the optimal thermal regulation performance, providing an effective approach for achieving precise control of the temperature field in welding processes.
Optimization design of position parameters
To systematically optimize the spatial layout of the 6-inlet scheme, a multi-factor orthogonal experimental design method23,24 was employed. This method, based on the principle of factor separation, efficiently analyzes multi-parameter coupling effects through a limited number of representative experiments, significantly reducing the required number of tests.25,26 This study focuses on the influence of air inlet position parameter combinations on temperature stabilization time.
Orthogonal experimental design
Four air inlet position factors were selected (A: Inlet 2-1, B: Inlet 2-2, C: Inlet 3-1, D: Inlet 3-2), with each factor set at four levels (X-axis coordinate values). The standard orthogonal table L16(44) was used to arrange the experiments. A total of 16 experimental plans were designed; the configuration of each factor level, experimental plan, and corresponding temperature stabilization time are shown in Table 8.
Orthogonal test table for temperature stability time.

Simulation calculations were performed for all 16 orthogonal experimental schemes to obtain the corresponding temperature stabilization times. The stabilization times for different experimental combinations are shown in Figure 9. The results indicate that the sixth experimental group (A15 m, B15 m, C-15 m, D-15 m) achieved the shortest stabilization time (307 s), significantly outperforming other combinations.

Comparison curve of stabilization time for 16 groups of orthogonal experiment.
Range analysis
To quantitatively evaluate the significance of each air inlet position parameter’s influence on temperature stabilization time, range analysis was employed. The sum (K), average (I), and range (R) of the experimental indicators (stabilization time) for each factor at different levels were calculated to determine the primary and secondary order of factors and identify the optimal level combination. 27
Taking the position parameter of Air Inlet 2-1 (Factor A) as an example, the calculation process is shown in equation (4), where y represents the stabilization time obtained from each experiment (unit: s).

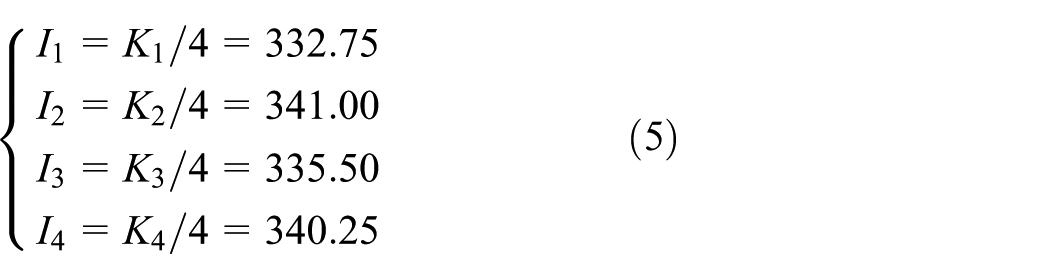

Similarly, the position parameter data for Air Inlet 2-2 (Factor B), Air Inlet 3-1 (Factor C), and Air Inlet 3-2 (Factor D) were calculated, yielding the range analysis results shown in Table 9.
Range analysis data table.

From the range analysis results in Table 9, it can be observed that Factor C (Inlet 3-1) and Factor D (Inlet 3-2) have the largest range (R = 10.50 s), indicating they have the most significant influence on the stabilization time. Factors A (Inlet 2-1) and B (Inlet 2-2) show smaller ranges (R = 8.25 s), suggesting relatively less influence. The order of influence of each factor on temperature stabilization time is: C (Inlet 3-1) = D (Inlet 3-2) > A (Inlet 2-1) = B (Inlet 2-2).
To visually quantify the influence weight of each factor, the relative influence percentage was calculated based on the range (R) values, and the results are presented in the influence weight distribution diagram shown in Figure 10. The results demonstrate that the position parameters of Inlet 3-1 (C) and Inlet 3-2 (D) are most critical for temperature stabilization time, collectively accounting for approximately 56% of the total influence. The influence of Inlet 2-1 (A) and Inlet 2-2 (B) is relatively smaller, collectively accounting for approximately 44%.

Influence weight distribution diagram of position parameters on stabilization time.
Variance analysis
To more accurately quantify the significance of the influence of various position parameters on temperature stabilization time and to assess whether this influence exceeds the range of random errors, variance analysis was conducted following the range analysis. Analysis of Variance (ANOVA) decomposes the total variation of the experimental data into contributions from various factors and random errors, and uses an F-test to determine the statistical significance of each factor’s effect. The results of the analysis of variance are shown in Table 10.
Analysis of variance of temperature stability time.

According to Table 10, the F-values for factor C (inlet 3-1) and factor D (inlet 3-2) are both 3.75, greater than the critical value F0.05(3,9) = 3.49, indicating that these two factors have a significant impact on the temperature stabilization time. The F-values for factor A (inlet 2-1) and factor B (inlet 2-2) are both 2.32, below the critical value, indicating that their impact is not statistically significant. The order of influence of the factors, C = D > A = B, obtained from the range analysis is further confirmed by the F-values in the ANOVA, where the F-values for factors C and D (3.75) are substantially higher than those for factors A and B (2.32). For the dominant factors C and D, level 2 (−15 m), which minimizes the stabilization time, was selected. For the non-significant factors A and B, since they participated in the optimal combination (Group 6 experiment) at level 2 (15 m), this level was retained.
Conclusion
Based on fluid-thermal coupling numerical simulation, orthogonal experiments, range analysis, and variance analysis, this study conducted a systematic optimization design of the ventilation layout for a high-precision welding chamber, yielding the following main conclusions:
Optimization of the number of air inlets: Increasing the number of air inlets effectively reduced the thermal equilibrium time. The 6-inlet scheme achieved an optimal balance between temperature control efficiency (equilibrium time of 320 s) and economic performance (lowest equipment cost), reducing the stabilization time by 47% compared to the 4-inlet scheme. The marginal efficiency gains from the 8-inlet and 10-inlet schemes (20–40 s) were minimal, with an efficiency improvement per unit cost of only 7.14%.
Optimization of air inlet layout symmetry: Optimizing the symmetry of the air inlet distribution effectively shortened the temperature stabilization time and improved heating efficiency. The fully symmetric layout (in both vertical and horizontal directions) demonstrated the best thermal regulation performance, reducing the stabilization time (320 s) by 13.3% compared to the asymmetric layouts.
Sensitivity of air inlet position parameters: In the symmetric 6-inlet layout, the positions of different inlets had varying degrees of influence on the temperature stabilization time. The positions of inlets C and D (with a combined influence weight of 56% from range analysis, and F-values of 3.75 exceeding the critical value of 3.49) had a significantly greater impact than inlets A and B (with a combined weight of 44%, and F-values of 2.32 below the critical value). The optimal position combination, determined through orthogonal experiments (Test No. 6: A = 15 m, B = 15 m, C = −15 m, D = −15 m), achieved the shortest stabilization time of 307 s.
The optimized ventilation layout scheme proposed in this study—featuring six uniformly and symmetrically distributed air inlets with specific position parameters—can effectively enhance the temperature control efficiency of the welding chamber. This scheme provides a reliable guarantee for high-precision welding processes and offers a methodological reference for the thermal environment optimization of similar enclosed spaces.
Footnotes
Handling Editor: Chenhui Liang
Funding
The authors disclosed receipt of the following financial support for the research, authorship, and/or publication of this article: This project was sponsored by the National Natural Science Foundation of China (Grant No. 52275292), the Key Research and Development Program of Shaanxi Province (Grant No. 2025CY-YBXM-091), the Fundamental Research Funds for the Central Universities (Grant No. D5000230084).
Declaration of conflicting interests
The authors declared no potential conflicts of interest with respect to the research, authorship, and/or publication of this article.