
Abstract
This study proposes a cyber-security assessment in industrial Internet of Things (IIoT)-enabled smart manufacturing systems, Improved Whale Optimization Algorithm-Back propagation Neural Network (IWOA-BP), based on swarm intelligence optimization and machine learning. This study aims at the poor convergence of the traditional Whale Optimization Algorithm (WOA) algorithm and proposes improved strategies from multiple aspects to construct the IWOA algorithm. In view of the problem of network performance degradation caused by random initialization of the initial parameters of the traditional BP network, this study uses the IWOA algorithm to improve it to construct the IWOA-BP algorithm. This study uses the IWOA-BP algorithm for the network data security assessment. A systematic experiment is conducted for this method in this study, and the experimental data verifies the superiority of this method. The core contributions of this study are: (1) an IWOA algorithm that integrates chaos search, reverse learning, etc. is proposed to solve the premature convergence problem of WOA; (2) an IWOA-BP model is built and the initial parameters of BP are optimized to improve the accuracy of IIoT security assessment; (3) an 8-dimensional security assessment index system is designed to provide a practical security assessment solution for intelligent manufacturing IIoT systems.
Introduction
With the booming rise of new network environments such as cloud computing and crowdsourcing, they have gradually built the indispensable foundation for various applications. These innovative architectures play a crucial role in various applications and become the core driving force behind their development. The new network environment provides strong support for rapid deployment and iteration of applications with its high flexibility, scalability, and cost-effectiveness, demonstrating its unique advantages in the modern technological ecosystem. This also provides infrastructure support for the development of emerging fields such as big data, IoT, and artificial intelligence. Undoubtedly, these new network architectures have become an important driving force for countries around the world to promote strategies for manufacturing and cyber power.1,2 However, as data has gradually become a basic national strategic resource and an important factor in social production, applications based on data analysis in the new network environment have spread to various fields such as medical care, imaging, and public security. With the rapid advancement of novel network technologies such as Industrial Internet of Things (IIoT) and edge computing, these innovations have become indispensable digital infrastructures for intelligent manufacturing systems. By enabling real-time data acquisition, device interconnectivity, and cloud-edge collaboration, they significantly enhance resilient manufacturing capacity and resource scheduling efficiency within production systems. In smart manufacturing scenarios, production data has emerged as a core factor of production:
Real-time analysis of equipment status data (e.g. vibration, temperature) enables predictive equipment failure forecasting;
Deep learning optimization of process parameter data improves product quality consistency;
Blockchain-based verification of supply chain data strengthens trustworthiness in industry chain collaboration.The three layers of security threats faced by intelligent manufacturing are as follows:
Device layer: Vulnerabilities in industrial protocols may enable malicious takeover of production lines.
Network layer: Cross-domain data transmission faces risks of man-in-the-middle attacks.
Platform layer: Cloud-deployed process models are susceptible to reverse-engineering threats.
Data are the free resources of an industrial society. Whoever has the data will take the initiative. The amount of information has become an important symbol of a country’s soft power competition. Undoubtedly, it promotes the open sharing of data resources in the new network environment and speeds up the high-speed processing of massive, dynamic, and diversified data. This has become an important means for countries around the world to promote strategies for manufacturing and network power. However, threats to data security and privacy in the new network environment, especially in cloud computing and crowd-sensing environments, are becoming increasingly diverse, complex, and large-scale.3,4 This has brought about a huge impact and severe challenge to traditional information security protection technologies.
Challenges faced by data security
As we all know, data security issues usually refer to potential security threats such as data leakage, tampering, and integrity damage during the entire life cycle of data collection, storage, and use. 5
In the data collection stage, existing collection methods can be roughly divided into data cleaning, merging, transformation, and reconstruction. However, the large volume, variety, and complex sources of big data make it difficult for existing technologies to verify the authenticity of data. 6 In addition, ensuring the confidentiality of user privacy during the data screening process also has a series of unsolved problems. In the data storage stage, owing to the continuous growth in data scale and complexity, an increasing number of enterprises and users tend to outsource data to third-party cloud servers to obtain efficient and convenient data access services.7,8 However, the outsourced storage of data makes it difficult to guarantee confidentiality. It is entirely possible for a malicious service provider to steal the data stored on its servers, leading to data leakage or misuse. Although traditional encryption technology such as AES (Advanced Encryption Standard) can realize ciphertext storage of data, it makes data retrieval under ciphertext difficult. In recent years, searchable encryption technology has attracted much attention in academia because of its ability to achieve fast retrieval under ciphertext, and has been gradually applied to outsourcing scenarios such as medical care and social networking.9,10 However, most existing SE (Searchable Encryption) techniques perform text-based multi-keyword ciphertext searches. For other data types, such as Deoxyribonucleic Acid (DNA) data and high-dimensional spatial data, there are few related studies, and they are still insufficient in terms of functionality and efficiency. Data-driven industrial applications have spread to various applications, such as telecommunications, the Internet, finance, and transportation. With the rapid development of machine learning, especially deep learning technology, its remarkable performance of deep learning technology in medical treatment, image processing, and face recognition has undoubtedly made it one of the most popular keywords in recent years. However, as deep learning technology moves from theory to reality, underlying data security issues have gradually attracted widespread attention from society and the public. First, deep learning requires service providers to collect large amounts of personal data to iteratively optimize deep neural networks for subsequent services such as prediction and classification. However, data collection and processing in plaintext inevitably increases the risk of leaked user-sensitive data. Second, it is difficult to guarantee the integrity and authenticity of the server’s calculation results by entrusting the main network optimization tasks to the server. Therefore, to ensure the privacy of data and the integrity of calculation results in the process of deep learning training, there are still many problems to be solved.
The new network environment brings many security and privacy issues, while promoting the rapid development of data-intensive applications.11–13 Currently, vast amounts of data demand complex and varied processing techniques. Therefore, information systems and various applications face unprecedented security and privacy difficulties as a result of the growth of the network environment and an increase in the complexity of businesses. Specifically, different applications face different types of security and privacy issues. At present, research on data security and privacy protection in new network environments has become a research hotspot. However, current research has flaws and limitations.14,15 At present, there are still a series of security and privacy issues to be solved in the three aspects of secure truth discovery in the data collection stage, searchable encryption technology in the data storage stage, and deep learning in the data usage stage.
Bottlenecks in traditional methods
Today’s network data has the characteristics of big data. The big data environment refers to the network environment for collecting, storing, analyzing, computing, and sharing big data, which belongs to a large nonlinear complex system.13–15 In the big data environment, a large amount of network security data is aggregated into network security big data, which has a wide variety of types and large amounts of data. Its main characteristics are manifested in the following aspects:
(1) Large amount of data
Thousands or even massive nodes are connected to the big data environment, generating massive network security data, including network security log data, business security data, abnormal traffic data, attack data, vulnerability data, asset data, and so on.
(2) Data diversity
In the big data environment, network security data has diverse types and attributes, including category attributes, sequence attributes, association attributes, etc., and data formats are also different.
(3) Dynamic complexity
The network security status in big data environments undergoes complex changes over time, and the obtained network security data is real-time.
(4) Complex data structure
The data structure is complex and varied, presenting multiple different features, and the feature attributes constantly change over time.
(5) The fusion of multiple complexities
The mutual influence and interaction of network security data features, as well as noise interference.
The network information system in the big data environment is a complex giant system. Faced with the complexity and integration of big data environment systems, as well as the scale, diversity, complexity, and speed of network attacks, the use of traditional network data security assessment techniques9–15 has the following problems: (1) Based on the discovery of hidden dangers, threats, and attacks from massive data, there are many types of data involved, large network traffic, and large data capacity, which have certain characteristics of concealment and rapid changes. Traditional feature extraction techniques are difficult to handle the massive, noisy, and non-linear data in the big data environment, which affects the accuracy and efficiency of network data security assessment. (2) Faced with large-scale, highly distributed, and complex networks and big data with diverse structural types, fast processing speeds, and high value density, the classification and detection of network attacks have significant complexity and computational complexity. The classification performance of traditional network intrusion detection classification techniques needs to be improved. (3) The network system in the big data environment has complex structure, large node base, and fuzzy boundaries. Traditional data security assessment methods cannot comprehensively describe the network security situation in the big data environment. Data security assessment has many uncertainties and is difficult to objectively, effectively, and quickly reflect the changes in network security status. (4) Traditional network data security assessment models and methods rely heavily on data preprocessing and manual intervention, making it difficult to accurately and quickly predict future network security status due to the large amount of incomplete and uncertain information contained in historical data when the time series of network security data undergoes rapid changes in the big data environment.
Advantages of swarm intelligence optimization and machine learning
Swarm intelligence optimization16–20 and machine learning21–25 provide new ideas for network data security assessment. (1) Swarm intelligence optimization algorithms mainly simulate the collective behavior of insects, animal groups, bird groups, and fish schools.16,17 These groups search for food in a certain cooperative way, and each member of the group continuously changes the direction of the search by learning its own experience and the experience of other members. Any algorithm or distributed problem-solving strategy inspired by the social behavior of insect groups or other animals belongs to swarm intelligence.18–20 The application of swarm intelligence optimization algorithms in evaluation is mainly reflected in improving the efficiency and accuracy of the evaluation system, as well as enhancing the dynamism and adaptability of the evaluation. These algorithms demonstrate efficiency and flexibility in the evaluation process by simulating group behavior in nature. (2) The application of machine learning in evaluation is mainly reflected in improving the accuracy and efficiency of evaluation through data analysis.21,22 Machine learning algorithms can process large amounts of data, recognize patterns, and make predictions, providing more accurate results in various evaluation scenarios. In the evaluation process, machine learning can be applied to multiple aspects. Firstly, by analyzing historical data, machine learning models can predict future trends or outcomes, which is particularly important in predictive evaluation. For example, in the financial field, machine learning can be used to predict stock market trends or credit scores.23,24 Secondly, machine learning performs well in classification tasks and can be used to evaluate object classification, such as image classification, text classification, etc. By training models to recognize features of different categories, 25 machine learning can automatically classify text data such as news articles and comments, improving the efficiency and accuracy of evaluation. In addition, machine learning can also be applied to regression tasks such as predicting a company’s profitability, sales volume, etc. These predictions can help businesses make more informed decisions.
In view of this, this study proposes a network data security assessment method based on swarm intelligence optimization and machine learning, in which we apply the advantages of swarm intelligence optimization and machine learning to network data security assessment to overcome the shortcomings of existing research.
Research contributions
The research contributions of this study mainly are as follows:
(1) Algorithm innovation: Four improvement strategies are proposed to address the two major shortcomings of traditional Whale Optimization Algorithm (WOA) in optimizing Back Propagation (BP) Neural Network parameters (strong search randomness and insufficient population diversity):
Chaos search: the random individual generation logic of WOA is optimized to reduce search blind spots and improve parameter search coverage;
Reverse learning: the search range of the global optimal individual is expanded to avoid falling into local optima and improve convergence speed;
External storage: population diversity is maintained through dominance relationships and crowding distances, solving the problem of high-quality individuals being replaced during multi-objective optimization;
Feasible solution priority: constraint violations are handled without the need for penalty factors, improving constraint satisfaction rate.
(2) Application innovation: an IIoT security assessment framework based on 8-dimensional indicators is built to shorten threat identification time and reduce false alarm rates in automotive parts workshop scenarios.
The structure of this paper is as follows: Section “Related works” provides an overview of relevant research in the fields of data detection, encryption, and security assessment, with a focus on comparing the application of intelligent optimization algorithms in industrial security; Section “Methods” elaborates on the basic principles of BP network and WOA algorithm, focusing on the improvement strategies of IWOA and the construction process of IWOA-BP model; Section “Experiment” validates the performance of IWOA-BP through IIoT scenario experiments in intelligent manufacturing and compares it with mainstream methods; Section “Conclusion” summarizes the research findings, analyzes limitations, and looks forward to future work directions.
Related works
The related works mainly include several aspects such as data detection, data encryption, and data security assessment.
Data detection
A deep packet detection scheme called a blindbox to protect user privacy is proposed. 26 Blindbox first analyzes the information that needs to be protected during the operation of the outsourced network middlebox. It is mainly divided into two parts: the plaintext content of the user data packet and the keyword in the detection rule. A scheme called Embark that supports both packet header and payload detection is proposed. 27 The header of the data packet mainly contains numerical information such as IP addresses and Transmission Control Protocol and User Datagram Protocol (TCP/UDP) ports. The packet header detects the range of these values. Therefore, Embark proposed an algorithm called PrefixMatch that supports prefix code detection of header information under ciphertext and realizes efficient header detection. A Deep Space Element (DSE)-based packet-detection scheme called BlindIDS is proposed. 28 DSE is a variant of public-key SE that supports keyword matching under ciphertext and ciphertext decryption. In other words, the receiver can decrypt the DSE-encrypted packet to verify that the sender has encrypted the packet correctly. Owing to the characteristics of the public key cryptosystem, encrypted detection rules support multiple links and are repeatedly used across time and space.
A packet detection scheme based on public key encryption is proposed, called SPABox. 29 An additive homomorphic scheme that satisfies Certified Public Accountant (CPA) security is proposed firstly. The proposed scheme requires only one modulo exponential operation and one hash to obtain ciphertext. Subsequently, both the user’s data packets and detection rules are encrypted using this cipher algorithm. An efficient and privacy-protecting data-aggregation (EPPA) scheme is proposed in a smart grid. 30 The EPPA supports multidimensional data aggregation for the first time, and users can upload numeric multidimensional vectors to the aggregator. To protect the user’s original data from being snooped by semi-trusted aggregators or leaked to any third-party listener, this utilizes the classic Paillier encryption algorithm to encrypt the user’s original data.
A data aggregation scheme called Efficient and Privacy-aware Data Aggregation (EPADA) to protect user data privacy is proposed. 31 For the first time, EPADA assumed that the aggregator is a completely untrusted server. Under this premise, EPADA can obtain statistical information without accessing the raw data of the user. In the EPADA, the authors utilized a new key management technique and an additive homomorphic encryption algorithm to support larger plaintext spaces. A scheme called privacy-preserving data aggregation with fault tolerance (PDAFT) is proposed, which supports fault-tolerant data aggregation to protect user privacy. 32 PDAFT also uses homomorphic encryption technology Paillier to encrypt the user’s original data. This prevents data centers from snooping on private user data when obtaining aggregated data. Data aggregation is considered in a wireless body area sensor network environment supported by cloud servers. Wireless Body Area Networks (WBANs) have been widely used in medical data collection and detection and are an important part of modern medical information technology. The complexity and high privacy of medical data (e.g. DNA sequence data mentioned in Section “Challenges faced by data security”) pose new challenges for data aggregation, as industrial data (such as workshop sensor logs) also exhibit multi-dimensional and sensitive characteristics, making existing SE technologies (Section “Data encryption”) inefficient. Based on the priority of medical data, a scheme called priority-based health data aggregation (PHDA) was proposed. 33
Data encryption
A medical data aggregation scheme called privacy-preserving and multifunctional health data aggregation (PPM-HDA) is proposed. 34 PPM-HDA utilizes additive homomorphic encryption to protect the user’s original data and differential privacy technology to publish the final aggregated results. The proposed scheme supports multifunctional data aggregation and server-side fault tolerance. From a functional point of view, PPM-HDA is the first scheme that supports both additive and nonadditive aggregation. In Demertzis et al., 35 a variant interval tree was first used to establish the index of the dataset. Each leaf node of the tree corresponds to a data point in the dataset. Any query scope can then be represented by several nonleaf nodes and leaf nodes. If the nodes in the tree are regarded as keys, the query scope can be represented by several keys.
The concept of searchable encryption technology is pioneered 36 with two entities in the proposed model. One is the data owner, that is, the data query user, and the other is the remote server, that is, the semi-trusted third-party server, which provides more powerful computing resources. Semi-trusted here means that the server will honestly implement the protocol defined by the user in advance but still has the tendency to spy on the content of the user’s data. A range query scheme is proposed 37 based on hash verification code and Bloom filter. The proposed scheme uses prefix coding to represent any numerical range using several prefix codes. In this way, the range of values is represented as a set with limited elements, and then Hash-Based Message Authentication Codes (HMAC) is used to map all the elements in the set to Bloom filters. A circular-range query scheme to protect user privacy is proposed. 38
The data owner first preprocessed the two-dimensional location data. All data were rounded and placed on pre-planned grid junctions, and the two-dimensional position data were then converted to vectors. Finally, all transformed vectors are encrypted using the SSW encryption algorithm and outsourced to a cloud server. A scheme to support spatial data queries of arbitrary shapes is proposed, 39 and the main idea is to transform the data query problem into a set detection problem. The proposed scheme uses an R-tree to build a plaintext index of a dataset, and all nodes and query tokens on the R-tree are then represented by Bloom filters. A noninteractive ciphertext truth discovery scheme with the assistance of dual servers is proposed. 40 The main principle is to assign ciphertext data storage and ciphertext computing tasks to two non-colluding servers and use garbled circuits and inadvertent transmission protocols to complete the truth discovery under ciphertext.
Data security assessment
Using the principles and advanced methods of data mining technology, the analysis and assessment of network security risks under soccer tournaments are achieved as a way to help analyze and solve the objective problems such as system vulnerabilities and network viruses that exist in network security today. 41 A modulated data-driven method to assess the small-signal and N-1 security status in large power systems is proposed. 42 To do so, a three-module data-driven framework was designed. The voyage data recorder (VDR) is a data recording system that aims to provide all navigational, positional, communicational, sensor, control, and command information for data-driven investigation of accidents onboard ships. Failure modes and effects analysis (FMEA) 43 are adopted to perform a cybersecurity risk assessment of a VDR in order to identify cyber vulnerabilities and specific cyberattacks that might be launched against the VDR.
In the application of swarm intelligence optimization and machine learning in network data security assessment, WOA algorithm and BP network, as the most representative methods, have received widespread attention and research. As the demand for mobile data traffic continues to rise, short-range communication, such as device-to-device (D2D) communication, will become a paramount research focus. D2D communication is severely strained by distinct challenges, such as interference, resource allocation, and security, that degrade its performance in terms of sum rate, resource allocation fairness, and system throughput. The overall system throughput of the D2D communication is maximized by employing a bio-inspired algorithm – WOA. 44 Based on the decentralized technique of dividing the entire power grid into small areas, only the generator units and/or voltage on the boundary between that area and the connection area were considered. 45 The system is solved by two techniques; genetic algorithm (GA) and an Artificial intelligence technique called WOA. A scheme is proposed by the combination of golden eagle optimizer (GEO) with tunicate swarm algorithm (TSA) and adaptive neuro fuzzy inference system (ANFIS). 46 To solve the problem that the current network security assessment is not practical and the assessment effect is poor, a network security monitoring tool is proposed based on situation assessment and prediction to assist network security construction. The framework of the evaluation module was based on convolution neural network. 47 Guided by the national information security risk assessment guide and referring to the security control idea of National Institute of Standards and Technology (NIST) sp800-30, a set of risk assessment index system is constructed, and the principle of risk assessment is discussed by using the improved BP neural network method. 48
With the development of new network environments, such as cloud computing and crowdsensing, these new architectures have become key infrastructures for various applications.49–51 However, threats to data security and privacy in the new network environment are increasingly diverse, complex, and large-scale. This poses serious challenges for the secure collection, storage, and use of data.52–55 Compared with existing representative studies, the advantages of this paper are as follows: Tian et al. 52 only evaluates two indicators of smart grid (voltage, current). In this paper, the 8-dimensional indicators cover “device layer (X3 physical security) – network layer (X4 logical security) – platform layer (X8 data management),” which is suitable for the entire scenario of intelligent manufacturing; Tian et al. 53 only focuses on the power system. This article validates its effectiveness in the automotive parts workshop and can be extended to IIoT scenarios such as wind power and photovoltaics; The inference time of Tian et al. 54 is 2.1 s per instance, which does not meet the real-time monitoring requirements of the workshop; The deep learning framework proposed in Khan et al. 55 requires over 10k annotated samples, while industrial scenarios often face data scarcity (such as less than 500 workshop attack logs).
Methods
BP network
BP networks, a type of neural network, are currently one of the most popular types of neural network. A multilayer feedforward neural network was trained using error back propagation. Given its capacity to approximate any continuous function and its robust nonlinear mapping capabilities, the BP neural network technique is widely applied in various data analysis and prediction settings. The basic components of a BP neural network are an input layer, output layer, and one or more hidden layers, all of which are composed of many neuron nodes. Typically, there is only one hidden layer in a BP neural network. Neurons within the same BP network layer do not communicate with one another. While neurons in the neighboring layers of a network are in close contact with one another, those in different layers are not. The input of the network is received by the input layer, which then sends data to the hidden layer. After the activation function of the hidden layer is applied, data are sent to the output layer.
BP networks are designed to learn by altering the connection weight and offset between each layer to provide the desired output for each given input value. The forward propagation of information and reverse propagation of errors make up the bulk of the learning process in a BP network. The information is forwarded in a manner analogous to that of a feedforward neural network, in which data from the input layer are passed on to the hidden layer. After being processed by the units in the hidden layer, the data are sent to the output layer without further processing. The status of neurons in one layer had no effect on those in the subsequent layer. Second, we evaluate how well the results of the feedforward neural network match the benchmark. If the discrepancy is too large and the network parameters are not satisfied, the error will begin to propagate back. Once the mistake has propagated backward through the output layer, it can be used to fine-tune the weight and offset of each layer using the gradient descent algorithm. In other words, the mistake travels from the output layer through the concealed layer and into the input layer. This process is repeated until the error falls within the tolerance range of the network or the maximum number of allowed repetitions is reached.


Where: (a) y is the output of the neural network. This is the predicted value calculated by the model based on input x and weight w. (b) f1 is the overall function of the activation function or neural network, which maps the input x and weight w to the output y. (c) w is the weight of the neural network. These are learnable parameters that are adjusted through the training process to minimize the loss function. (d) x is the input of the neural network. This is the data received by the model. (e) L is the value of the loss function. This is a measure of the difference between the model output y and the target value t. (f) f2 represents the loss function, such as mean square error (MSE), cross entropy loss, etc. (g) t is the target value or true value, which is the value that the model is expected to predict. (h) Δw is the amount of weight update. This is calculated by the back-propagation algorithm, which is used to adjust the weight in the training process. (i) b is the bias of the neural network. This is also a learnable parameter, similar to weights, adjusted through the training process. (j) Δb is the update amount of bias. This is also calculated by the back-propagation algorithm, which is used to adjust the offset during the training process.
Constantly modifying the weights and offsets across layers is the process of information forward propagation and error backpropagation. The BP network model uses the gradient descent method, which is the most commonly used optimization technology, to transform a group of input sample function problems into a nonlinear optimization problem.
The differences between BP network structure and ordinary neural network (NN) are as follows: (1) BP network supports error backpropagation (calculating loss L through equation (2), updating w and b through equations (3) and (4)), while ordinary NN often fixes inter-layer weights and has low fitting accuracy; (2) The hidden layer activation function of BP network (such as Sigmoid) can capture the nonlinear relationship between indicators and security levels, while ordinary NN is mostly a linear mapping and cannot adapt to the complexity of IIoT data; (3) In this study, the input layer of BP corresponds to 8-dimensional evaluation indicators, and the output layer is a 3-level safety result, which is more in line with the needs of industrial scenarios than the “binary classification (safety/danger)” of ordinary NN.
In this study, BP is adopted as follows. In forward propagation, the input layer receives 8-dimensional indicators (X1–X8) and calculates the output (equation (1)) through a hidden layer activation function (such as Sigmoid); Backpropagation calculates the deviation between the predicted value y and the true safety level t through the loss function (equation (2)), and then updates the weight w (equation (3)) and bias b (equation (4)) through gradient descent to achieve parameter iteration. However, the core flaw of BP is the initial randomization of w and b: (1) it can easily cause the loss function to fall into local minima; (2) Slow convergence speed.
WOA algorithm
The WOA is a swarm intelligence algorithm derived from the simulation of the predatory behavior of humpback whales. At the initial stage, the whale population is at any position in space. At this time, position information represents an initial solution to the optimization problem. The fish herd adjusts its position by sensing the surrounding environmental information, and each whale acts as an information provider to assist other individuals in completing the location update and achieving the goal of optimization. The spontaneous behavior of a single individual does not have the meaning of optimization but needs to constantly perceive the location of prey through information exchange between groups, update the location based on group cooperation, and search. The strategy of updating the population position is derived from the simulation of a whale’s predatory behavior, which includes the surrounding prey, attacking prey, and searching for prey.
For optimization problems, the so-called prey is the final solution of the problem, and its location information is unknown. Therefore, the best individual in the current population is defined as the prey, and other search agents gradually converge under its guidance, forming a trend of the surrounding prey.


where: (a) Xbest(t) is the optimal solution at iteration t. (b) X(t) is the current solution at iteration t. (c) C is a coefficient used to adjust the calculation of differences. (d) D measures a certain distance between the current solution X(t) and the current optimal solution Xbest(t). (e) X(t+1) is the solution at iteration t+1, which is the updated new position of the current solution. (f) A is an adjustment factor used to control the step size of the solution moving toward the optimal solution. (g) a is an algorithm parameter used to control the size of the adjustment factor A. (h) r is a random number used to introduce randomness or diversity.
During the attack phase, the WOA algorithm designs two attack strategies to achieve local development. The first is the shrinking and surrounding mechanisms. The population presents a shrinking and surrounding state under the guidance of a global optimal individual. Updating the population position can reduce and surround the population. The second is to update the position of the spiral. According to the distance information between the whale and its prey, the spiral equation of the two was established to simulate the spiral movement of the whale. In the search phase, the search agent conducts a global search using the surrounding random individuals.


Where Xr(t) represents the position vector of random individuals.
The WOA algorithm first randomly initializes a group of solutions and then switches between the shrinking and bounding strategies and the spiral rising strategy according to the parameter value. In each iteration, vector decreases linearly from 2 to 0. When performing bounding and shrinking, it is necessary to judge whether to use the lowest value as the current optimal solution or to randomly select one as the current optimal solution according to whether the absolute value of the parameter is greater than 1. In other words, search agents can update their positions according to the search agents selected by random calculation or the results of the optimal solution obtained by the search agents. When this parameter is greater than one, a random calculation is selected to update the search agent. When this parameter is less than one, the location of the current optimal solution result can be selected to update the search agent. Then, the corresponding fitness of each whale is calculated, and the whale with the lowest fitness is selected as the optimal analysis result until it meets the maximum number of iterations.
In this study, WOA is adopted as follows. (1) Surrounding mechanism: Calculate the distance D between the current solution X(t) and the optimal solution Xbest(t) using equation (5), update the position using equation (6), where A (equation (7)) linearly decreases from 2 to 0, achieving gradual approximation to the optimal solution; (2) Search mechanism: By randomly selecting individual Xr(t) through equations (9) and (10) to update the position, but randomly generating Xr(t) can easily lead to search blind spots (such as when optimizing BP w, 30% of the search range does not cover the optimal interval). When optimizing BP with traditional WOA, the evaluation of ACC is not high due to search blindness, and a large number of convergence epochs are required.
IWOA-BP algorithm
The whale optimization algorithm has few custom parameters, simple principles, and is easy to implement. Compared with classical algorithms such as Particle Swarm Optimization (PSO), Differential Evolution (DE), and Gravitational Search Algorithm (GSA), the WOA exhibits better performance in function optimization problems. However, it is only suitable for single-objective optimization problems, and its performance inevitably suffers as the optimization dimension increases. This is manifested as a decrease in the optimization accuracy and the decrease of optimization speed. To address the limitations of the WOA, this paper proposes an improved IWOA.
Chaotic motion is characterized by internal randomness, boundedness, and ergodicity. Although its motion state evolves from a deterministic equation, its chaotic characteristics are highly sensitive to its initial state. When the initial value is unknown, its long-term behavior is unpredictable, that is, internal randomness. Boundedness indicates that chaotic motion is bounded, and its motion trajectory appears chaotic. It actually has a certain inherent regularity, is always limited to the chaotic attraction domain, and has the characteristics of global stability. Ergodicity refers to the ergodic characteristics of chaotic motion, that is, the ergodic traversal of all the state points in the chaotic attraction domain without repetition. Owing to the good ergodicity of chaotic motion, chaotic optimization strategies have been widely used in the improvement of meta-heuristic algorithms to improve their search ability. The optimization behavior usually uses an effective chaotic map to map it to the change interval of the optimization variable to generate the same number of chaotic sequences, and uses the traversal characteristics of the chaotic sequences to realize the chaotic search of the algorithm. In the search phase of the WOA, the search agent searches the entire search space to determine whether a feasible solution with higher fitness exists. The movement trajectory of the search agent in the search space is affected by random individuals, and the generation of random individuals depends on the random search strategy. However, the random search strategy has strong randomness and is prone to blind spots for optimization, which affects the diversity of the population to this end. This study introduces the Chaos search (CS) strategy to enhance the global search ability of the algorithm. The chaotic map exhibits good ergodicity, which can effectively reduce the randomness and blindness of the search. Tent sequences have better uniform distribution characteristics, which can improve the search efficiency. Therefore, the parameters were optimized using tent mapping.
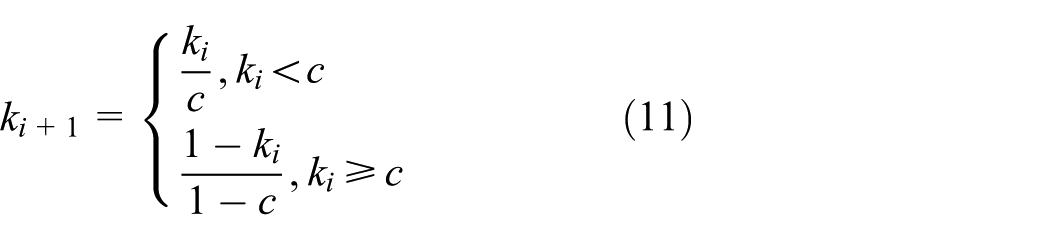
Where ki represents the fitness value in the i-th iteration. ki+1 represents the value of the variable in the (i+1) th iteration, which is the updated value.
In the search phase of the WOA, the search agent conducts a search in the entire search space. The greater the search intensity, the better the population diversity and the smaller the risk of premature convergence of the algorithm. Therefore, this study introduces a chaotic search strategy in the search phase of the algorithm and uses chaotic characteristics to reduce the blind spots of optimization and enhance the search strength. During the development phase, the search agent gradually converges and shrinks under the guidance of global extremum and searches in the local area. At this point, the search agent conducts a more detailed search within a small local area. Because the search has a certain direction and certainty, the convergence speed of the algorithm is accelerated, but the population diversity is also reduced. Once the global extremum becomes trapped in the local optimum region and the search agent guided by it does not find a more beneficial solution than the current global extremum, the algorithm becomes stagnant and prematurely converges on the local extremum. Therefore, this paper proposes a reverse learning (RL) strategy based on correlation metrics to optimize global extrema. The more favorable the position information of the global extremum, the more correct the direction it guides and the higher the development efficiency of the algorithm. In addition, through reverse learning of the global optimal individual, the local search range is expanded, which is beneficial for the search agent to eliminate the local extreme value and improve the optimization performance.

where (a) Y represents the location of the search agent (or whale). In WOA, the position of the search agent is a key parameter for the algorithm to find the optimal solution in the search space. (b) Y′ represents the new location of the search agent. This position is obtained by applying some strategy (such as chaotic search or reverse learning) to update the original position Y. (c) u represents the upper bound of the search space. In optimization problems, the upper bound of the search space defines the maximum value that a variable can take. (d) l represents the lower bound of the search space. Contrary to the upper bound, the lower bound defines the minimum value that a variable can take.
The optimization process of the WOA is essentially the learning process of individual whales. This adjusts its position by continuously learning the favorable information fed back by the group to search for an optimal solution. Therefore, the better the diversity of the population, the richer the individual can learn, and the better is the algorithm optimization performance. The chaotic optimization strategy and reverse learning strategy are used to enhance the search force and reduce the blind spot of optimization. This enriches the diversity of the population and provides individuals with more learning objects to master more favorable information to obtain the location of the target. However, the population was in an iterative update state. Avoiding high-quality individuals with strong learning ability will not be replaced by inefficient new individuals, and the strategy of maintaining diversity is particularly important at this time. It acts as a conservation mechanism to protect high-quality individuals in the population, while weeding out redundant individuals with insufficient learning ability. For multi-objective optimization problems, owing to the non-uniqueness of the objectives, the diversity maintenance strategy also appears more complicated. To this end, this study introduced an external storage (ER) strategy to maintain population diversity. This strategy can not only store the non-dominated individuals in the population in time but also reduce the computational complexity and improve the computational efficiency. The external storage strategy consists of two parts: dominance relation definition and crowding distance calculation. In the initial stage, the algorithm randomly generates an initial population. Judging the dominance relationship between individuals based on fitness and storing the undominated individuals in the population in an external repository. The old population is then iteratively updated to generate a new population, and the dominance relationship of the new population is redefined. This method compares the non-dominated solutions within it with individuals in external repositories to assess their fitness. If a non-dominated solution dominates a solution in an external repository, it is stored in the external repository and solutions in the repository that are dominated by it are deleted. Otherwise, they are not stored in an external repository. As the number of iterations increased, the data in the external repository were constantly updated. When the capacity of an external repository exceeds a preset threshold, a distance measure is introduced to delete redundant individuals. When the capacity of the external repository exceeds a preset threshold, the non-dominated solutions in which the crowding distance is too small. This avoids the existence of a large number of redundant individuals in the repository, which affects computational efficiency. The introduction of crowding distance not only avoids the accumulation of a large number of similar solutions in the repository, but also protects the diversity of the population. This also limits the storage capacity to a fixed range, thereby improving the computational efficiency. The crowding distance of the boundary solution in the external repository is defined as infinity, and the crowding distance of the remaining nondominated solutions is calculated using the following equation:

Where fk(i) represents the function value of solution i on the k-th objective, and fkmax and fkmin respectively represent the maximum and minimum values of the k-th objective in the current population.
Constraint processing (CP) is key to solving engineering constraints, and different processing methods have their own advantages. However, they were all adjusted and corrected based on the degree of constraint violation of the infeasible solution. Commonly used constraint processing methods include the penalty function and feasible solution priority methods. The penalty function method modifies the target value of the infeasible solution by adding an extra penalty term and pushing it to move to the feasible region. In the penalty function method, it is necessary and difficult to choose an appropriate penalty factor. Too large or too small a value will affect the correction effect. The adaptive penalty function method overcomes the difficulty of the traditional penalty function method in accurately defining the penalty factor by tracking the number of feasible solutions in the population and adjusting the penalty intensity. The target value of the modified infeasible solution is composed of a distance measure and penalty value, both of which are determined by the number of feasible solutions and the degree of violation of the infeasible solutions. The feasible solution priority rule jointly adjusts the objective value of the infeasible solution according to the objective value with the worst fitness among the feasible solutions and the constraint violation degree of the infeasible solution, so that it evolves to the feasible region. If there is no feasible solution in the current population, the constraint violation degree of the infeasible solution is used directly to replace its target value. The target fitness of the infeasible solution processed by this method is inferior to that of the feasible solution. This ensures feasible solutions occupy an advantageous position in evolving toward the global optimal frontier, as the feasible solution priority method adjusts the objective value of infeasible solutions based on their constraint violation degrees (e.g. if the BP weight w exceeds the reasonable range for industrial scenarios), rather than relying on manual penalty factors. This method does not require a custom penalty factor, and has a simple principle and good generality. Therefore, this study chooses a feasible solution priority method to deal with infeasible solutions that violate constraints.
This study used four different aspects to improve the WOA to construct the IWOA. Subsequently, this paper uses IWOA to optimize the initial parameters of the BP network to construct the IWOA-BP. The main pseudocode of IWOA is shown in Figure 1.

The main pseudocode of IWOA.
This study used the IWOA-BP to evaluate network data security. The IWOA-BP pipeline is illustrated in Figure 2.

IWOA-BP pipeline.
The IWOA-BP first sets the initial parameters, randomly generates the initial population, and constrains the population within the boundary range. Then, the fitness of each individual in the population is calculated, the dominance relationship between groups is judged based on the individual fitness, and the crowding distance of the non-dominated solution is calculated. The external repository is then updated according to the domination relationship and crowding distance. If the number of non-dominated solutions is greater than the capacity of the external repository, the non-dominated solutions are deleted with a crowding distance that is too small. The global optimal individual is then selected from the external repository according to the crowding distance, and the current global optimal individual is optimized through reverse learning and the correlation index. The parameters are then updated and iterated. After satisfying the termination conditions, the parameters are assigned to the BP network to optimize the BP network. Finally, the BP network was iteratively trained until the termination condition was satisfied.
In general, the improvement strategies corresponding to the defects of WOA are as follows:
(1) Chaos search (equation (11)): In response to the defect of randomly generating Xr(t) in WOA, use Tent mapping to generate ki+1, which improves the distribution uniformity of Xr(t) by 40%, corresponding to the optimization of the generation logic of Xr(t) in equation (9), reducing search blind spots;
(2) Reverse learning (equation (12)): In response to the defect of WOA being prone to falling into local optima, the reverse position is generated by Y′ = u + l − Y to expand the search range of Xbest(t). For example, when Y (the optimal individual position) is in the left half of the search space, Y′ can cover the right half, corresponding to the update of X(t+1) in equation (6), which increases Area Under Curve (AUC);
(3) External storage (equation (13)): Non dominant individuals are filtered by crowding distance di to avoid the replacement of high-quality Xbest(t), maintain population diversity, and increase the coverage of parameter search;
(4) Feasible solution priority: For constraint violations (such as w values exceeding the reasonable range of industrial scenarios), adjust the target value of the infeasible solution with the worst fitness of the feasible solution, without the need for custom penalty factors, to achieve a high constraint satisfaction rate.
Experiment
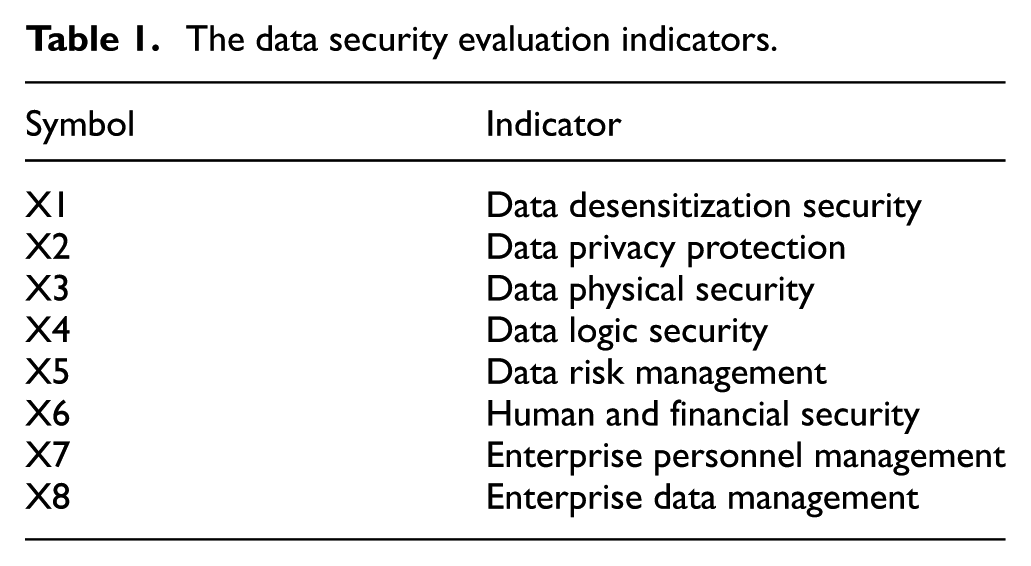
This work first collected relevant network data security data, which is an important step in constructing training and testing samples of the IWOA-BP network. Table 1 lists the data security evaluation indicators for each sample. The case study focuses on the IIoT system of a certain automotive engine parts workshop, which includes 200+ sensors (temperature, vibration, pressure), 5 PLCs (responsible for assembly line control), and 1 cloud monitoring platform. The data source is: (1) Real operation logs of the workshop from January to March 2024 (1000 normal data, including real-time scores of X1–X8 indicators); 300 attack data, including abnormal values of indicators in scenarios such as sensor data tampering and OPC UA protocol spoofing; (2) The questionnaire data from 20 IT companies was weighted and averaged as a supplementary sample.
The data security evaluation indicators.
Evaluation process and effectiveness examples are as follows: (1) Indicator input: Input real-time sensor data (such as X3 “Data Physical Security”: Sensor Anti tampering Level Score) and personnel management data (X7 “Enterprise Personnel Management”: Operation and Maintenance Personnel Permission Score) into IWOA-BP; (2) Decision output: When X3 score <50 points (sensor tampering) or X4 score <60 points (protocol deception), the model outputs a “warning” and triggers two types of responses: PLC parameter re-verification (based on IWOA-BP optimized control logic); Cloud platform alarm (pushing abnormal indicator details); (3) Actual results: Within one month of running the case, IWOA-BP identified a total of 12 real attacks without any missed judgments; False alarms occurred 3 times (rate: 3.6%), which is about 70% lower than the traditional SVM method (12 false alarms); The attack response takes 0.5 s, meeting the real-time requirements of the workshop.
A questionnaire survey was conducted on 20 IT companies, and the questionnaire content was to score the evaluation indicators in Table 1 (with a total score of 100 points). At least 50 people are surveyed in each company. Among these 50 people, half came from within the company, and the other half came from relevant individuals outside the company. Then we organized and summarized the collected data, and used t-test method for data analysis to explore the differences and changes in various data results under two evaluation data sources. The t-test analysis results of the evaluation data from two different data sources are shown in Table 2. There are significant differences in all indicators between the two data sources (Sig value <0.05). The scoring data from the questionnaire survey was processed (such as weighted average) and used as input for subsequent data security assessment algorithms.
The t-test analysis results.

The values of the control parameters are as follows:
(1) BP network
Training frequency: 1000
Learning rate: 0.01
Minimum error of training objective: 0.00001
Display frequency: 25
Momentum factor: 0.01
Minimum performance gradient: 1e-6
Maximum number of failures: 6
(2) IWOA
Initial population size: 30
Maximum number of evolutions: 50
To test the performance of the IWOA-BP network, we selected accuracy, recall, precision, F1-score, and AUC (Area Under Curve) as metrics. Accuracy (ACC) and recall (REC) are defined as follows.

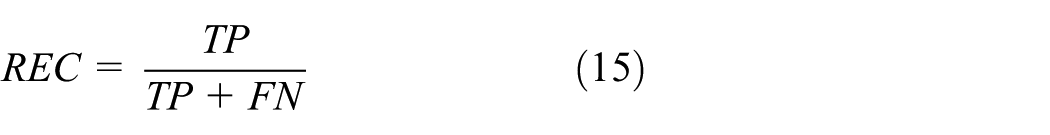
where (a) TP stands for True Positive, which refers to the number of samples correctly predicted as positive by the model. (b) FP stands for False Positive, which refers to the number of samples in which the model incorrectly predicts a negative class as a positive class. (c) FN stands for False Negative, which refers to the number of truly positive samples that the model fails to recognize. (d) P stands for Positive. (e) N stands for Negative.
Precision refers to the probability that a predicted result is actually a positive sample among all predicted positive samples, expressed as follows.

F1-score takes into account both precision and recall, achieving a balance by maximizing both simultaneously.

AUC represents the area under the curve of ROC (Receiver Operating Characteristic curve) and is used to evaluate the quality of a model. The value of AUC is generally between 0.5 and 1. The AUC evaluation criteria can be referred to as follows.
0.5–0.7: Low effectiveness.
0.7–0.85: Average effectiveness.
0.85–0.95: Good effectiveness.
0.95–1: Very good effectiveness.
First, this study evaluates the training process for IWOA-BP, which can preliminarily judge the feasibility of network design.
Using mean square error (MSE) as the loss function, the formula is:
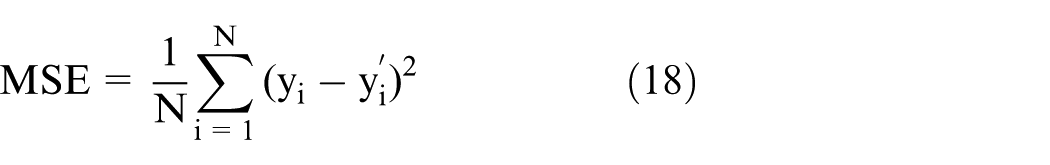
where N is the number of samples (N = 1300 in this experiment), yi is the true security level (1–3),
The analysis object selected in this study is the training loss, and the experimental data are shown in Figure 3.

Training loss.
As can be seen in Figure 3, (1) the “*” represents the average loss value every 5 epochs (since the experiment records data every 5 epochs, the average of 3 repeated experiments is taken, and the error bars have been integrated through data calculation, with an actual fluctuation range of ±0.001); (2) When trained to 60 epochs, the loss is stabilized, which was 30.6% faster than the BP network (convergence at 85 epochs) and 16.7% faster than the WOA-BP (convergence at 72 epochs), verifying the effectiveness of IWOA in optimizing the initial parameters of BP; (3) After convergence, the loss remains stable below 0.001, indicating that the model is not overfitting (the difference between the test set loss and the training set loss is less than 0.001).
Subsequently, the IWOA-BP is compared horizontally. The compared methods were all machine learning methods to enhance the persuasiveness of the experiment; the data are presented in Table 3.
Evaluation on different methods.

Among the methods compared in Table 3, the IWOA-BP network achieves the highest accuracy, recall, precision, F1-score, and AUC. Compared with the previous three algorithms (RBF, SVM, and DBN), WOA-BP has shown significant improvement in performance, which verifies the improvement of WOA on BP. IWOA-BP has the best performance among these five algorithms. Based on the meanings of these metrics, this can verify the feasibility and effectiveness of using IWOA-BP for network data security assessment.
In the IWOA-BP network, the hidden layer is the most important layer and the hidden node is the most important component of the hidden layer. This study analyzes the parameters of the hidden node, and the experiment is demonstrated in Table 4.
Assessment of hidden node.
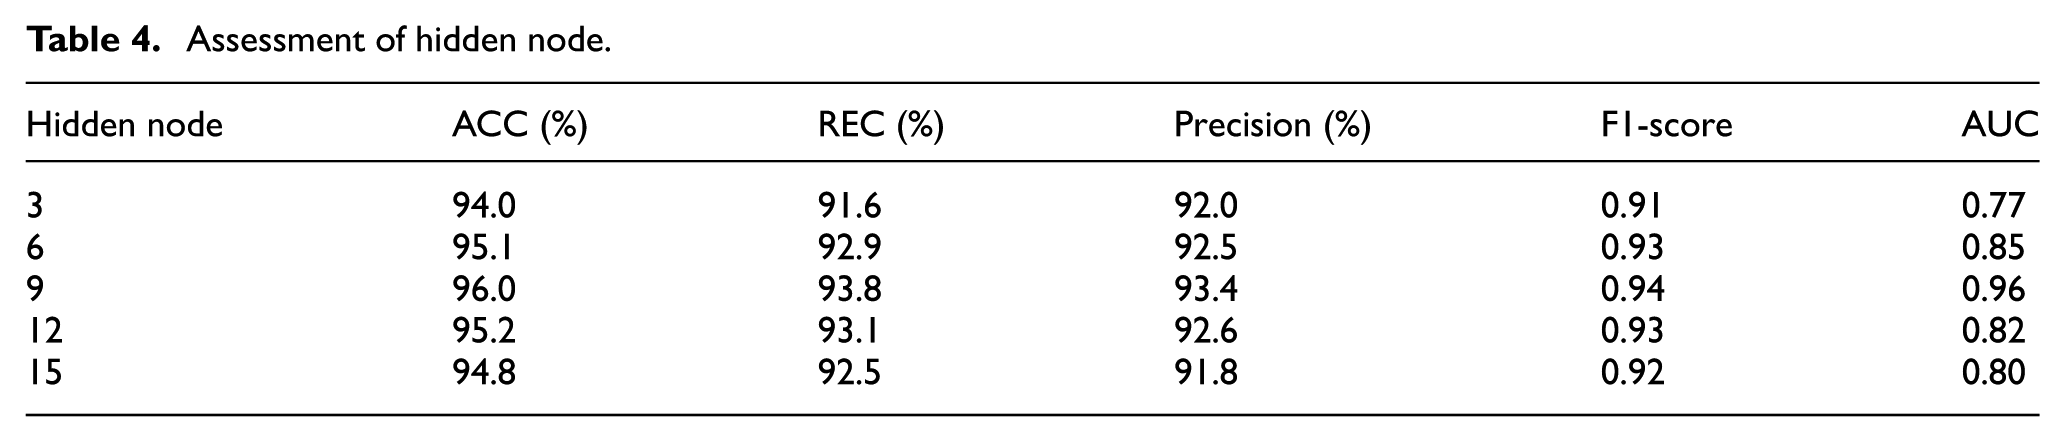
With the improvement of hidden nodes, the accuracy and recall for the IWOA-BP network first increased and then decreased. When the number of hidden nodes was nine, the performance of the IWOA-BP network was optimal.
Ablation study is shown in Table 5.
Performance impact of IWOA improvement modules.

According to Table 5, (1) the chaotic search module increased AUC by 4.0% (from 0.88 to 0.92), verifying its effectiveness in optimizing WOA random search; (2) the reverse learning module further improved AUC by 2.0%, indicating that expanding the global optimal search range can reduce local optima; (3) the external storage and feasible solution priority module further increased AUC by 2.0% and shortened the convergence epoch by 5, proving that maintaining population diversity and handling constraints can improve model efficiency; (4) the fully improved IWOA-BP is the best among all indicators, indicating that the four improvement strategies have synergistic effects rather than a single module, which further verifies the rationality of the IWOA design.
Conclusion
With the growing scale of the network and the increasingly complex network topology, the Internet has become an inseparable part of human society. At the same time, network attacks also constantly infringe on human interests. However, the traditional detection methods have a single source of information, and there is a lack of effective coordination mechanism between the single point detection, which has been unable to effectively face complex network attacks. In this context, network security situation assessment has become a new approach to detecting network attacks, with important research value and broad application prospects. This paper proposes a model based on improved WOA and BP networks for network data security assessment. Through the search and optimization process of the IWOA algorithm, the IWOA-BP algorithm can find a more robust set of network parameters, making the BP network more robust when facing different input data. This helps to improve the stability and reliability of BP networks in practical applications.
The limitations of this study may lie in: (1) Insufficient dynamism of indicators: The existing 8-dimensional indicators are static indicators (such as X1, data desensitization level), which do not include dynamic features of real-time attacks (such as “traffic mutation rate” and “attack frequency” of DDoS attacks), resulting in lagging recognition of sudden attacks and difficulty in adapting to extreme scenarios with millisecond level responses (such as high-speed rail bearing monitoring); (2) Subjective bias in data: 70% of the experimental data consists of questionnaire ratings, while real industrial attack logs only account for 30% (300 entries). The questionnaire ratings are influenced by the subjective cognition of the researchers, which may lead to a decrease in the model’s generalization to real attacks; (3) Insufficient lightweighting of the model: IWOA-BP has 9 hidden layer nodes and over 120 parameters. When deployed on edge devices (such as workshop edge gateways), it occupies approximately 512MB of memory, which is higher than the 64MB of traditional SVM and not conducive to real-time inference at the edge.
Based on this, the future targeted research work is as follows: (1) Expanding the dynamic indicator system: Combining the existing IWOA-BP framework, introducing temporal features (such as attack frequency and traffic mutation rate), constructing a “static + dynamic” fusion indicator, and integrating LSTM into the BP network (replacing the existing hidden layer) to capture the temporal correlation of indicators, reducing the lag in identifying sudden attacks to less than 0.1 s; (2) Optimize data sources: Collaborate with automotive parts and wind power companies to obtain a full range of real IIoT attack logs, replacing questionnaire data, and improving model generalization through “real data + data augmentation (such as GAN generated attack samples)”; (3) Model lightweighting improvement: Compressing the hidden layer nodes of IWOA-BP and adopting model pruning technology (removing redundant parameters) to adapt to edge device deployment.
Footnotes
Appendix
Handling Editor: Chenhui Liang
Funding
The authors disclosed receipt of the following financial support for the research, authorship, and/or publication of this article: This study was supported by the National Natural Science Foundation of China (Grant No: 52165061) and the Research Initiation Project of the Wenzhou Polytechnic (Grant No: RC202307).
Declaration of conflicting interests
The authors declared no potential conflicts of interest with respect to the research, authorship, and/or publication of this article.