
Abstract
To enhance the lifting performance of the air lift pump, this paper introduces a spiral air intake method. Using Fluent software and the VOF model along with the standard k-ε turbulence model, we analyzed the variations in liquid flow rate, lifting efficiency, and gas phase volume fraction of a spiral air-lift pump under different immersion ratios, air intake volumes, and air intake angles. The research findings indicate that: the increase in the immersion ratio enhances the volumetric flow rate and efficiency of the airlift pump. As the intake air volume increases, the volumetric flow rate and efficiency of the lifting liquid initially increase but then tend to decrease. The influence of the intake angle on the performance enhancement of the air-lift pump is similar to that of the intake volume, with the optimal angle being 10°. The analysis of gas phase volume fraction reveals that the aforementioned phenomenon is attributed to the alteration of flow patterns within the tube caused by changes in parameters. Notably, the air lift pump achieves optimal performance when the flow pattern within the tube assumes a slug flow configuration. The research findings facilitate the optimization of the air lift pump’s structure and operating parameters, ultimately enhancing its overall performance.
Introduction
Air lift pump injects compressed air into the suitable section of the lifting pipeline, leveraging the pressure differential between the interior and exterior of the pipeline to effectively convey liquids or slurries.1–7 In contrast to traditional jet pumps, air-lift pumps boast a range of remarkable advantages: including their lack of moving parts, simplicity in structure, safety and reliability, unrestricted operation regardless of water depth, minimal environmental impact, and straightforward control and operation. Moreover, this device can be used in explosive, radioactive, toxic, and corrosive liquids, Qiang et al. 8 carried out a pneumatic lifting test of manganese nodules at a water depth of 200 m, analyzed the pressure distribution and pulsation characteristics in the pipe, and established a pressure loss model. In 1975, the Ocean Mining Associates (OMA) successfully transported seabed minerals at a depth of 5500 m to surface mining vessels using pneumatic lifting technology, collecting a total of 550 t of ore nodules with a maximum production capacity of 50 t/h. 9 Ocean Mining Inc (OMI) of the United States has successfully collected 150 t nodules from 5200 m of seabed using pneumatic lifting technology. The feasibility of pneumatic lifting technology in deep-sea mining has been fully verified.
However, the efficiency of air-lift pumps remains relatively low compared to traditional vane pumps, serving as one of the primary bottlenecks that hinder their further expansion and widespread application. A significant amount of fruitful research has been conducted by numerous scholars to enhance the efficiency of air-lift pumps. 10 Reinemann et al. 11 establish a fluid dynamics theoretical model for small-diameter air lift pumps, analyze the relationship between their performance and key parameters such as gas flow rate, pipe diameter, and immersion rate, and provide theoretical basis for the design of small-scale air lift pumps. When the Reynolds number falls below 500 and the surface tension value ranges from 0.02 to 0.2, it is observed that the pneumatic lift pump demonstrates remarkable consistency in its performance, closely adhering to the anticipated pattern. Meng et al. 12 conducted further research on pressure-type and density wave-type oscillations within vertical channels, revealing that the stability of upward flow significantly surpasses that of horizontal flow. Enany et al. 13 conducted experimental research on the transportation of liquids using air lift pumps. The results indicate that, under identical intake air volume conditions, the airlift pump achieves its peak efficiency when operating at an immersion rate ranging from 0.65 to 0.7. Tang et al. 14 carried out an analysis of flow patterns within the lifting tube of an air lift pump. Experiments have demonstrated that the flow pattern within the riser undergoes periodic transitions in response to variations in gas flow rate, with the bubbly stirred flow phase exhibiting superior lifting performance for the system. Catrawedarma et al. 15 conducted an analysis of the pressure difference signal associated with the gas-liquid-solid three-phase flow structure within the riser, utilizing wavelet transform techniques. Therefore, the distribution of wavelet energy can be accurately determined. The experimental results demonstrate that wavelet analysis is capable of effectively discriminating the flow patterns within the riser. Scupi and Dinu 16 conducted numerical simulations on airlift pumps, the Eulerian multiphase model VOF method is utilized to accurately simulate the dynamic process of compressed air entering a submerged pipeline. Hanafizadeh et al.17,18 conducted their research utilizing the two-fluid Euler-Euler model as the foundation, numerical simulations were conducted to investigate the influence of varying submergence ratios and seven distinct angles (0°, 0.25°, 0.5°, 1°, 1.5°, 2°, and 3°) of the conical riser on the efficiency of the airlift pump. The simulation results reveal that, under identical intake flow conditions, an increment in the submergence ratio results in a corresponding elevation in maximum efficiency. Furthermore, enhancing the cone angle of the standpipe contributes to improving the efficiency of the pump. Pougatch and Salcudean19,20 employed the multi-fluid Euler method to conduct a comprehensive performance analysis of a gas-lift system involving gas-water-solid three-phase flow. The solutions they offer are highly reliable across a considerable range of particle sizes, densities, flow rates, pipelines, injection depths, and inlet volume fractions. The system’s efficiency is demonstrated to increase with the enlargement of pipe diameter, primarily attributed to the decrease in pipe wall friction. Hekmat et al. 21 and her team investigated the influence of separators and draft tubes on the sensitivity of the pneumatic lifting reaction system by utilizing the Eulerian multiphase flow model and the k–ε turbulence model, three distinct layouts were utilized between the water pipe and the wall to ascertain the optimal spacing. The simulation outcomes exhibited a strong correlation with the experimental findings of Menzel et al., ultimately validating that the optimal distance facilitates efficient mixing of liquids and gases, enhances high rotational motion, and consequently boosts the reactor’s performance.
The aforementioned studies have delved into the operating parameters, internal characteristics and critical startup of air-lift pumps, thereby effectively enhancing their operational efficiency. However, the majority of these studies have primarily concentrated on the internal aspects of the pump, with scant attention devoted to the air intake angle. As a crucial structural parameter, the intake angle has a significant impact on the efficiency of the airlift pump. Previous studies have also demonstrated that the spiral air intake method can significantly enhance the efficiency of the airlift pump. Nevertheless, further exploration is warranted to delve into its underlying mechanisms and optimize its design. Hence, this article introduces a spiral air intake method, utilizing water as the conveyance medium. Using water as the conveying medium, the efficiency and flow pattern characteristics of the air lift pump under the influence of different parameters (air inlet angle, immersion rate and air inlet volume) were studied by numerical simulation. The research findings can serve as a theoretical foundation for enhancing the efficiency of airlift pumps, thereby facilitating the further expansion of their application domains.
Computational Model
Model Establishment and Grid Generation
Based on the airlift pump used in the experiment, its model is simplified, as shown in Figure 1. During the calculation, the water level in the reservoir was maintained at a constant level. A three-dimensional full-scale model, identical in proportion to the experimental reservoir, was constructed, with dimensions of 3,700 mm × 2,000 mm × 3,000 mm.The lifting pipe of the airlift pump had a length of 2,500 mm and an inner diameter of 91 mm. Insert a vertical lifting tube into the reservoir, and inject compressed gas into the airlift pump through the inlet channel. Five models of intake passages have been established, including 0°, 5°, 10°, 15°, and 20° variations. By continuously inflating the gas, a complex gas-liquid two-phase flow is formed within the riser, with the liquid phase serving as the primary continuous phase and the gas phase as dispersed phase. This article performs an independence analysis utilizing three distinct mesh quantities: Mesh 1, Mesh 2, and Mesh 3, with respective mesh counts of 695,423, 1,283,366, and 1,716,587. Figure 2 demonstrates the pressure distribution at various lifting heights across three distinct grid densities. From the figure, it can be seen that the error between Mesh 2 and Mesh 3 is comparable, with Mesh 1 having the largest error, considering the efficiency of computer operation. The final selection of the minimum mesh size is Mesh 2, with a mesh count of 1,283,366, which has the best simulation effect, saving time and increasing accuracy. Therefore, this article ultimately opts for Mesh 2 with a grid count of 1,283,366 for simulation, as it offers the most optimal simulation effect, efficiently balancing time efficiency and accuracy. During this simulation calculation, the pressure solver was utilized with the Piso algorithm to obtain the solution. Initially, it was presumed that the reservoir was completely filled with water, with the liquid level in the riser matching that of the reservoir. The top of the reservoir was in contact with air, and the liquid inlet boundary condition was designated as a pressure inlet, set the air reflux volume fraction to 0. Air inlet is configured as a mass flow inlet, outlet of the riser is connected to the atmosphere, with the boundary condition designated as a pressure outlet boundary, maintaining a pressure value equivalent to atmospheric pressure. All remaining conditions are set to their initial states. To guarantee computational precision, high-precision discretization schemes are adopted to discretize various variables in both time and space. Specifically, the QUICK discretization scheme is utilized for the volume fraction and turbulence intensity, while a second-order implicit discretization scheme is employed for momentum, turbulence dissipation rate, and time terms. Set the time step size to 0.001 s, with a convergence criterion that requires the calculated residuals to be smaller than the order of magnitude of 10−3. The software utilized for this purpose is the commercial software Fluent.
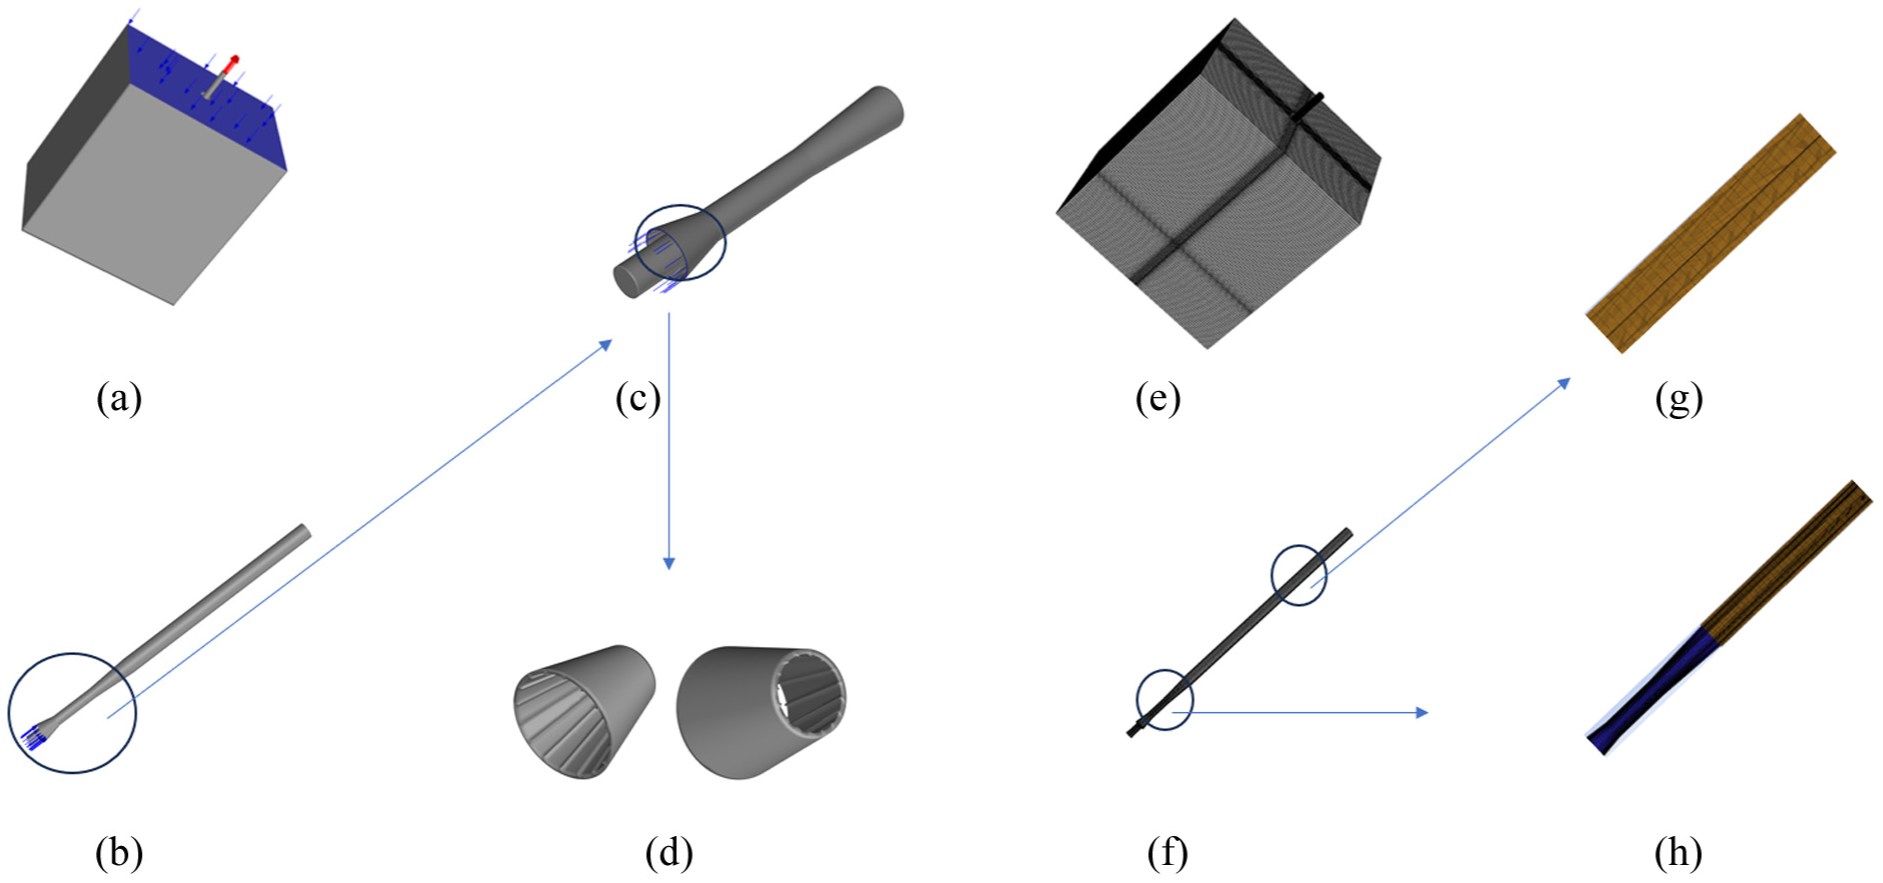
Calculation model. (a): Model diagram of air lift system. (b): Air lift pump and lifting pipe diagram. (c): Enlarged view of air lift pump. (d): Enlarged view of air transmitter. (e): Grid diagram of air lift system. (f): Schematic diagram of the air lift pump and its lifting tube grid. (g): Elevate the pipe grid. (h): Grid of air lift pump.
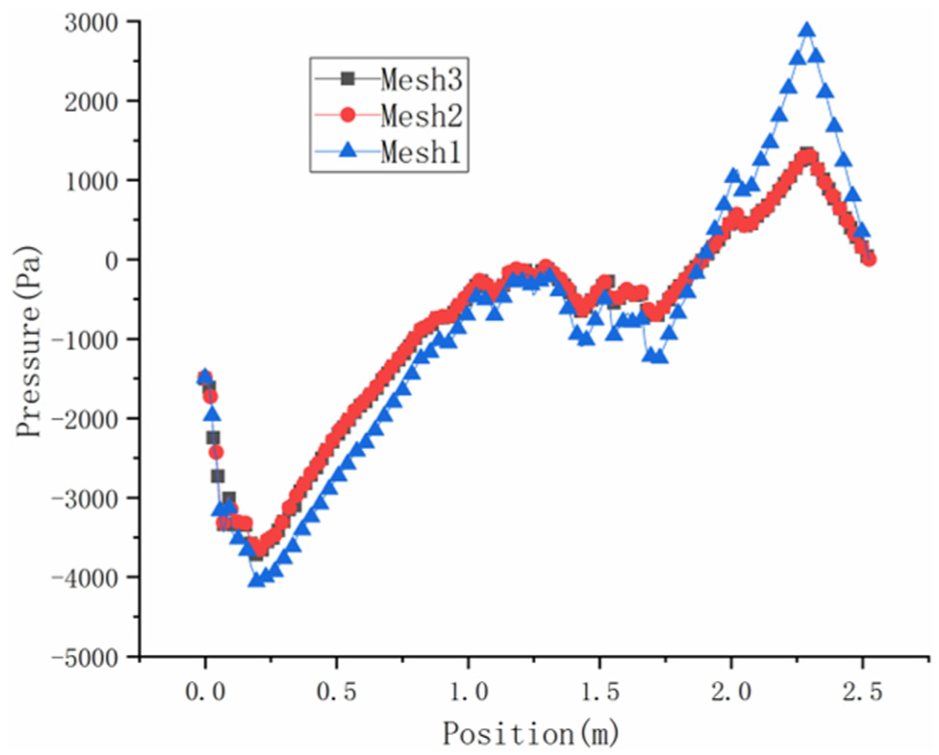
Comparison of pressure changes in different positions under three kinds of grids.
The immersion ratio (

Governing equations
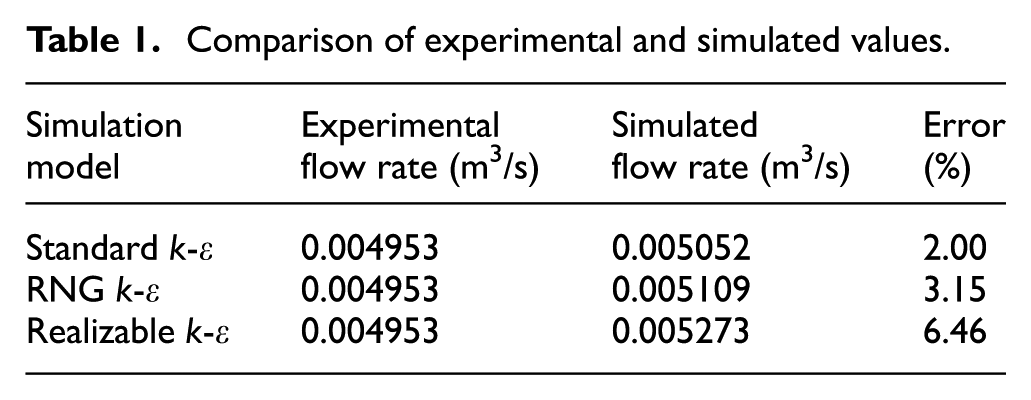
This article utilizes the VOF multiphase flow model, whose primary advantage lies in its precision in interface tracking, effectively capturing and preserving the interfaces between different fluids with clarity. To validate the accuracy of the turbulence model, comparisons were conducted among the Standard k-ε model, RNG k-ε model, and Realizable k-ε model, with the results summarized in Table 1. Among the three turbulence models, the Standard k-ε model exhibits the least deviation from experimental results, thus making it the preferred choice.
Comparison of experimental and simulated values.
The solution of the VOF model requires the use of flow equations, including continuity equations, momentum equations, and volume fraction transport equations.
Continuity equation:

Momentum equation:

Volume fraction transport equation:

The standard k-ε equation for turbulence is presented as follows 22 :


Model validation
To assess the influence of the spiral air intake method on enhancing the performance of the airlift pump, this paper establishes an experimental platform specifically designed for the airlift pump. The experimental platform primarily comprises a compressed air transportation system, an air lift pump system, a sampling device, and a conveyance pipeline system. The compressed air delivery system primarily comprises an air compressor, a pressure gauge, an energy storage tank, a gas flow meter, and a control valve switch. The pneumatic system primarily comprises an airlift pump, a lifting tube measuring 2500 mm in length and 91 mm in inner diameter, as well as an experimental pool with dimensions of 3700 mm in length, 2000 mm in width, and 3000 mm in height. The sampling device primarily comprises a sampling tank, a measuring cylinder, and an electronic scale. The inlet and outlet play a crucial role in maintaining the immersion rate. The experimental apparatus is depicted in Figures 3 and 4.

Schematic diagram of experimental system.

Physical image of experimental setup. (a) Air compressor: 2 sets of Model M40A screw-type compressors, with rated exhaust pressure of 1.3 MPa and power of 30 KW. (b) Gas storage tank:volume 2.0 m3, design pressure 1.43 MPa, pressure test 1.79 MPa, working pressure 1.3 MPa. (c) Experimental pool; 3700 mm (L) × 2000 mm (W) × 3000 mm (H). (d) Air flow meter: adopts a thermal pneumatic volume flow meter, model specification JL-LDR-80, flow range 0–600 m3/h, accuracy 1.5%, input voltage 220 V. (e) Airlift pump: 650 mm. (f) Riser: 1850 mm (L), 91(R). (g) Working fluid:water. (h) Sample:water tank.
Figure 5 shows the pump outlet flow rate with the inlet gas/air flow rate.

0.8 Immersion ratio of pump outlet flow rate with the inlet gas/air flow rate.
To validate the accuracy of the simulation method employed in this article, simulations and experiments were conducted to assess the displacement of water for five distinct spiral inlet angles, specifically under the conditions of an immersion ratio of 0.8 and an intake rate of 250 m3/h. Table 2 presents the comparison results between experimental and simulated values for increasing liquid flow rate. The results are shown in Table 2, indicating that all errors are within a range of 5%. From the table, it can be seen that the method used in this article is effective in simulating the spiral intake air lift pump.
Comparison between simulation results and experimental data.

Results and analysis
This article presents a numerical simulation study on the gas-liquid two-phase flow within an airlift pump, focusing on various conditions including immersion ratios, air intake volumes, and air intake angles, all conducted under standard temperature and pressure conditions. The specific parameters are detailed in Table 3. This article delves into the influence of various parameters on the enhancement of liquid volume flow rate, lifting efficiency, as well as gas phase volume fraction. The following formula is utilized for enhancement23,24:

Parameters and values.

The impact of different parameters on enhancing liquid volume flow rate
Figure 6, the impact of different parameters on enhancing liquid volume flow rate.
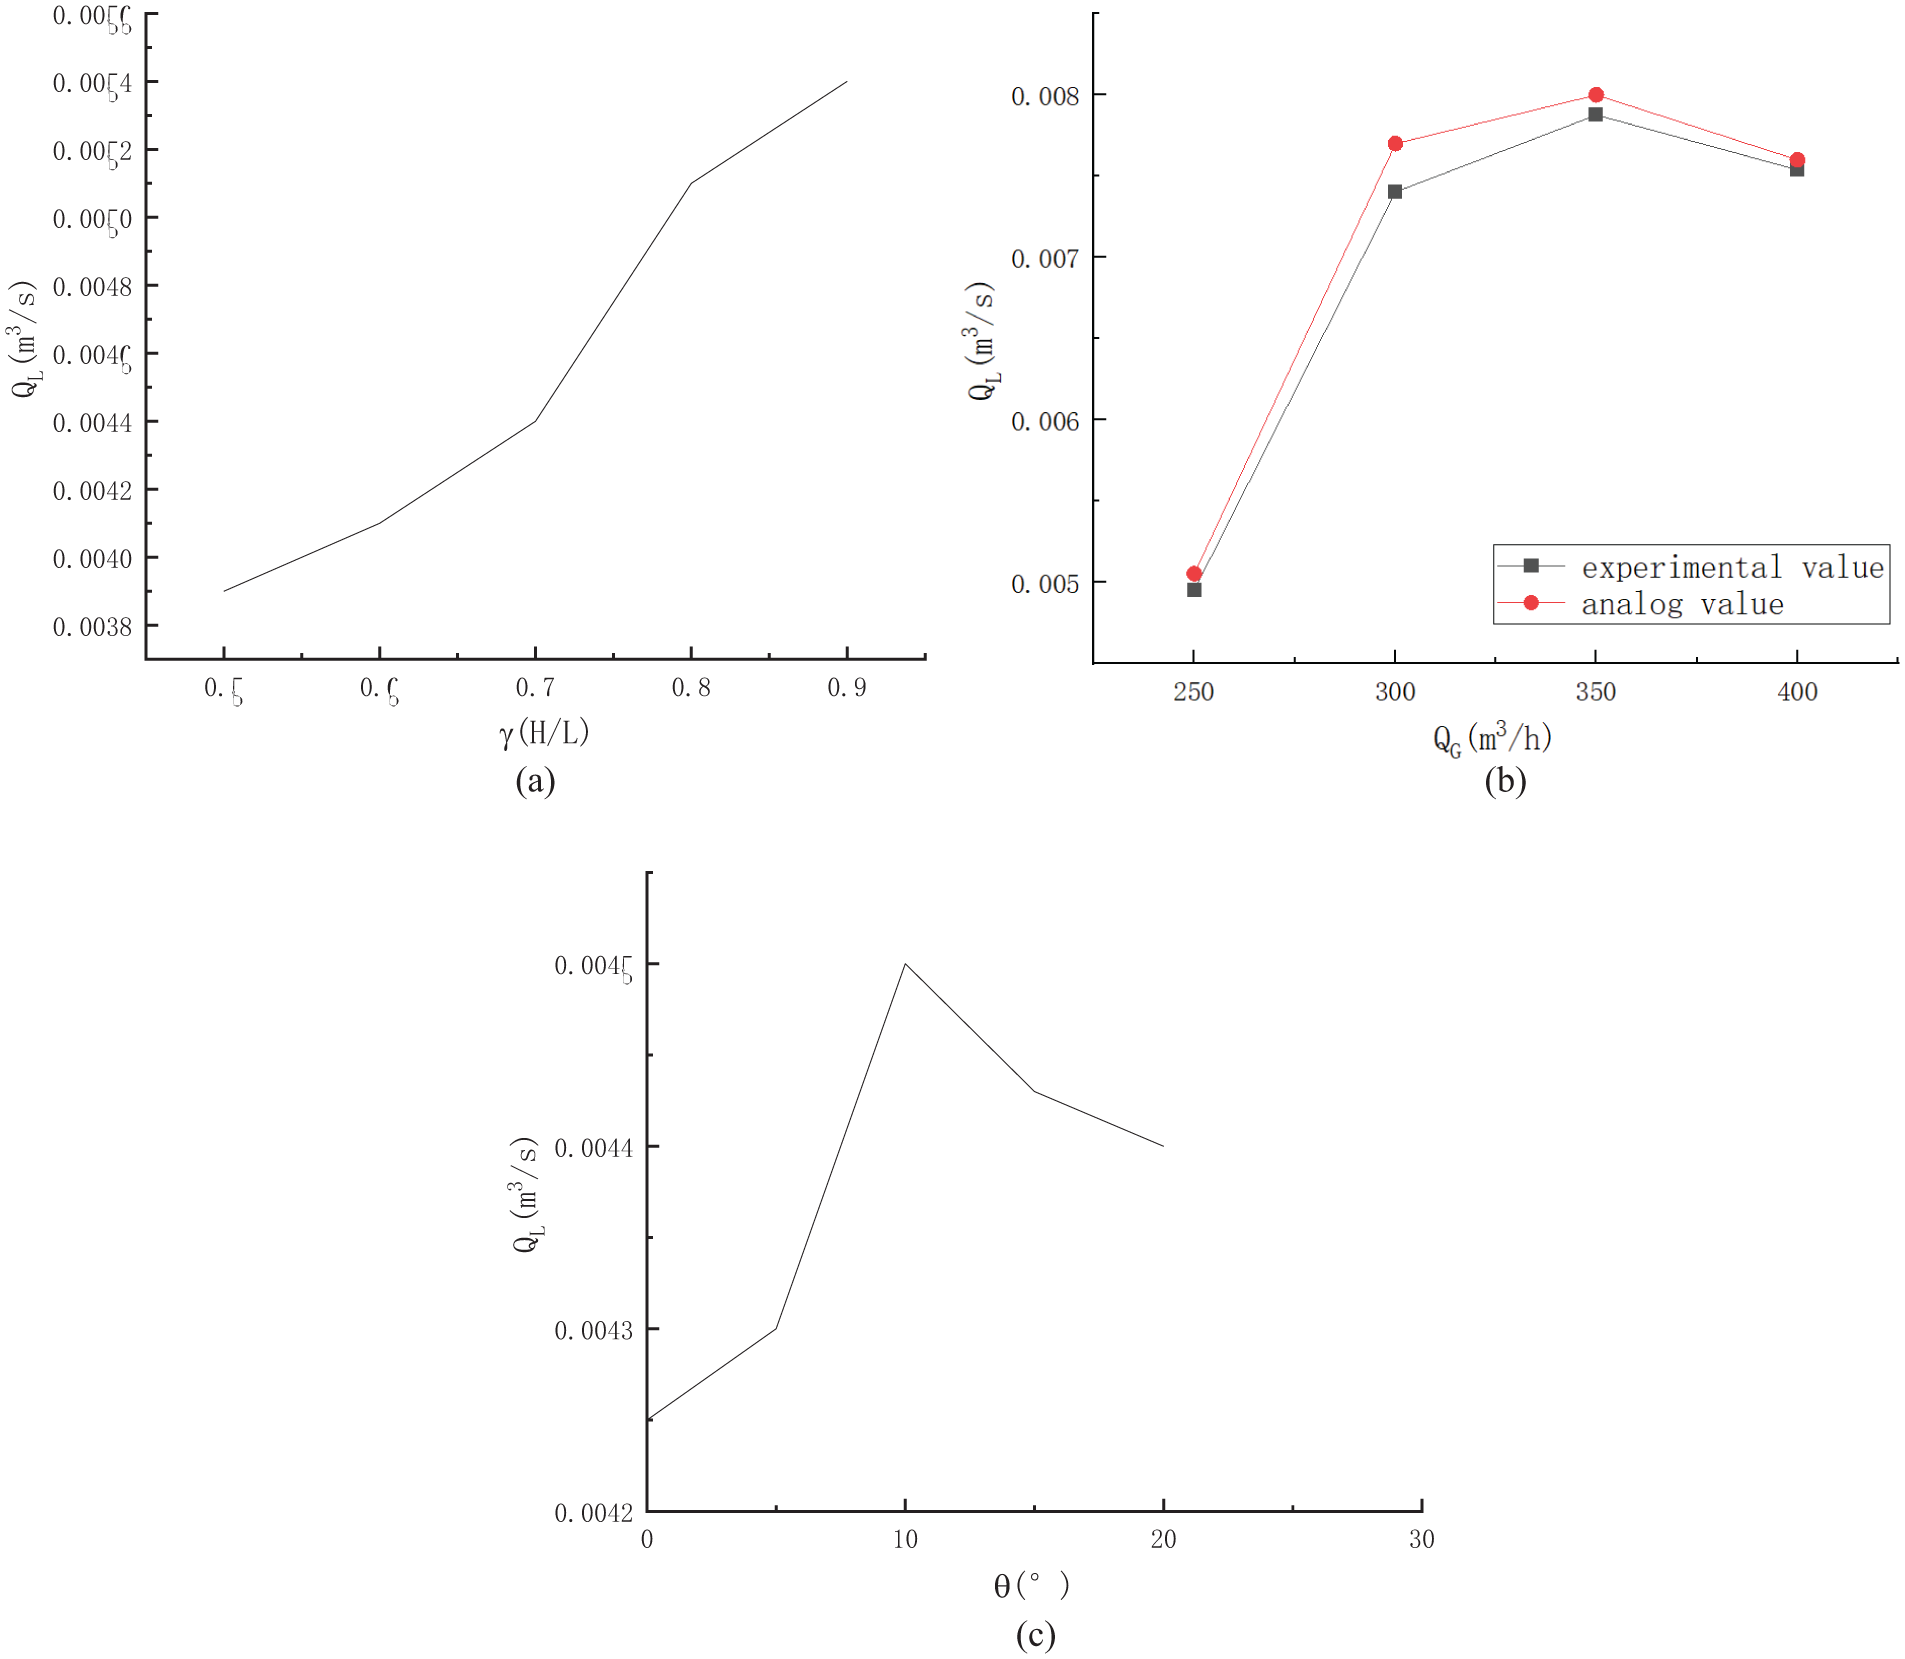
The impact of different parameters on enhancing liquid volume flow rate. (a) Variation of liquid volume flow with submergence ratio. (b) Variation of liquid volume flow with gas volume. (c) Variation of liquid volume flow with intake angles.
Figure 6 illustrates the liquid volume flow rate of the spiral-inlet air-lift pump under various parameters. Figure 4(a) illustrates that the liquid volume flow rate exhibits an upward trend as the submergence ratio increases. Figure 6(b) demonstrates that as the intake air volume increases, the liquid volume flow rate initially rises, followed by a subsequent decrease. As the intake air volume increases from 250 to 350 m3/h, the liquid volume flow rate correspondingly surges, ultimately attaining its peak at an intake air volume of 350 m3/h. As the intake air volume increases from 350 to 400 m3/h, the liquid volume flow rate unexpectedly decreases. Figure 6(c) demonstrates that as the helical inlet angle escalates, the liquid volume flow rate exhibits a trend of initial increase followed by a subsequent decrease. Notably, during the increment of the inlet angle from 0° to 10°, the liquid volume flow rate undergoes a corresponding surge, peaking at an inlet angle of 10°. As the intake angle increases from 10° to 20°, there is a decrease in the liquid volume flow rate, contrary to expectation.
The impact of different parameters on efficiency improvement
Figure 7, the impact of different operating conditions on the lifting efficiency of a spiral air intake pneumatic lifting device.

The impact of different operating conditions on the lifting efficiency of a spiral air intake pneumatic lifting device. (a) Variation of promoting efficiency with submergence ratio. (b) Variation of promoting efficiency with gas volume flow. (c) Variation of promoting efficiency with intake angles.
Figure 7 demonstrates the lifting efficiency of the spiral air intake pneumatic lifting device across various parameters. Figure 7(a) demonstrates a monotonic increase in efficiency with the escalating submergence ratio, albeit the growth rate gradually diminishes as the submergence ratio continues to rise. This is because as the submergence rate increases, the distance between the outlet of the riser and the liquid surface becomes shorter, and the energy consumed to lift the liquid to the outlet to overcome gravity and resistance decreases. Under the same intake volume, the energy obtained by lifting the liquid is the same. According to the law of conservation of energy, an increase in submergence rate will inevitably lead to an increase in the lifting flow rate of the liquid. Figure 7(b) demonstrates that as the intake air volume increases, the lift efficiency initially rises, reaching a peak, and then gradually declines. When the intake air volume increases from 250 to 300 m3/h, the lifting efficiency correspondingly enhances, reaching its peak at an intake air volume of 300 m3/h. When the intake air volume increases from 300 to 400 m3/h, the efficiency of the system unexpectedly decreases. This is because as the flow pattern inside the riser gradually transitions from bubbly flow to slug flow, the volume fraction of the gas phase increases, and the liquid lifting amount rapidly increases, increasing the lifting efficiency. Later, as the inflation amount continues to increase, the liquid lifting speed inside the riser slows down, and the lifting efficiency gradually decreases. Figure 7(c) demonstrates that as the helical inlet angle increases, the lifting efficiency initially rises and subsequently decreases. Notably, during the increment of the inlet angle from 0° to 10°, the lifting efficiency experiences a corresponding surge, the efficiency peaks at an intake angle of 10°, yet as the intake angle rises from 10° to 20°, the efficiency unexpectedly diminishes. This is because different angles of air incidence cause changes in the flow pattern inside the tube, which affects the efficiency of the air lift system. This will be analyzed in detail in the subsequent visualization of flow patterns inside the tube.
The evolution law of liquid lifting process over time
Figure 8 is a time series visualization of the distribution of air volume fraction inside the riser. The initial moment, the liquid level in the riser is level with the liquid level in the reservoir. Gas is injected into the riser section through the nozzle, and bubbles rise in the liquid. Within 0–0.5 s, small bubbles immediately gather in the riser, forming large bubbles. The liquid in the riser flows, but no liquid is discharged from the outlet. After 0.5 s, the liquid gradually discharges from the riser. Afterwards, the proportion of gas in the tube increased, and from 1 to 1.5 s, the main flow in the riser was slug flow and annular flow. After 1.5 s, the bubbles in the riser gradually connected, and the flow pattern gradually changed to slug flow.

Phase diagram of liquid lifting process.
The influence of different parameters on the gas phase volume fraction in the riser
Figures 9 –11 illustrates the distribution of liquid phase volume within the tube during stable operation of the spiral air intake pneumatic lifting device across various operating conditions.

Distribution of air volume fraction inside riser under different immersion ratios.

Distribution of air volume fraction in pipes under different intake rates.

Distribution of air volume fraction inside pipes at different angles.
As Figure 9 illustrates, under identical conditions of inlet angle and inlet volume, the bubbles in the riser section gradually enlarge as the submergence ratio increases, suggesting that gas is more prone to coalescing and forming larger bubbles through the air lift pump under conditions of high submergence ratios. This is attributed to the elevation of the liquid level in the riser pipe resulting from the increased submergence rate, which subsequently enhances the pressure exerted on the bubbles. As the pressure intensifies, the frequency of collisions and mergers among the bubbles also rises, facilitating the formation of larger bubbles within the riser section. This, in turn, favors the efficient lifting of liquids. Therefore, an increase in the submergence rate is beneficial for enhancing the volumetric flow rate and efficiency of the lifted liquid.
As Figure 10 illustrates, at a constant submergence ratio of the inlet angle, a notable increase in the proportion of air volume within the riser section is observed as the inlet flow rate rises from 250 to 400 m3/h. Initially, the flow pattern within the tube transforms from bubbly flow to slug flow, eventually evolving into churn flow, the bubble is subjected to various forces, including the viscous force of water, the inertial force arising from the accelerated motion of the liquid, surface tension, and buoyancy. At this juncture, the surface tension of the bubble diminishes as the airflow volume intensifies, rendering it negligible. Nevertheless, the bubble remains in a state of imbalance, influenced by viscous force, inertial force, and buoyancy. Consequently, to attain a state of equilibrium, the initial generation volume of the bubble is compelled to undergo a rapid expansion. At an intake volume of 300 m3/h, it becomes evident that the flow pattern within the riser tube manifests as slug flow, thus validating the observation that the pneumatic lifting system achieves its highest efficiency when the flow pattern within the two-phase flow tube exhibits slug flow characteristics.
As Figure 11 illustrates, under identical conditions of intake volume and submergence ratio, the gas injection speed is notably faster at intake angles of 0° and 5°, resulting in the gas primarily manifesting as small bubbles within the riser section, thus preventing the effective formation of larger bubbles, with an intake angle of 10°, gas is expelled through the air ejector, resulting in the convergence of air. This convergence facilitates the formation of larger gas bubbles in the riser section, and the emergence of slug flow in this section is conducive to the efficient lifting of the liquid phase, when the intake angle is set at 15° or 20°, the excessive angle poses a hindrance to the flow of air, resulting in the premature formation of small bubbles at the terminus of the airlift pump. This hindrance leads to a significant loss of kinetic energy in the air, thereby preventing the energy from effectively performing its intended function of lifting the liquid phase.
Classification of bubble flow regime
Bubble flow: Gas is distributed in a continuous liquid phase in the form of discrete bubbles. Due to the low gas volume at this time, the apparent flow velocity of the liquid is also small, and its elemental flow intensity is insufficient to disperse the gas phase, resulting in a certain degree of aggregation of small bubbles above the inlet until a stable bubbly flow is formed in the observation section.
Slug flow: Bubbles are affected by an unstable flow field, causing the front section of the Taylor bubble to be squeezed and twisted, forming an irregular slug flow. Corresponding to this stage.
Churn flow: After a slug flow, if the apparent flow velocity of the gas further increases, Taylor bubbles are forced to disperse due to the higher flow velocity, causing rupture and the mixed fluid to exhibit amorphous upward or downward oscillatory motion, resulting in a stirring state.
Annular flow: When the gas volume is too high, the gas phase containing a small amount of liquid flows in the core of the channel, and the liquid is compressed to the wall of the tube and flows slowly upward in a film shape, with a certain amount of small bubbles mixed in (Figure 12).

Classification of bubble flow regime.
Summary
This article presents numerical simulations of a spiral air-lift pump, focusing on various intake angles (0°, 5°, 10°, 15°, 20°), submergence ratios (0.5, 0.6, 0.7, 0.8, 0.9), and intake volumes (250, 300, 350, 400 m3/h). The simulations aim to investigate the influence of these parameters on the pump’s performance. The key findings are summarized as follows:
As the submergence ratio increases, the liquid volume flow rate and lifting efficiency of the airlift pump exhibit a consistently upward trend. Through the gas phase volume distribution diagram, it can be observed that under conditions of high submergence ratios, the formation of larger bubbles within the tube becomes more prevalent, favoring the lifting of the liquid phase.
As the intake air volume increases, the liquid volume flow rate and lifting efficiency of the airlift pump exhibit a trend of initial increase followed by a decrease. The volume distribution of the gas phase shows that the cause of this phenomenon is the change in the flow pattern in the tube. With the increase of air intake, the flow pattern in the pipe changes from bubble flow to elastic flow, and finally to stirred flow.
As the intake angle increases, the liquid volume flow rate and lifting efficiency of the air-lift pump exhibit a trend of initial increase followed by a decrease. Upon examination of the gas phase volume distribution diagram, it is evident that the flow pattern within the tube manifests as slug flow when the inlet angle is set at 10°, an angle that is excessively large or excessively small is detrimental to the formation of slug flow.
This study revealed the optimization mechanism of the helical intake structure on the performance of airlift pumps through numerical simulation, providing a theoretical basis for engineering applications. Future research can further combine experimental verification and multiphase flow extension (such as non-Newtonian fluids and industrial mud) to enhance the universality of the model and expand its application in deep-sea mining and environmental protection scenarios; At the same time, exploring dynamic parameter optimization, renewable energy drive, and machine learning technology integration will promote the intelligent and low-carbon development of air lift pumps under complex working conditions, providing a new path for industrial automation and green technology innovation.
Footnotes
Handling Editor: Divyam Semwal
Funding
The authors disclosed receipt of the following financial support for the research, authorship, and/or publication of this article: This research was funded by Hunan Provincial Natural Science Foundation of China (2023JJ50485), Hunan Provincial Department of Education Project (21A0555), Hunan Provincial Key Research and Development Plan Projects(2024AQ2001), The science and technology innovation Program of Hunan Province (2022RC1140).
Declaration of conflicting interests
The authors declared no potential conflicts of interest with respect to the research, authorship, and/or publication of this article.