
Abstract
The contact surfaces of beveloid gears have different topography features due to different machining methods, manufacturing accuracies, and surface wear, and they are not always smooth. As a consequence, in this study, a nonlinear dynamic model of a crossed beveloid gear was developed, considering tooth surface topography features and friction. The phase plane diagram, Poincare diagram, time-domain response diagram, bifurcation diagram, and spectrum diagram of the system response were obtained using the Runge–Kutta method to dissolve the differential equations of the system dynamics. The effect of parameters such as tooth roughness and time-varying friction on the dynamic response of a beveloid gear was then investigated, and the results show that the motion of the gear system denotes a simple harmonic with a period of 1 when the tooth surface roughness R a is <1.6 μm. And with the variation of tooth surface roughness, the motion state of the system presents a variety of response forms, such as single-period, multi-period, quasi-period, bifurcation, and chaos.
Introduction
Since the 20th century, with the increasingly close integration of computer technology and numerical calculation and analysis methods, gear transmission systems have continued to develop in the direction of low vibration, high speed, and high life. In modern industry, face gears and worm gears exhibit better meshing performance than involute helical gears for large shaft intersection angles close to 90° transmission in spatially interleaved drives. However, for small shaft intersection angles <45° transmission, face gears, and worm gears are more problematic in practical applications due to sensitive manufacturing errors and assembly errors. As a new type of gear, involute beveloid gears1,2 may resolve concerns in face gear and worm gear transmission and accomplish transmission forms which including parallel shaft, small-angle intersecting shaft, and cross shaft, which are frequently employed in four-wheel-drive gearboxes and marine gearboxes. However, in actuality, the contact tooth surfaces of beveloid gears are rarely smooth, compromising the dynamic meshing forces and friction, and indeed the systems’ dynamic behavior. To enhance the dynamic response of beveloid gear, it is necessary to investigate the consequences of tooth surface roughness, surface topography, and friction under various conditions.
In actual engineering applications, gear vibration/noise issues are always the most pressing concerns. The vibration/noise of the gear transmission system is mostly generated by the vibration excitation caused by the gear meshing, according to experimental findings.3–5 The study of nonlinear dynamics of the gear transmission system has been one of the hottest concerns in recent years in order to promote the stability of the gear transmission system. Kahraman and Blankenship developed a single-degree-of-freedom spur gear nonlinear dynamics model that took into account the influence of periodic time-varying stiffness and used numerical approaches to predict the system’s dynamic behavior. 6 Wang et al. proposed a theoretical model to investigate the dynamic load distribution and transmission error of a pair of spur gears under the impact of bearing elasticity and assembly errors. 7 Inalpolat et al. considers the effects of gear tooth indexing errors on dynamic performance. 8 Hu et al. examined the nonlinear dynamic response of a geared shaft rotor system by developing a coupled lateral-torsional geared shaft rotor dynamic model that took into account the influence of time-varying mesh stiffness, backlash, and static transmission error excitation. 9 Han developed an eight-degree-of-freedom governing equation that includes friction excitations and explores the dynamic responses of a pair of helical gears while bearing in mind the interaction between friction and mesh stiffness. 10 For the research of dynamics of beveloid gear transmission system, To evaluate the mesh and dynamic characteristics, Song et al. proposed a new method of incorporating the gear sliding friction model and loaded mesh model into an analytical nonlinear crossed beveloid geared vibration model. He also performed vibration examinations for a marine gearbox with crossed beveloid gears to examine the dynamic responses.11,12 He explored a parametric modeling and dynamic contact analysis approach for involute and noninvolute beveloid gears. 13 In recent years, the influence of surface topography characteristics on the dynamic response of transmission systems has been gradually paid more attention by scholars. Chen et al. improved a nonlinear dynamic model by modifying the Weierstrass–Mandelbrot function to define the gear backlash equation and examined the impact of microscopic characteristics on a geared rotor-bearing system’s tooth surface on the system’s nonlinear response.14,15 Mo et al. employed meshing theory to construct the face gear’s tooth surface equation and investigated the effects of friction on the system’s dynamic behavior. 16 Huang et al. investigated the dynamic parameters of a spur gear pair system with fixed and fractal backlash, comparing the system’s bifurcation and chaos with the two types of gear backlash. 17
At present, gear nonlinear dynamic models mainly focus on considering meshing stiffness, meshing damping, backlash, friction, and other factors. Although some researchers have recently focused on the relevance of surface topography characteristics on the dynamics of gear systems, recent investigations overlook the correlation between topography features and tooth surface friction. In reality, the system’s vibration is determined by the roughness, topography, and friction of the contact tooth surface. The purpose of this paper is to generate a nonlinear dynamic model of crossed beveloid gear pairs that takes into account surface topography features and friction, as well as to explore the influence of tooth backlash, meshing stiffness, meshing damping, tooth roughness, and friction on the dynamic response of crossed beveloid gear.
Nonlinear dynamics equation of crossed beveloid gear pairs
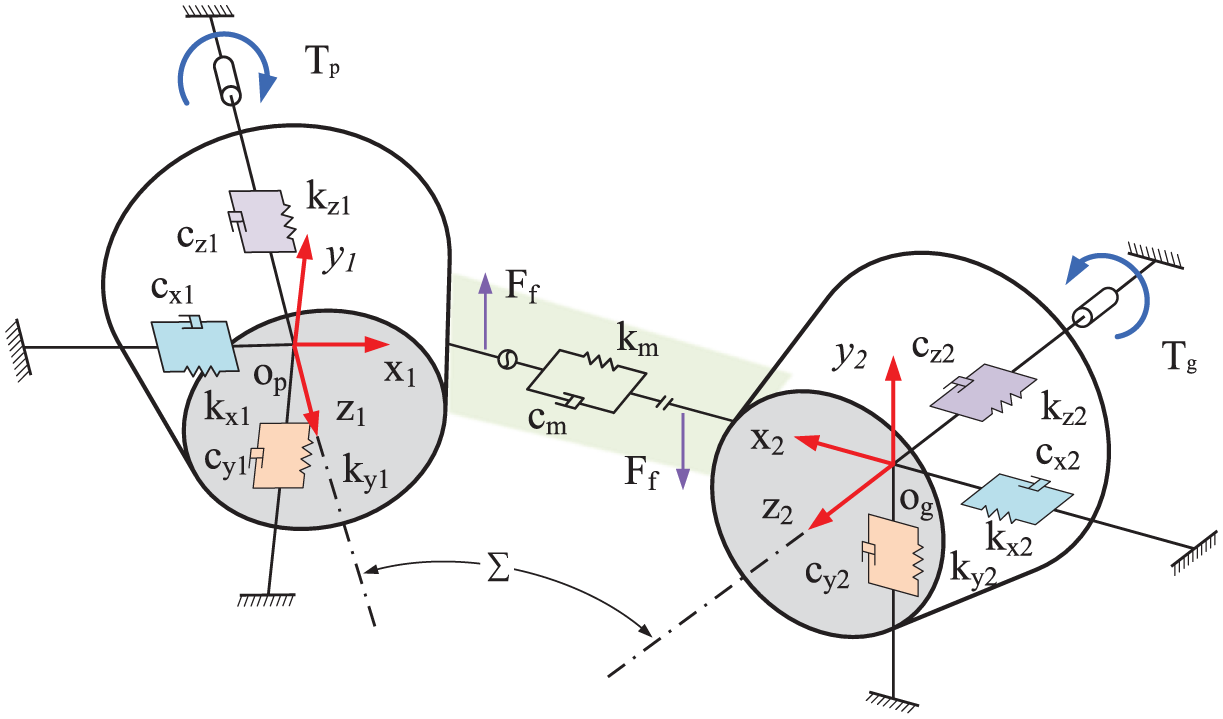
As shown in Figure 1, the Nonlinear dynamic model of the crossed beveloid gear transmission system under elastic support is established by considering the load excitation, meshing stiffness, meshing damping, and tooth backlash. The angle of crossed shafts of the two beveloid gears is ∑, the coordinate systems O p —X1Y1Z1 and O g —X2Y2Z2 were established with the midpoint of the tooth width of the two beveloid gears as the coordinate origin and axis directions of beveloid gear as the Z-axis, and the radial directions of beveloid gear as the X-axis, respectively. The entire beveloid gear transmission system considers eight degrees of freedom, including various forms of btion such as transverse vibration, axial vibration, and torsional vibration of X, Y, and Z axes, which are:

The magnitude, direction, and mesh point of the normal meshing force between the two gear teeth constantly change during the actual meshing process. In order to facilitate the analysis, the midpoint O p and O g of tooth width are used as the analysis points in this paper. As shown in Figure 1, T p and T g are the working torque, and load torque, k ij , c ij (i = p, g; j = x, y, z) are the equivalent mesh stiffness and equivalent support damping for each coordinate axis direction of the gear and pinion, respectively. k m denotes the mesh stiffness, and c m denotes mesh damping, m p and m g are the concentrated mass of the gear and pinion, e n are normal meshing errors, b m is the tooth backlash, μ(t) is the friction coefficient between tooth surface, θ p , θ g is the torsional vibration displacement, and the direction of rotation of the driving gear is positive.
Dynamics model of crossed beveloid gear pairs.
As shown in Figure 2, owing to the force analysis of the beveloid gear pairs, the normal meshing force on the beveloid gear pairs is a pair of action and reaction forces. The normal meshing force and the component forces along each axis direction can be expressed as:


Where F n is the normal meshing force, k(t) is the mesh stiffness, α n is the normal pressure angle, β1, β2 is the helix angle of the gear and pinion, respectively, δ1, δ2 is the cone angle of the gear and pinion, respectively. [a1 a2 a3]T is the directional cosine of the normal meshing force in the local coordinate system of the gear and pinion.

The discretization of tooth contact area for beveloid gear.
By analyzing the friction between the crossed beveloid gear pairs, the friction force at the midpoint of the tooth width can be expressed as the component force in each coordinate direction under the local coordinate system of the gear and pinion.


Where F f is the frictional force, μ(t) is the time-varying friction coefficient, [c1 c2 c3]T is the directional cosine of the frictional force in the local coordinate system of the gear and pinion, λ(t) is the direct function of frictional force, which can be expressed as:

Where α k denotes the meshing angle.
The interaction of cone and helix angles on the meshing operation of crossed beveloid gears generated dynamic meshing forces in the axial direction. As a result, torsional, transverse, and axial vibrations appear in the nonlinear dynamics system of crossed beveloid gear transmission. The differential equations of crossed beveloid gear pairs can be expressed as follows:

where m p , m g are the concentrated mass. J p , J g are the moment of inertia of the gear and pinion, respectively. r p , r g are the radius of the gear and pinion at the point of meshing. T p is the operating torque excitation, and T g is the load torque excitation. If the load torque fluctuation is ignored, the operating torque excitation and load torque excitation can be expressed as Tp = Tpm + Tpv and Tg = Tgm, respectively. T pm and T gm are the average values of working torque and load torque, and T pv is the amount of working torque fluctuation.
Calculation of time-varying meshing parameters
Mesh stiffness
The beveloid gear could be converted to a series of thin cylindrical involute spur gear disks with the same thickness but different modification coefficients, as shown in Figure 3. Summing the meshing stiffness of each spur gear disk in the elliptical contact region generates the beveloid gear’s total meshing stiffness.

The discretization of tooth contact area for beveloid gear.
The potential energy of each spur gear disk under the action of normal meshing force F n may be represented as using the potential energy approach and the slice grouping method18,19:

Where the Hertzian mesh stiffness is k n , the bending stiffness is k b , the shear stiffness is k s , the axial compressive stiffness is k a , and the fillet-foundation stiffness is k f , respectively.
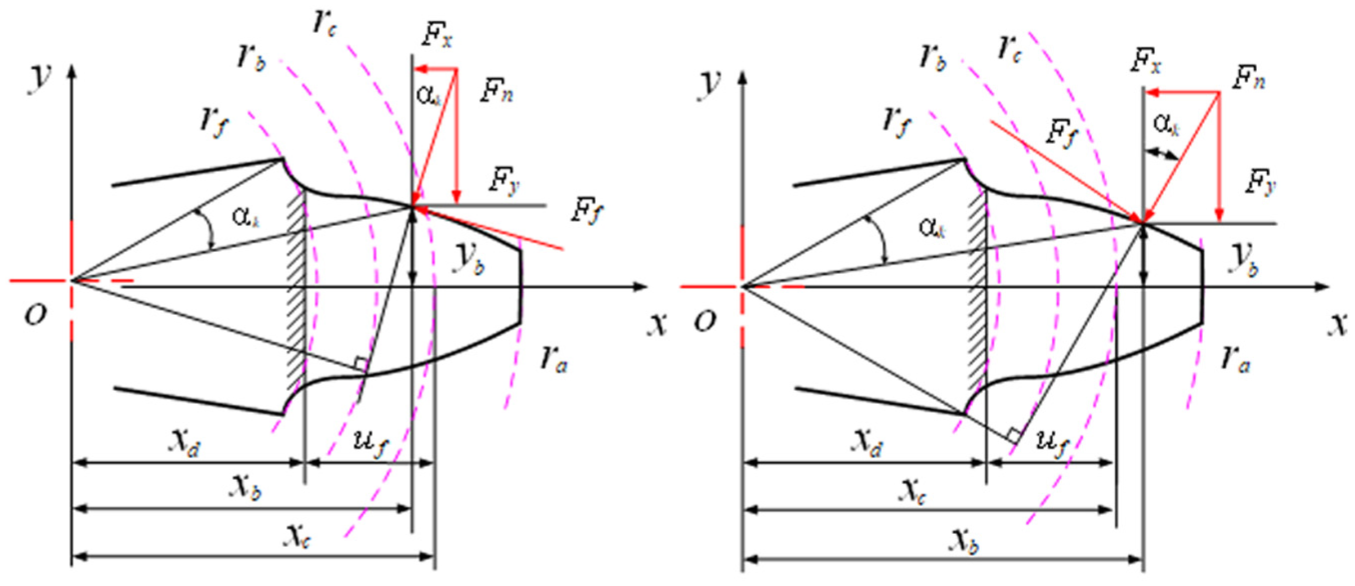
The tooth of beveloid gears has been simplified into a variable cross-sectional cantilever beam, as shown in Figure 4. The schematic schematics of the force analysis in the approach and recess processes, respectively, are shown in Figure 4(a) and (b). The stored bending potential energy, shear potential energy, and compressive potential energy of each spur gear disk are represented as follows using the cantilever beam model and elastic mechanics knowledge.

In the x-axis direction, the component force may be represented as:

In the y-axis direction, the component force may be represented as:

The equivalent bending moment is written as:

Where α k is the working pressure angle, α n is the pressure angle at the pitch point. β is the helix angle, and β1, β2 is the helix angle of the gear and pinion, respectively. δ is the cone angle, and δ1, δ2 is the cone angle of the gear and pinion, respectively, μ(t) is the friction coefficient.
Geometry diagram of beveloid gear teeth: (a) Approach Process (b) Recess Process.
The bending stiffness k b is calculated as follows:
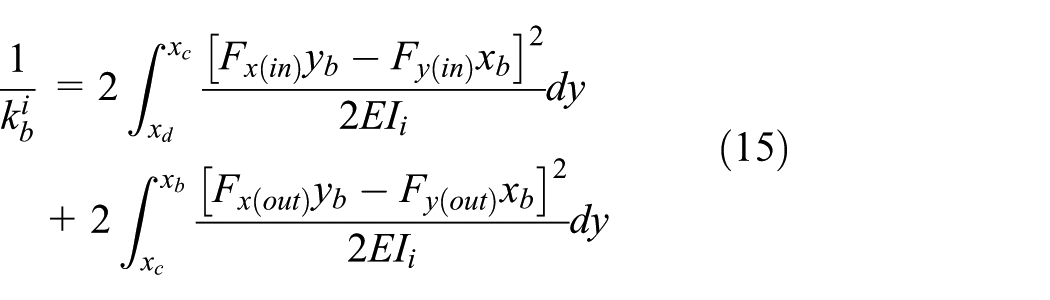
Therefore, the bending stiffness of beveloid gears can be calculated as follows:

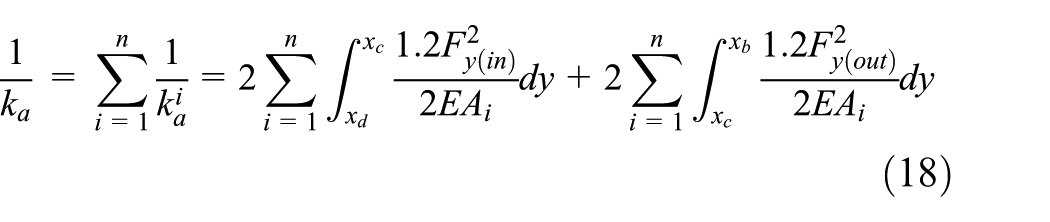
Similarly, the shear stiffness k s and compressive stiffness k a of beveloid gears can be calculated as follows:

The fillet-foundation stiffness k f of beveloid gears can be calculated by the following equation:

The calculation method of relevant parameters is detailed in Feng et al. 20
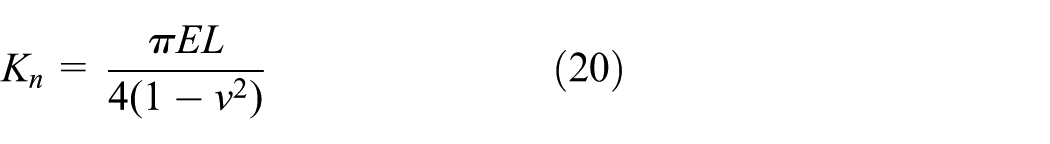
The literature 21 assumes the Hertzian mesh stiffness of a pair of meshing teeth composed of the same material to be a constant along the mesh region, and the beveloid gear pairs are supposed to be isotropic elastomers in this research. It is independent of the contact position. This constant may be written as follows:
In summary, the total mesh stiffness can be calculated as follows:

Mesh damping
The mesh damping of the gear pairs is calculated as:

Where, ζ g is the meshing damping coefficient of the gear pair, generally 0.03–0.17, k′ m is the average meshing stiffness, m i is the mass of gear i, (i = 1, 2).
Fractal tooth backlash
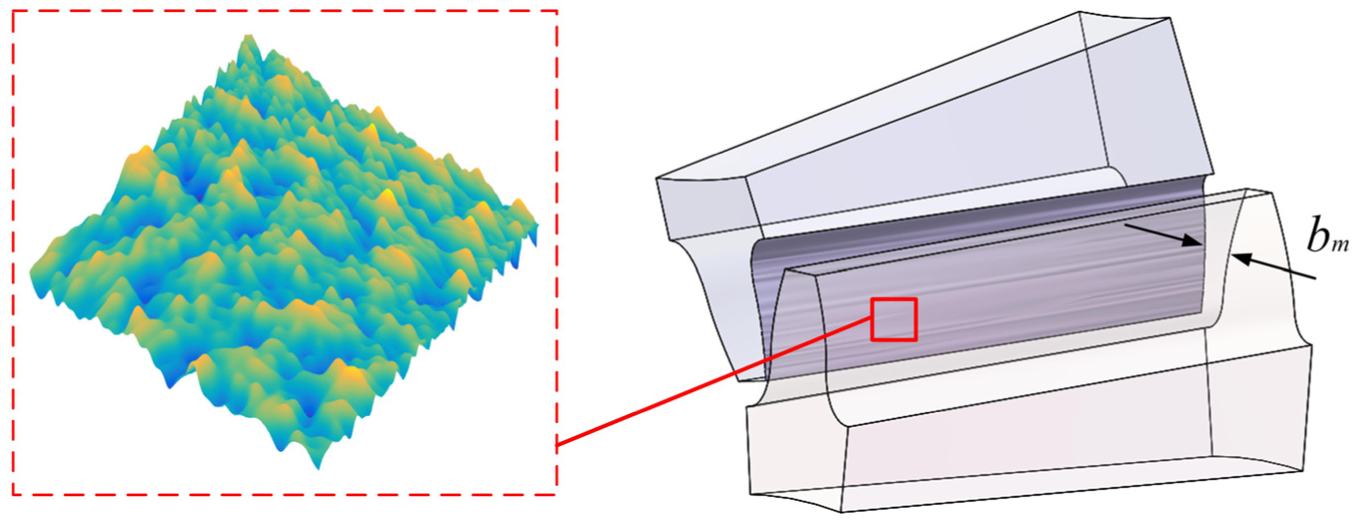
In previous gear dynamics research, the gear tooth profile was assumed to be excellent, that is, the surface was smooth. However, as illustrated in Figure 5, the tooth surface is generally rough, and harmonic components of various frequencies superimpose the surface topography characteristics. The unevenness may be evaluated in practical engineering by the surface roughness R a . Yuan et al. 22 results demonstrate that the machined surface exhibits fractal characteristics, and the Weierstrass–Mandelbrot function could represent the machined surface’s tooth surface topography characteristics. generating the real tooth backlash model, the topography characteristics are simulated in this paper using the Weierstrass–Mandelbrot function.
Actual beveloid gear profile.
In the previous analysis of gear system dynamics, the tooth side clearance is defined as a constant b. The tooth backlash function can be expressed by the segmentation function as follows:

Where b n denotes the half of tooth backlash.
However, the tooth surface in actual engineering is not absolutely smooth, as shown in Figure 6. The tooth backlash in actual engineering is influenced by the surface topography characteristics, and the minimum tooth side clearance b0 is the distance between the highest points of the tooth profile of the two meshing tooth surfaces. According to Xu and Kahraman, 23 the true tooth side clearance of the gear based on the W–M fractal function can be expressed as:

Where, b0 is the distance between the highest points of the tooth profile of the two meshing tooth surfaces, Ra1 and Ra2 are the roughness values of the gear and pinion tooth surfaces, D1 and D2 are the fractal dimensions of the rough tooth surfaces of the gear and pinion, n is the number of sampling points of the tooth profile length of the rough tooth surface.
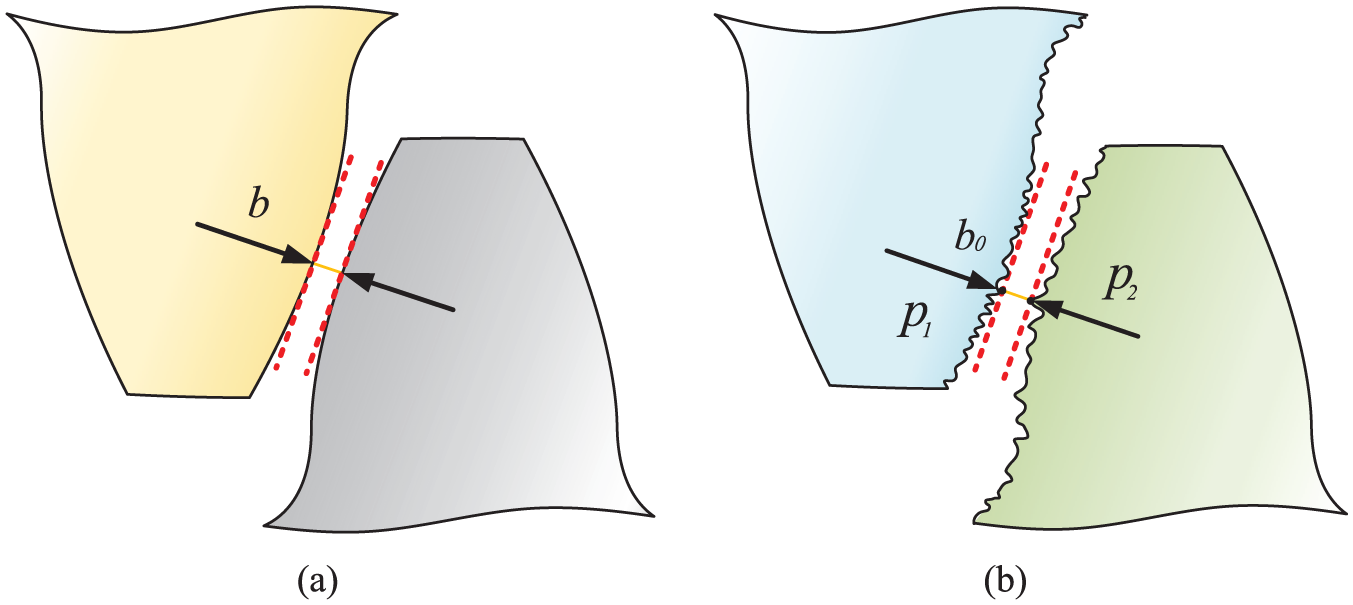
Sketch of gear backlash. (a) Fixed tooth backlash. (b) Fractal tooth backlash.
In summary, the tooth backlash function for the rough tooth surface can be expressed as:

Noteworthy, the definition of tooth backlash for beveloid gears is similar to that of spur gears, that is, the relative wobble of the assembled gear pair is the tooth backlash, measured in terms of the arc length on the pitch circle. However, the difference is that for beveloid gears, the tooth backlash is calculated by the arc length on the meshing line at the midpoint of the tooth width.
The static transmission error
In the previous analysis, the static transmission error e n (t) is assumed to be an ideal single-period harmonic function. However, the real tooth surface topography is more complex. Based on the Fractal theory, by simulating the real topography characteristics of the tooth surface, the static transmission error e n (t) of the gear pair can be expressed as:

Where Z q (x), Z g (x) represent the tooth surface roughness of gear and pinion. According to the fractal theory, the mathematical model of surface topography characteristics can be expressed as:

Where D is the fractal dimension of the rough surface. G is the fractal roughness of the rough surface, the fractal dimension D, and the fractal roughness G can be calculated by equations (28) and (29). The tooth surface topography at roughness R a of 0.4, 0.8, 1.6, 3.2, and 6.3 μm are shown in Figure 7.


Profile height deviation with different surface roughness.
Time-varying friction coefficient
Xu and Kahraman 23 used the EHL model to conduct a large number of simulation tests on the friction coefficient between the gear teeth, and the tooth surface friction coefficient μ(t) can be expressed as:

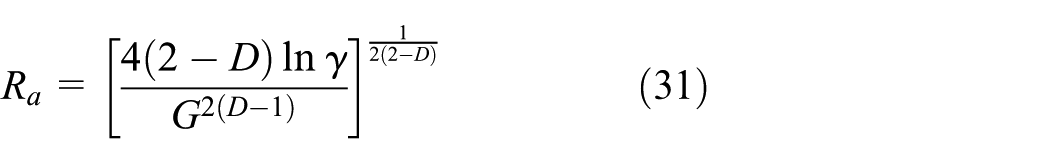
Where v 0 denotes the absolute viscosity and V ek denotes the entrainment velocity. SR k denotes the rolling ratio. P hk denotes the contact pressure and R k denotes the comprehensive radius. b i (i = 1–9) is the regression coefficient, shown in Table 1. R a denotes the tooth roughness and R a can be expressed as:
Values of regression coefficients.

The expression for f (SR k , P hk , v0, R a ) denotes:

To further reveal the influences of the tooth surface friction coefficient under different working conditions, Figure 8 gives the influence of tooth roughness and entrainment velocity on the coefficient. It can be illuminated that the friction coefficient at the pitch point tends to be 0 because there is no relative sliding velocity. Approaching the pitch point, the relative sliding velocity becomes smaller, and the friction coefficient gradually decreases owing to the increase of the comprehensive radius. Away from the pitch point, the relative sliding velocity of the tooth surface increases, and the friction coefficient gradually increases. In addition, the friction coefficient in the approach process is slightly larger than in the recess process because the contact pressure in the approach process is more significant than in the recess process. Figure 8(a) demonstrates that the friction coefficient decreases with the increase of the entrainment velocity. Conversely, as shown in Figure 8(b), the friction coefficient increases with the increase of tooth roughness, and the tooth roughness has a more noticeable effect on the friction coefficient.

Comparative analysis of tooth surface friction coefficient under different parameters. (a) Friction coefficient under different entrainment velocity. (b) Friction coefficient under different tooth roughness.
The influence of basic parameters on the dynamics of the gear system
To further disclose the influence of surface topography on the friction dynamics of crossed beveloid gear, the differential equations of the dynamic systems for crossed beveloid gear shown in equation (9) were solved by the Runge–Kutta method, and the main parameters of the gear and pinion are presented in Table 2. The input torque Tp = 800 Nm, the output torque Tg = 1250 Nm, and the input speed n = 2500 rpm. The bifurcation characteristics of the relative vibration displacement with the variation of tooth surface roughness are shown in Figure 9.
Main parameters for crossed beveloid gear pairs.


System bifurcation diagram when tooth surface roughness changes.
As can be seen in Figure 9, the crossed beveloid gear transmission system presents rich nonlinear phenomena. The dynamic stability of the gear system is directly related to the surface roughness of the gear. When the tooth surface roughness R a is <0.8 μm, the motion of the gear system is simple harmonic with a period of 1. When the tooth surface roughness R a is between 0.8 and 1.2 μm, the system exhibits a periodic motion with a period of 2. With the continuous increase of tooth surface roughness R a , Hopf bifurcation occurs in the system, and the system changes from a stable periodic motion to a quasi-periodic motion.
When the tooth surface roughness R a increases to 1.8 μm, the system enters the chaotic motion from the quasi-periodic motion. When the tooth surface roughness R a increases to 2.4 μm, the system enters the quasi-periodic motion again. However, it can be seen from the figure that the amplitude of the vibration displacement varies to a greater extent in the quasi-periodic motion than before. When the tooth surface roughness R a increases to 2.7 μm, the system enters the chaotic motion from the quasi-periodic motion again. It can be seen that as the tooth surface roughness R a increases, the value of the system vibration displacement amplitude also increases.
In order to analyze the influence of different tooth surface roughness on the dynamic response of the crossed beveloid gear pairs, this paper extracts a system dynamic response diagram when the values of tooth surface roughness are 0.2, 0.8, 1.6, 1.8, 2.6, and 2.8 μm, respectively.
When the tooth surface roughness R a is 0.2 μm, Figure 10 illustrates the phase plane diagram, Poincare diagram, time-domain response diagram, and spectrum diagram of the system. The phase plane diagram track is a single circle closed curve during this time, the Poincare diagram corresponds to a discrete immobile point, the time-domain response diagram shows a simple harmonic, and the spectrum diagram demonstrates only a single peak amplitude, indicating that the system exhibits a single-period simple harmonic motion at this time.
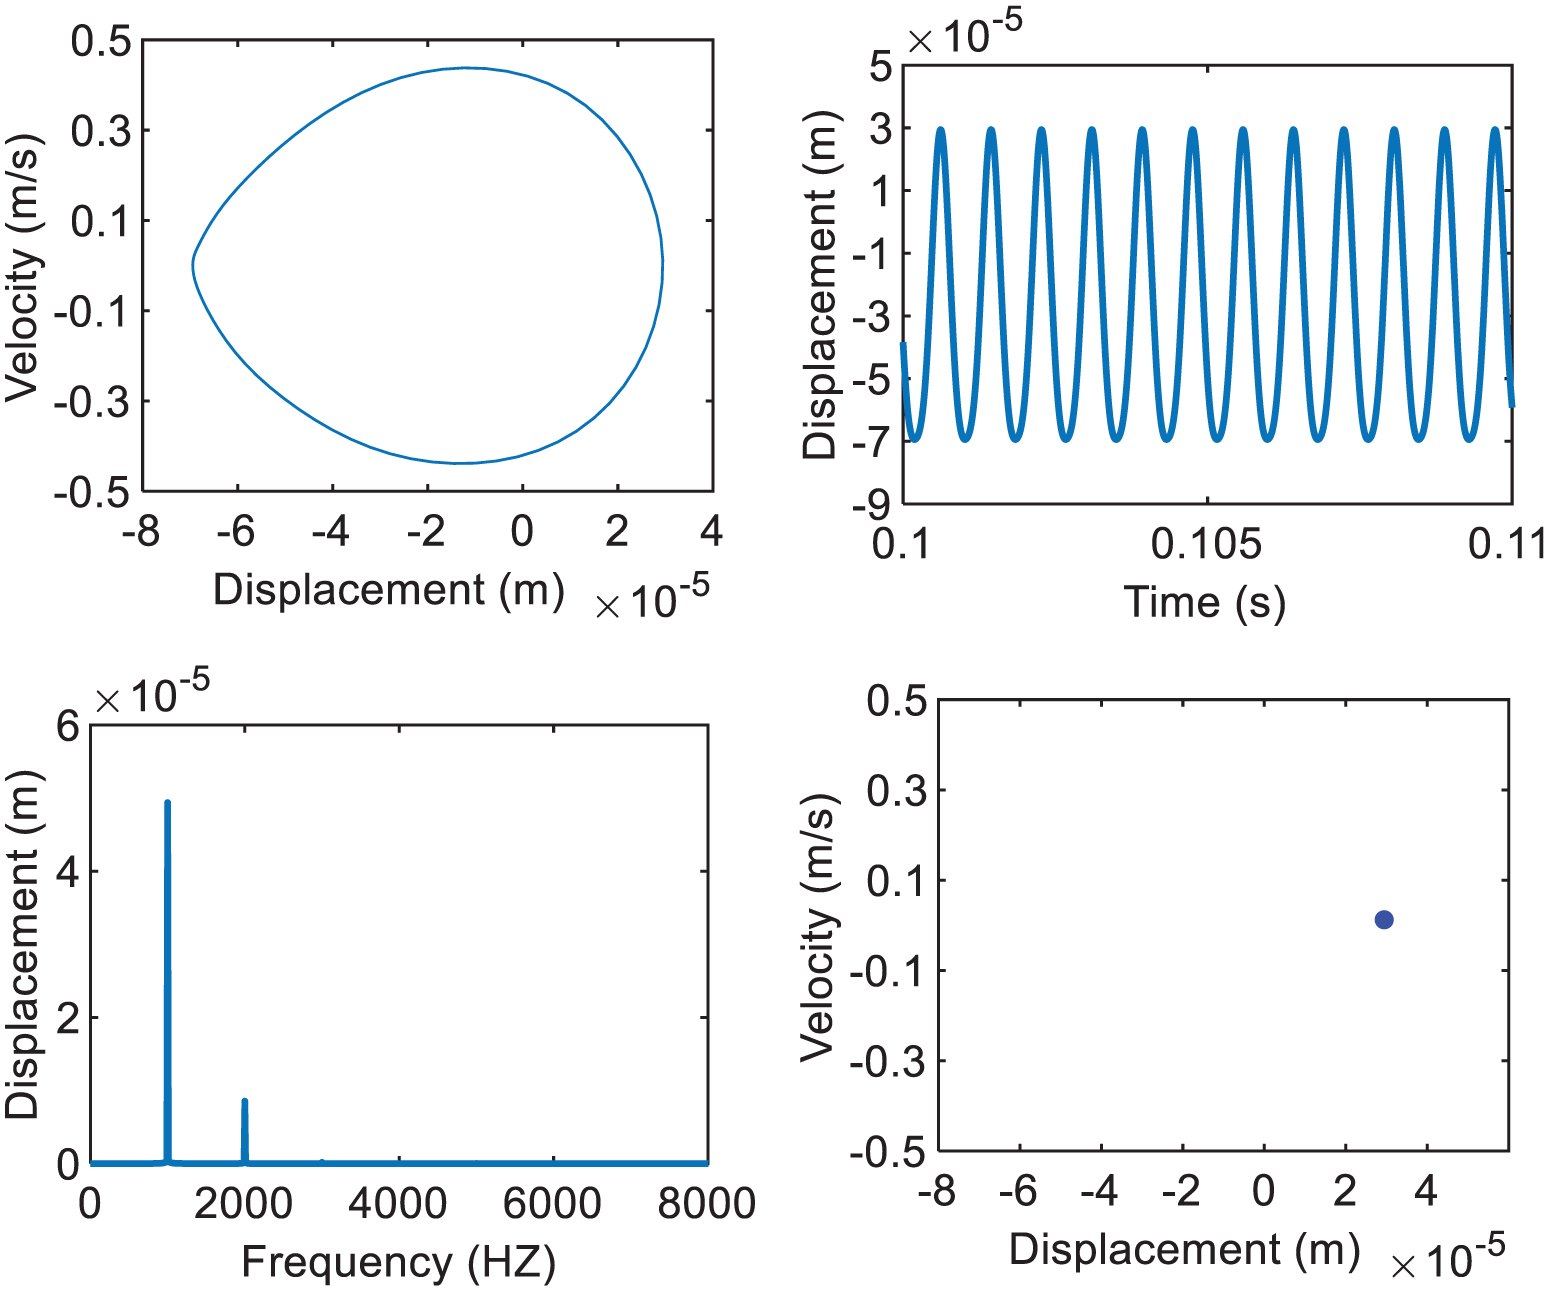
System response diagram when Ra = 0.2 μm.
Figure 11 shows the phase plane diagram, Poincare diagram, time-domain response diagram, and spectrum diagram of the system when the tooth roughness R a is 0.8 μm. At this period, the track of the phase plane diagram is shown as a winding two circles and has a certain width of the curve band, And the Poincare diagram corresponds to two sets of finite point sets. The time domain response of the system shows that the system still has some periodicity at this time. In the frequency spectrum, it can be seen that the system has significant vibration at the engagement frequencies of 880 and 1890 HZ. The above results show that the system is in a periodic motion with a period of two at the tooth surface roughness Ra = 0.8 μm.
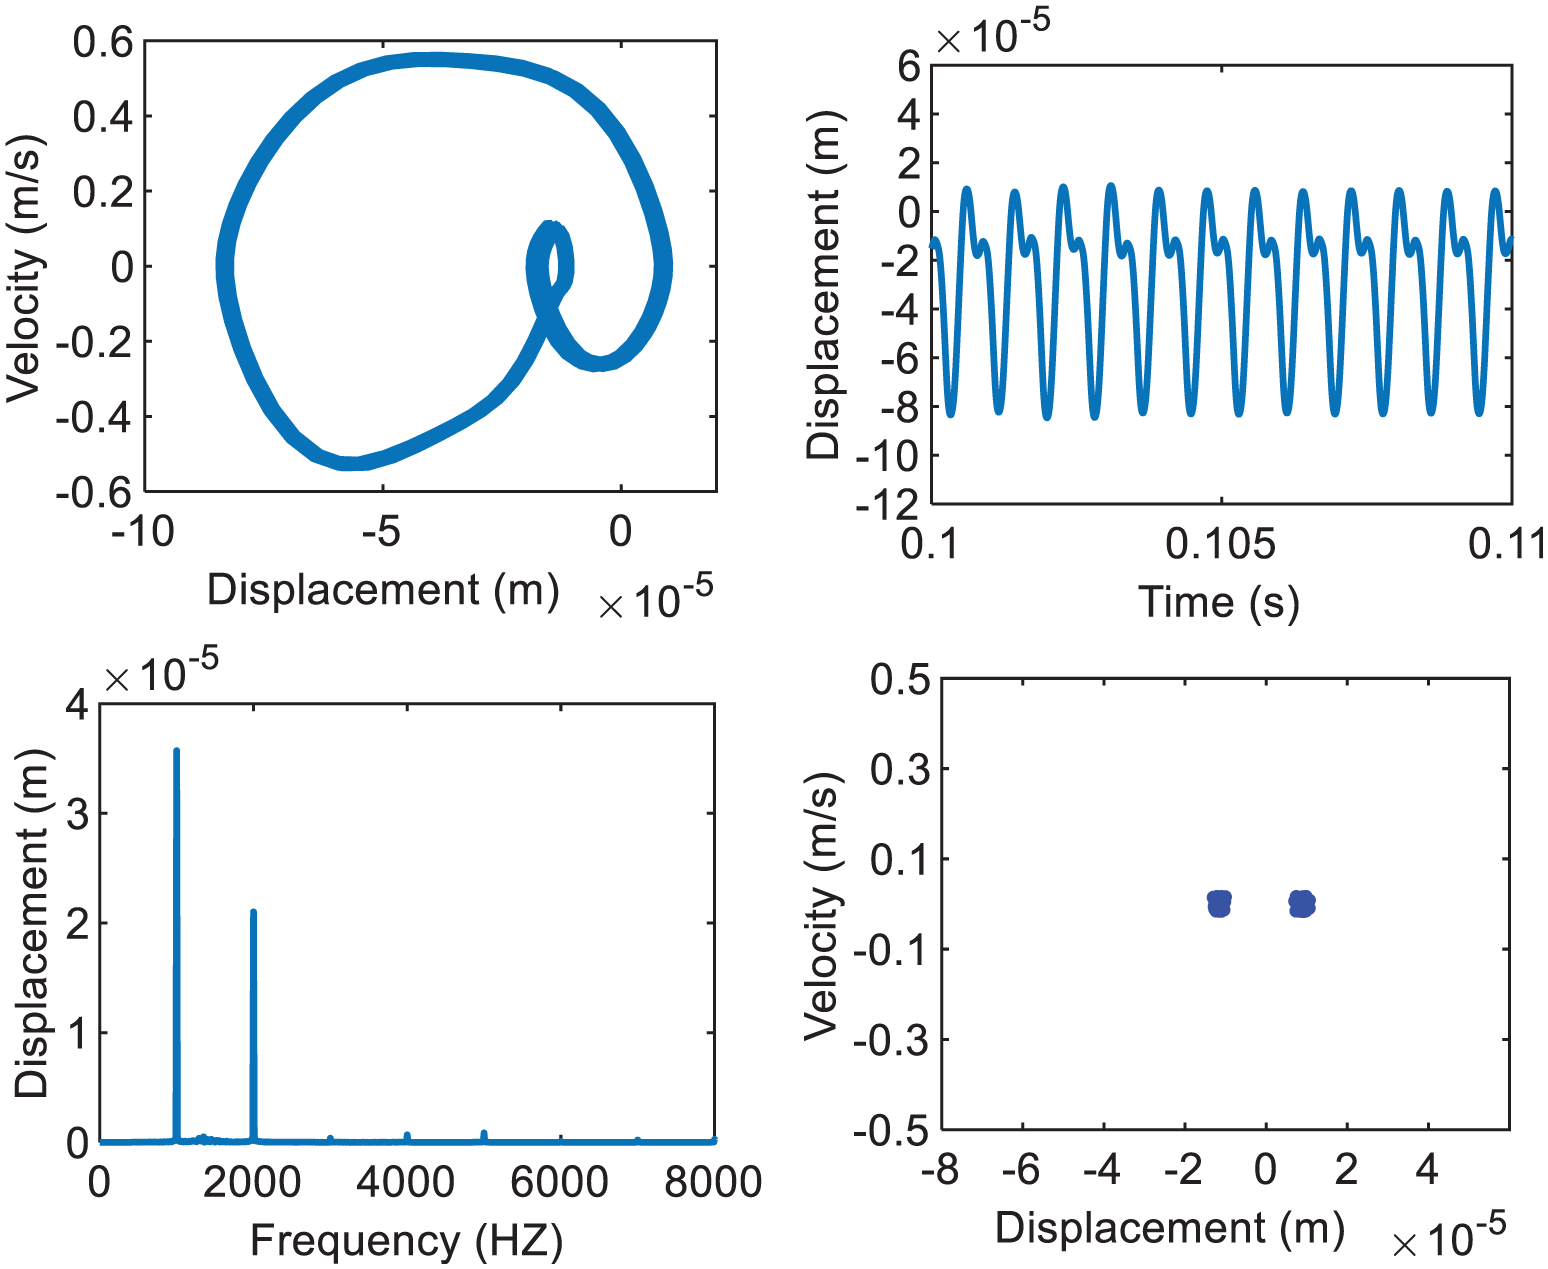
System response diagram when Ra = 0.8 μm.
When the tooth roughness R a is 1.2 μm, Figure 11 shows the phase plane diagram, Poincare diagram, time-domain response diagram, and amplitude-frequency diagram of the system. The phase plane diagram’s track signifies a closed curve with semicircles at this period, and the Poincare diagram correlates to a discrete immobile point. The time-domain response diagram shows a distinct periodicity, but the amplitude-frequency diagram reveals discrete and only contains harmonic frequencies 1 and 2, signifying that the system is still in motion during this time with period 1. The vibration displacement amplitude is greater at this time than at R a of 0.2 μm, as can be seen from the time-domain response graphic.
Figure 12 illuminates the phase plane diagram, Poincare diagram, time-domain response diagram, and spectrum diagram of the system when the tooth surface roughness R a is 1.6 μm. At this time, the phase plane diagram of the system is shown as a set of closed curve bands with a certain width, and the phase plane diagram and the time domain response diagram of the system are more complicated compared with that of the tooth surface roughness Ra = 0.8 μm. The Poincare diagram corresponds to four sets of finite point sets, and it can be seen that the finite point sets in the Poincare diagram of the system cover a larger area and more discrete points than those at the tooth surface roughness Ra = 0.8 μm. In the spectrum diagram, it can be seen that the system has significant vibration at the engagement frequencies of 420, 1020, 1430, and 2000 HZ. It can be inferred from the above results that the system is in the state of quasi-periodic motion at this time, but with the increase of tooth surface roughness, the chaotic attractor gradually increases, and the periodicity of the system gradually decreases.

System response diagram when Ra = 1.6 μm.
As can be seen from Figure 13, the phase plane diagram and time-domain response diagram of the system are disordered and non-periodic at a tooth surface roughness R a of 1.8 μm, with irregularly distributed discrete points on the Poincare diagram, and the spectrum diagram is continuous, indicating that the system is chaotic at this period.

System response diagram when Ra = 1.8 μm.
Figure 14 shows the phase plane diagram, Poincare diagram, time domain response diagram, and frequency spectrum of the system at Ra = 2.6 μm. At this time, the phase plane diagram of the system is shown as a set of closed curve bands with a certain width, and the Poincare diagram corresponds to a finite set of 3 points. It can be seen that the finite point set covers a larger area and has more discrete points than when the tooth surface roughness Ra = 1.6 μm. From the above characteristics, it can be inferred that the system is in a state of quasi-periodic motion at this time.

System response diagram when Ra = 2.6 μm.
As seen in Figure 15, the system’s phase plane diagram and time-domain response diagram are disordered and non-periodic at a tooth surface roughness R a of 2.8 μm, with irregularly distributed discrete points on the Poincare diagram, and the spectrum diagram is continuous. From the above characteristics, it can be inferred that the system enters chaotic motion again when the tooth surface roughness Ra = 2.8 μm.

System response diagram when Ra = 2.8 μm.
According to the above analysis, the dynamic stability of the crossed beveloid gears is closely related to the tooth surface roughness, and the larger the value of tooth surface roughness, the worse the dynamic stability of the system under a certain working speed. However, in the practical application of a beveloid gear transmission system, the actual working condition is often non-constant speed drive. Therefore, it is necessary to study the influence of tooth surface roughness on the system’s dynamic characteristics at different speed conditions.
Figure 16 shows the system bifurcation diagrams of the crossed beveloid gear pairs with work speed for tooth surface roughness of 0.2, 0.8, 1.6, and 2.6 μm, respectively. At the tooth surface roughness Ra = 0.2 μm, the system continuously maintains a stable periodic motion for the rotational speed of <2700 rpm. After that, as the work speed increases, the system appears to have times-periodic motion until the work speed increases to about 2900 rpm, when the system seems to have chaotic motion. As the work speed increases further, the system leaves the chaotic region and changes from multi-periodic movement to single-periodic simple harmonic motion. A comparative analysis of Figure 16(a)–(d) shows that the vibration displacement of the system increases with the increase of tooth surface roughness R a , and the bifurcation diagram of the system with the change of work speed gradually shows a rich nonlinear phenomenon. When the tooth surface roughness is <0.8 microns, the system’s dynamic characteristics are relatively stable.

Bifurcation diagram of the system with work speed. (a) 0.2 μm, (b) 0.8 μm, (c) 1.6 μm, (d) 2.6 μm.
In order to more clearly analyze the influence of tooth surface roughness on the dynamic response of crossed beveloid gear transmission system at different work speeds, this paper selects the tooth surface roughness of 0.2, 0.8, 1.6, and 2.6 μm, and the work speeds of 1000, 2500, and 4000 rpm, respectively, and the dynamic response of crossed beveloid gear transmission system in the phase plane diagram, Poincare diagram, time-domain response diagram, and spectrum diagram.
Figure 17 shows the phase plane diagram, Poincare diagram, time-domain response diagram, and spectrum diagram of the crossed beveloid gear pairs with the tooth surface roughness Ra = 0.2 μm and work speeds of 1000, 2500 and, 4000 rpm, respectively. As shown in Figure 17, the dynamic characteristics of the system gradually stabilize with the increase of the work speed. At the work speed of 1000 rpm, the phase plane diagram trajectory of the system wraps around three closed circles, and the Poincare diagram corresponds to three discrete points, and the above results show that the motion state of the system is period three motion at this time.

Dynamic response at different work speeds for Ra = 0.2 μm. (a) n = 1000 rpm, (b) n = 2500 rpm, (c) n = 4000 rpm.
Figure 18 shows the phase plane diagram, Poincare diagram, time-domain response diagram, and spectrum diagram of the crossed beveloid gear pairs with the tooth surface roughness Ra = 0.8 μm and work speeds of 1000, 2500, and 4000 rpm, respectively. It is not difficult to find that when the tooth surface roughness Ra = 0.8 μm, the trend of the system’s dynamic characteristics with the operating speed is approximately the same as that when Ra = 0.2 μm, that is, the dynamic features of the system gradually stabilize with the increase of the operating speed. At the work speed of 1000 rpm, the phase plane diagram trajectory of the system is shown as a band of curves with a certain width wrapped around three closed circles, the Poincare diagram corresponds to three sets of finite point sets, and the time-domain response diagram shows that the system still has a certain periodicity at this time. In the spectrum diagram, it can be seen that the system has evident vibration at the work frequencies of 980, 1960, 3010, 3960, and 5010 HZ, and the above results indicate that the motion state of the system is still in cycle three motion at this time. When the work speed increases to 4000 rpm, the phase plane diagram trajectory is a single circle closed curve, the Poincare diagram corresponds to a discrete immobile point, the time domain response diagram shows a simple harmonic, and the spectrum diagram only has a single peak amplitude, the above results indicate that the system is still in a single-cycle simple harmonic motion. However, compared to the tooth surface roughness Ra = 0.2 μm, the phase plane diagram of the system at this time shows significant fluctuations, indicating that the periodicity of the system motion becomes worse as the tooth surface roughness increases.

Dynamic response at different work speeds for Ra = 0.8 μm. (a) n = 1000 rpm, (b) n = 2500 rpm, (c) n = 4000 rpm.
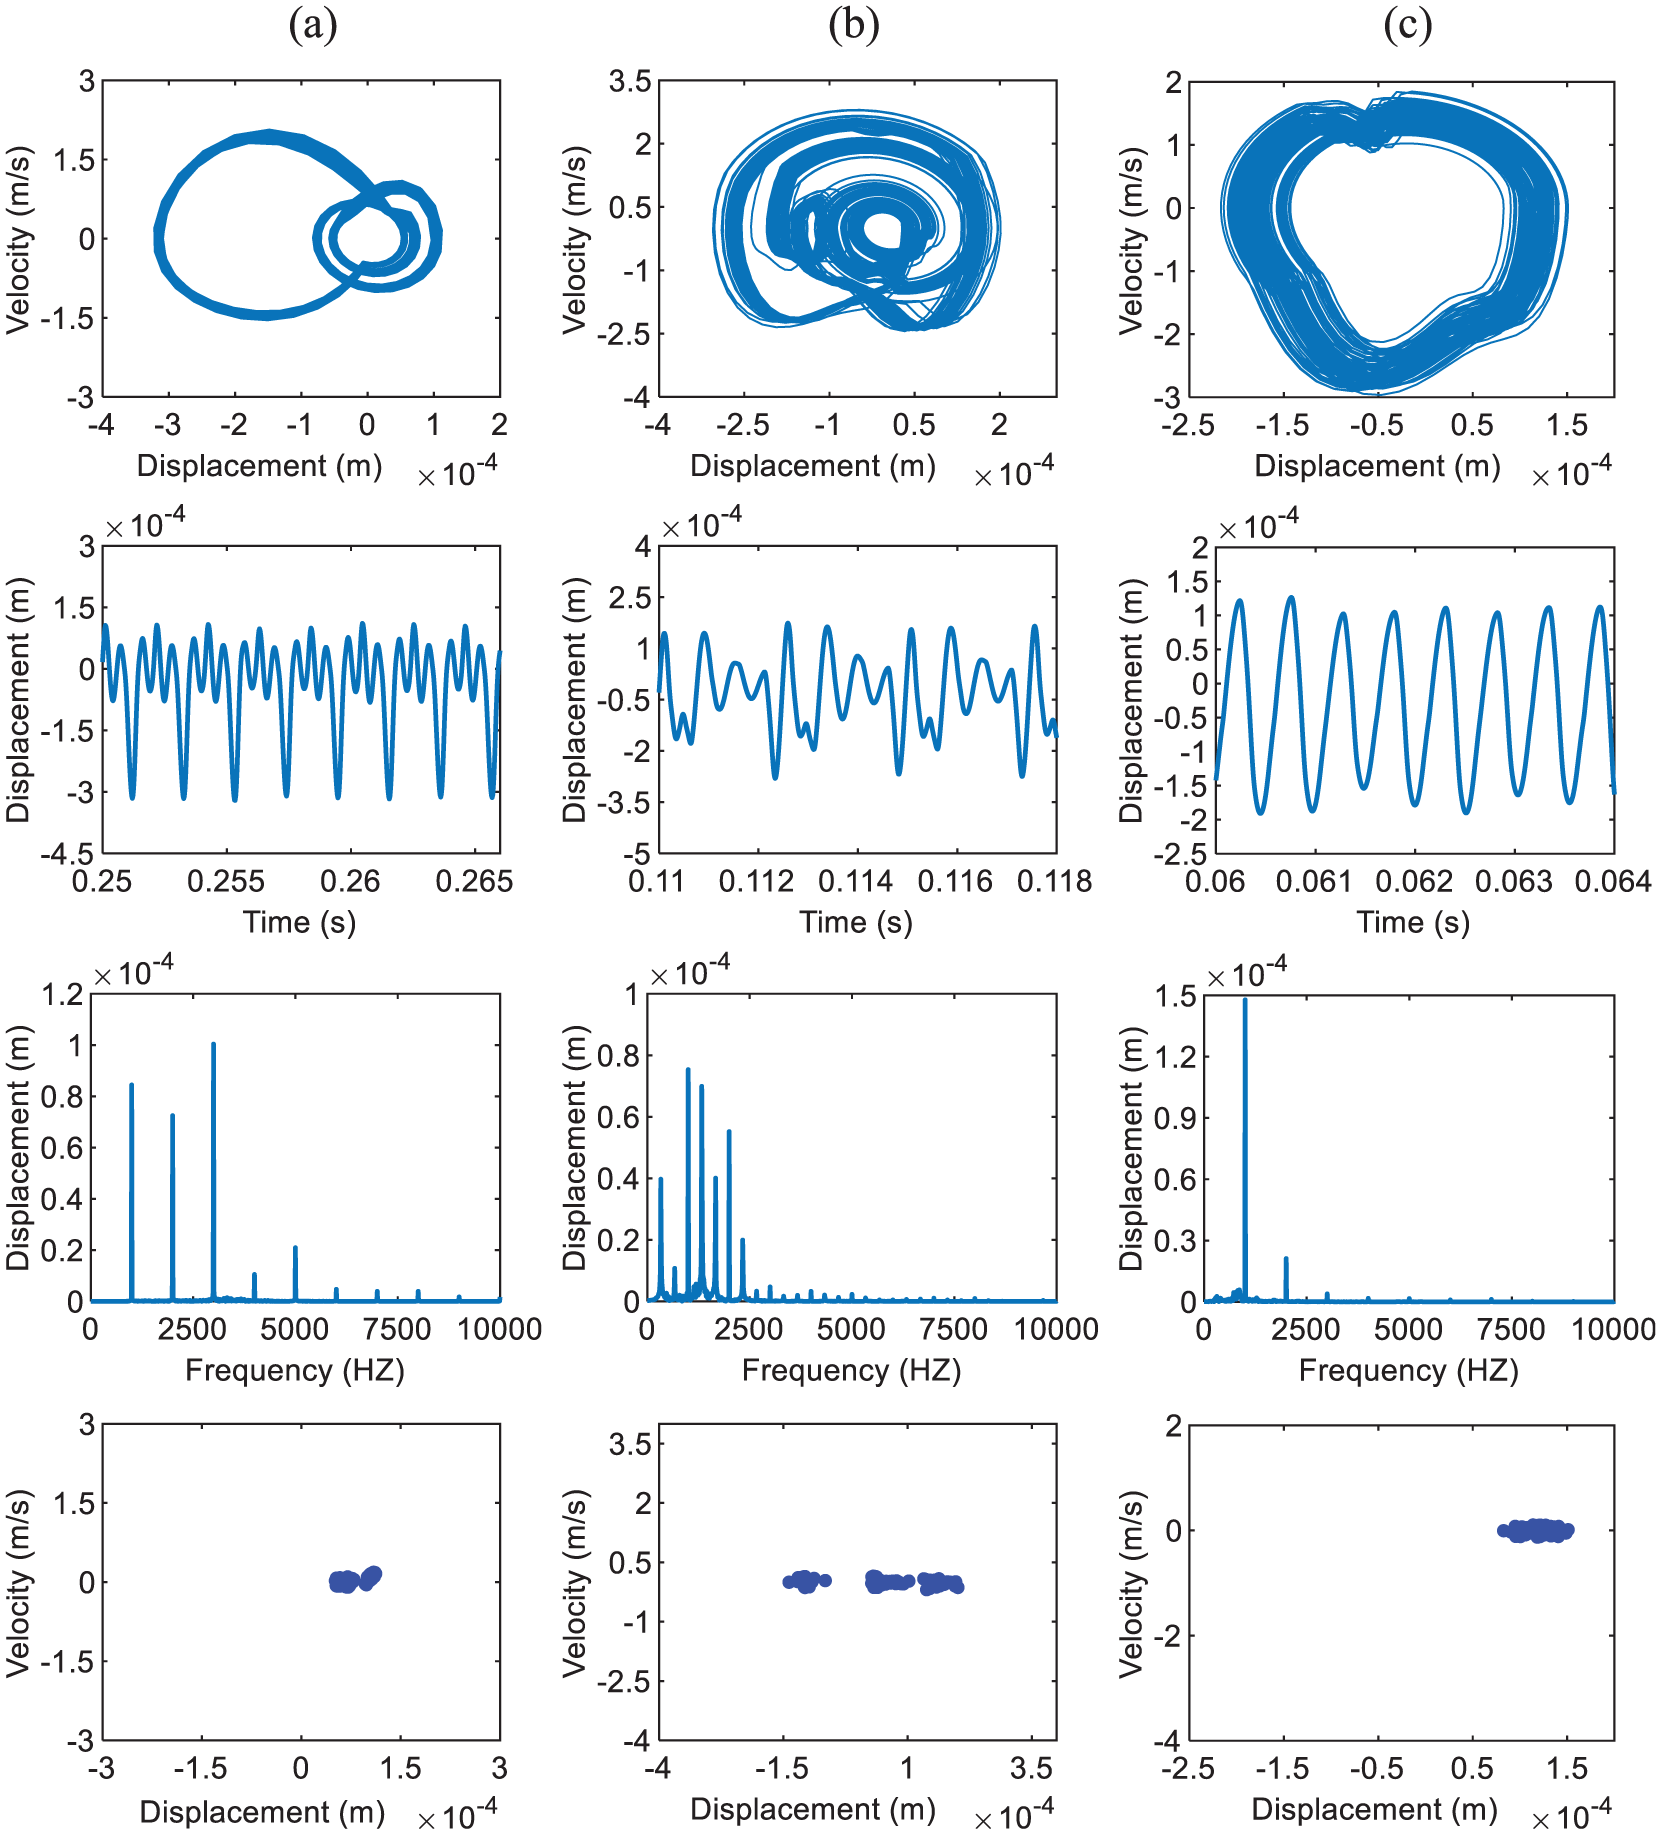
Figure 19 shows the phase plane diagram, Poincare diagram, time-domain response diagram, and spectrum diagram of the crossed beveloid gear pairs with the tooth surface roughness Ra = 1.6 μm and work speeds of 1000, 2500, and 4000 rpm, respectively. From the figure, it can be seen that at the rate of 1000 rpm, the phase plane diagram is chaotic and disorderly, the time domain response diagram shows non-periodicity, the Poincare diagram is irregularly distributed discrete points, and the spectrum diagram is continuous, the above characteristics indicate that the system is in a chaotic motion. As the work speed continues to increase, when the speed increases to 2500 rpm, the phase plane diagram of the system behaves as a set of closed curve bands with a certain width. Compared with Ra = 0.8 μm, the phase plane diagram and time domain response diagram of the system are more complex, the Poincare diagram corresponds to four sets of finite point sets, and the spectrum diagram shows that the system engages at the frequency of 420, 1020, 1430, and 2000 HZ with significant vibration. It can be inferred from the above results that the chaotic attractor of the system decreases as the operating speed increases, and the system gradually changes from chaotic motion to quasi-periodic motion. When the speed increases to 4000 rpm, the phase plane diagram trajectory of the system is a single circle closed and has a certain width of the curve band, the time domain response diagram of the system is still a set of simple harmonics, but compared to Ra = 0.2 μm, the periodicity of the system becomes significantly weaker at this time.

Dynamic response at different work speeds for Ra = 1.6 μm. (a) n = 1000 rpm, (b) n = 2500 rpm, (c) n = 4000 rpm.
Figure 20 shows the phase plane diagram, Poincare diagram, time-domain response diagram, and spectrum diagram of the crossed beveloid gear pairs with the tooth surface roughness Ra = 2.6 μm and work speeds of 1000, 2500, and 4000 rpm, respectively. As can be seen in Figure 20, the system is still in chaotic motion when the work speed is 1000 rpm. When the work speed increases to 2500 rpm, the phase plane diagram shows a set of closed curve bands with a certain width, but the phase plane diagram and the system’s time domain response diagram are more complicated than that of Ra = 1.6 μm. The Poincare diagram of the system corresponds to three sets of finite point sets, which cover a larger area and have more discrete points than when the tooth surface roughness Ra = 1.6 μm. It can be inferred from the above characteristics that the system is still in quasi-periodic motion. When the operating speed increases to 4000 rpm, the trajectory of the phase plane diagram is a single circle closed and has a certain width of curve band, the time domain response diagram of the system is still a set of simple harmonics at this time, but compared with the tooth surface roughness Ra = 1.6 μm, the periodicity of the time domain response diagram of the system is weaker at this time, and it can be seen in the phase plane diagram that the width of the curve band increases significantly at the tooth surface roughness Ra = 2.6 μm, which indicates that the dynamic stability of the system decreases as the tooth surface roughness increases.
Dynamic response at different work speeds for Ra = 2.6 μm. (a) n = 1000 rpm, (b) n = 2500 rpm, (c) n = 4000 rpm.
Model validation
Establish a test platform for the dynamic characteristics of an interlocking axis involute thickened gear transmission system to test the impact of thickened gear pairs with different processing accuracies on the vibration of small-angle marine gearboxes during transmission. The system schematic diagram of the test platform for the dynamic characteristics of helical gears with thickened teeth is shown in Figure 21. The test platform features a variable-frequency speed control motor with model number YE3VF, rated at 3000 rpm. The DWZ-250 eddy current brake is used for loading, with a rated torque of 1100 Nm and a rated speed of 2000–2600 rpm. The drive end and load end of the system are equipped with DYN-200 dynamic torque speed sensors, with rated torques of 400 and 1000 Nm, respectively. In order to accurately measure the vibration patterns of interlocking-axis thickened gear pairs with different machining accuracies, this test bench uses a three-axis acceleration sensor to measure the vibration signals of the thickened gears on the output shaft. The three-dimensional structure of the test platform is shown in Figure 22. The specific scenario of the gear dynamics characteristic test experiment is shown in Figure 23.

Schematic diagram of the vibration test benchmark.
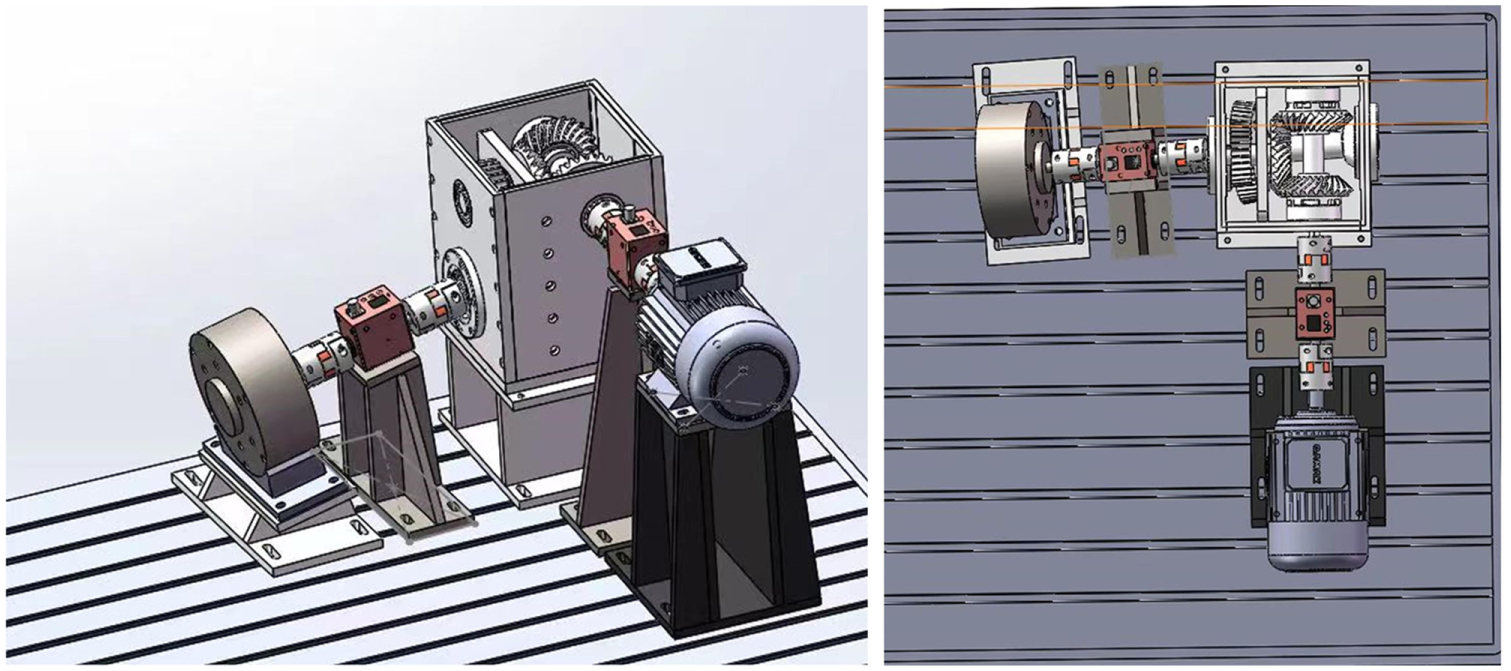
The test benchmark construction diagram.
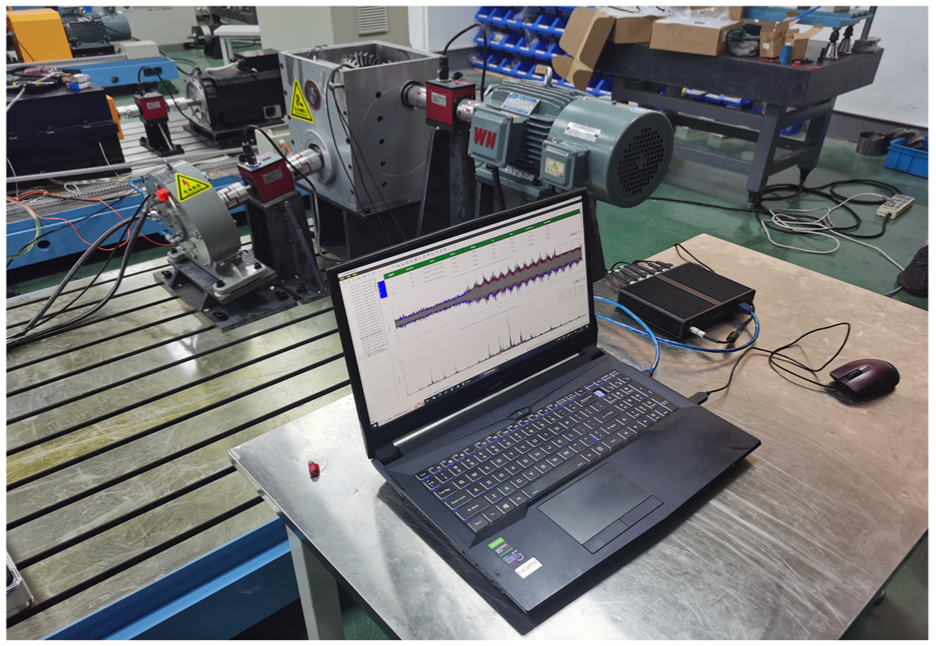
The dynamics testing benchmark for crossed beveloid gears.
The structural parameters of the experimental involute thickened gear pair are consistent with those in Table 2. The thickened gear test samples were processed using two methods: gear hobbing and gear grinding. The roughness values of the tooth surface morphology measured by the white light interferometer were Ra = 0.57 and 1.13 μm, respectively. The test results of the tooth surface morphology characteristics are shown in Figure 24.

Roughness measurements for the beveloid gear of different accuracy.
The test load torque was 400 Nm, and the operating speed was 1000 rpm. The vibration signals of the driven thickened gear were measured, and the vibration components related to the meshing frequency and its multiples were extracted and compared with the theoretical analysis results. Figures 25 to 28 show the results of the dynamic analysis and vibration tests of the lateral vibration displacement of the driven thickened gear under different tooth surface accuracies.
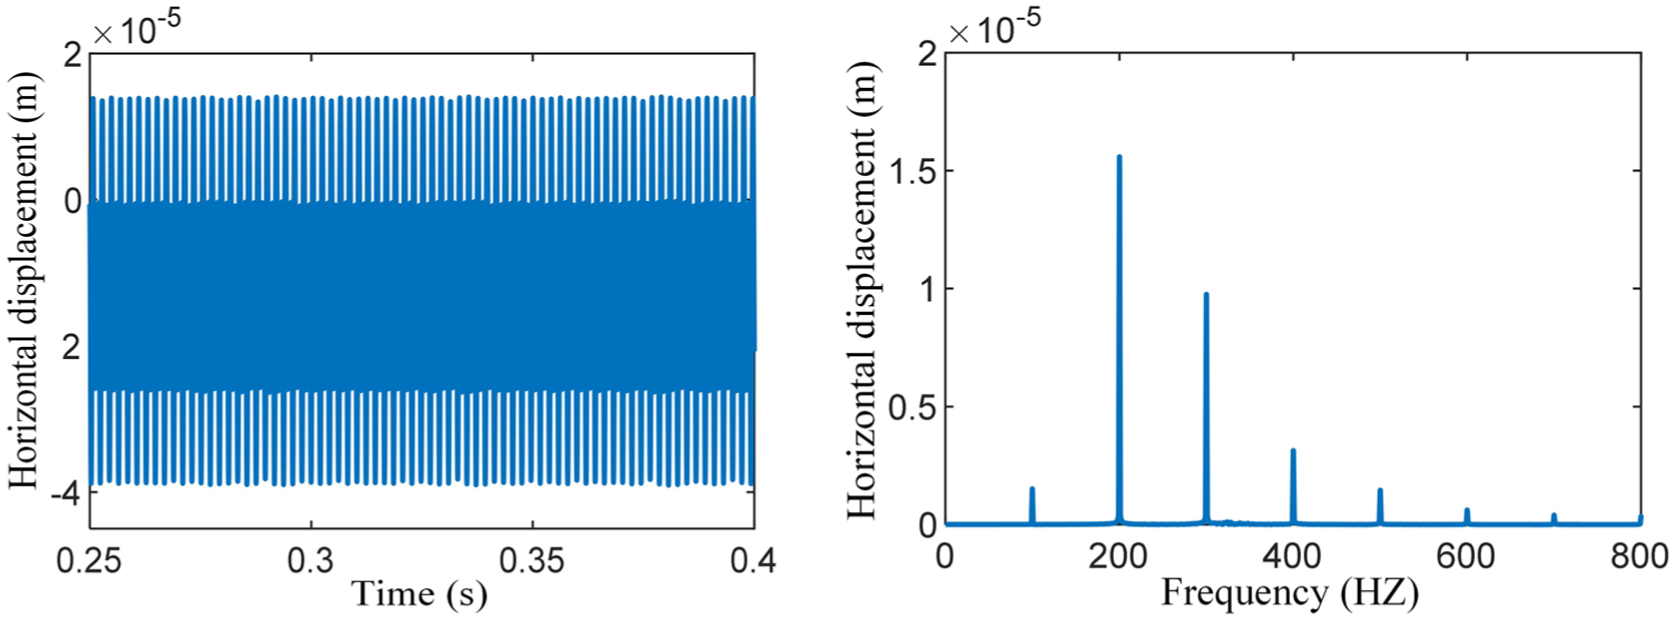
Simulation results of system lateral vibration displacement at Ra = 0.57.
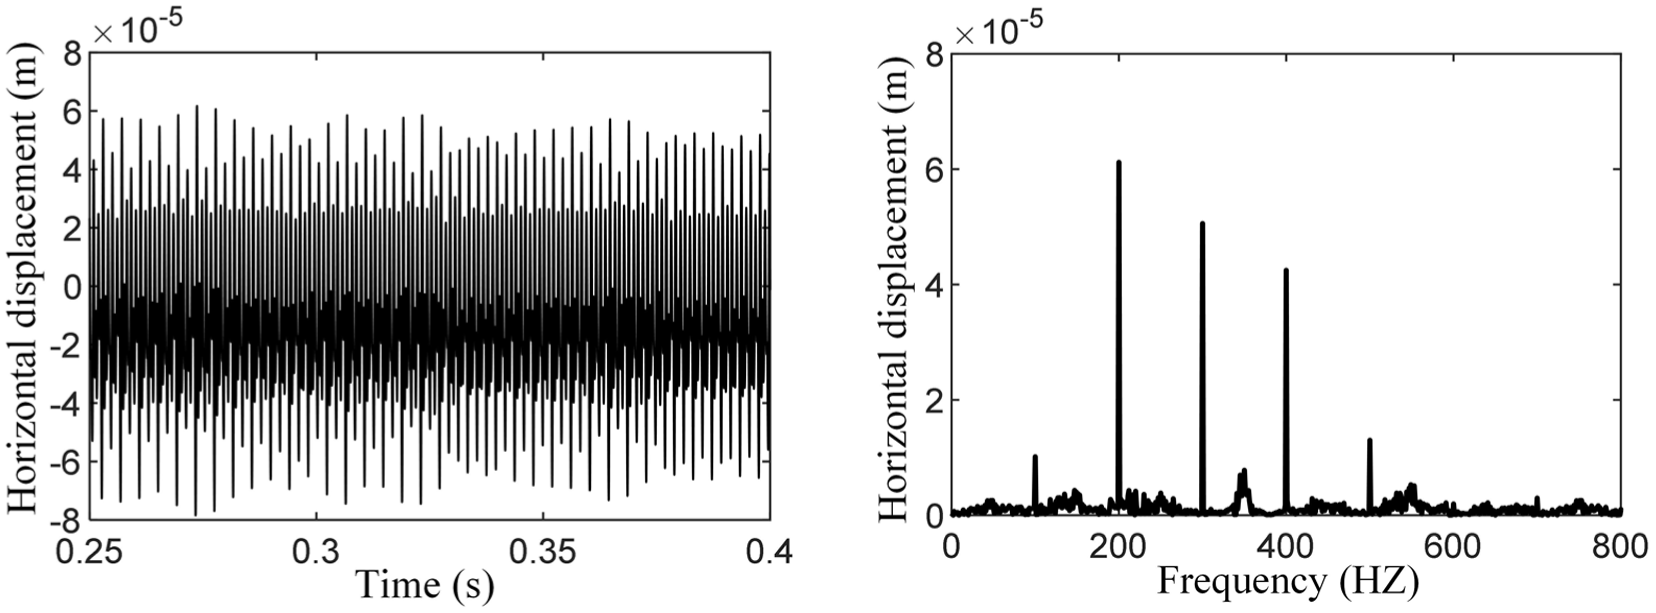
Experiment results of system lateral vibration displacement at Ra = 0.57.
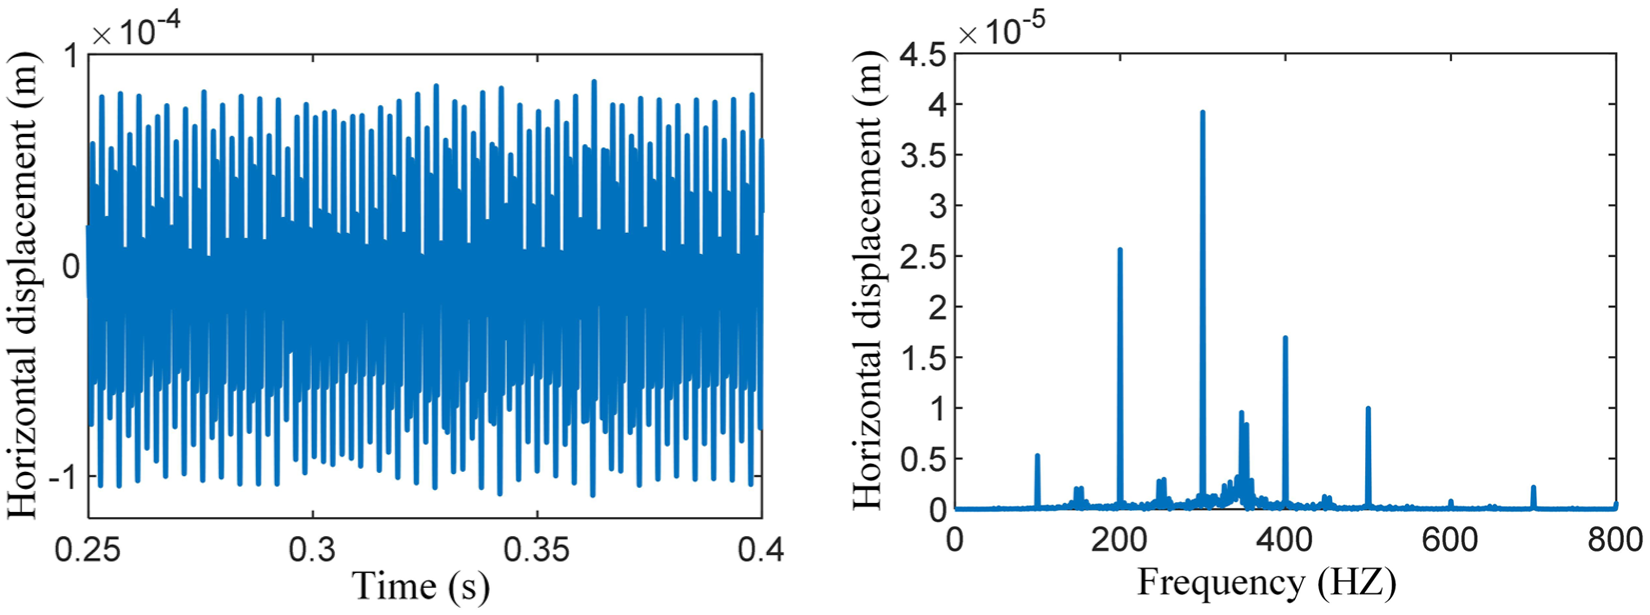
Simulation results of system lateral vibration displacement at Ra = 1.13.

Experiment results of system lateral vibration displacement at Ra = 1.13.
As can be seen from the above figure, the system vibration displacement in the test results corresponds well with the results of the dynamic analysis, thereby verifying the accuracy of the dynamic model proposed in this paper. In addition, the dynamic analysis model described in this paper simplifies the description of the support structure to a certain extent. Furthermore, the parameters describing the test bench bearing support and torsional stiffness are based on empirical values, which is also one of the reasons for the deviation between the analysis results and the test results.
Conclusion
The effects of tooth surface roughness and time-varying friction on the dynamic responses of crossed beveloid gear pairs are indeed the focus of this research. In this paper, the nonlinear phenomena of the dynamics system were investigated, and the following results were managed to reach:
In this study, the mathematical model of gear surface roughness was formulated utilizing fractal theory, and combined with the force analysis of crossed beveloid gear pairs, the lumped parameter method has been used to demonstrate the multi-degree-of-freedom nonlinear dynamic model of crossed beveloid gear transmission system considering tooth surface roughness and time-varying friction, and the mathematical relationship between tooth surface micro-parameters and gear dynamic was established.
Using the adaptive step length Runge–Kutta method to solve the differential equations of the dynamic systems, the bifurcation diagram of the system under different tooth surface roughness was derived with support stiffness, support damping, and external load as control parameters, and the nonlinear phenomena of the system were interpreted using the phase plane diagram, Poincare diagram, time-domain response diagram, and spectrum diagram. The results demonstrated that contact tooth surface roughness and time-varying friction are strongly connected to dynamic characteristics between mating gear pairs. As the tooth surface roughness develops, the system’s motion state takes on a variety of response modes, encompassing single-period, multi-period, quasi-period, bifurcation, and chaos.
The surface roughness of the gear seems to have a direct relationship with its dynamic stability. At a certain work speed, the larger the value of tooth surface roughness, the worse the dynamic stability of the transmission system. For the work speed not higher than 3000 rpm, when the value of tooth surface roughness is <0.8 µm, the crossed beveloid gear transmission system can ensure good dynamic stability.
Footnotes
Handling Editor: Chenhui Liang
Funding
The authors disclosed receipt of the following financial support for the research, authorship, and/or publication of this article: The research is supported by Heilongjiang Province’s key technology project: “Leading the Charge with Open Competition” (grant no. 2023ZXJ04A02).
Declaration of conflicting interests
The authors declared no potential conflicts of interest with respect to the research, authorship, and/or publication of this article.
Data availability statement
The data that support the findings of this study are available from the author, Hancheng Mao, upon reasonable request.