
Abstract
Manufacturing industries are substituting or replacing the existing monolithic materials with advanced materials because of their high strength-to-weight ratio. To achieve this, researches are focused on developing composite materials incorporating various types of reinforcements that can be utilized in diverse application. However, the machining process of metal matrix composites using end milling operations is challenging due to the presence of hard and abrasive reinforcements resulting in rapid tool wear and poor surface finish. This necessitates the optimization of machining parameters to achieve superior surface finish, minimal tool wear, and maximum material removal rate. In this study, an AA7475 reinforced with
Keywords
Introduction
Conventional monolithic materials have been confined to attaining a good combination of strength, stiffness, toughness, and ductility. To overwhelm these deficiencies and meet the ever-increasing property demands, conventional monolithic materials are replaced by the most promising alternative materials called composites. Pure aluminum and its alloys are the primary requirements in transportation, aerospace, and various structural applications due to its versatile properties.1–3 Aluminum has the property of ductility, is malleable, and can be altered into different shapes simply. 4 The requirement for further improvement of its properties has led to the emergence of new technologies for the fabrication of aluminum-based metal matrix composites. The hardness and strength increase substantially while reducing the ductility and plasticity in Aluminum metal matrix composites (AMMC). 5
The manufacturing process of the metal matrix composite mainly depends on reinforcement informality, quality, and matrix metals. Based on the reinforcement materials MMCs can be fabricated by powder metallurgy, diffusion bonding, impregnation process, stir casting, 3D printing, and friction stir process.6–8 The incorporation of ceramic reinforcements (such as Al2O3, SiC, B4C) into aluminum matrices via techniques like stir casting, powder metallurgy, or FSP has been extensively studied to enhance mechanical properties.9,10 The properties of the fabricated AMMC vary with the variation of matrix materials and the methods of fabrication along with the parameters used. In an experimental study by Reddy et al., 11 by their study revealed that adding ceramic reinforcements to AA7475 improves its thermal and mechanical properties. Optimal graphite content (up to 9%) enhances tensile strength and hardness, while excess disrupts matrix continuity, reducing performance. 12
The reinforcements can promote grain refinement in the matrix which enhances the hardness due to Hall-petch effect. Reddy et al. 13 evaluated the microstructure and mechanical properties of composites fabricated by reinforcing graphite at various concentrations of 3, 6, 9, and 12 wt% and coconut shell ash at a constant weight of 10% into AA7475 developed by stir casting. The results showed that the addition of the reinforcements enhanced the tensile strength and hardness with the higher concentration. The uniform distribution of reinforcements into AA7475 is observed from the SEM image. The increase in temperature and duration increases the molecular bond strength between reinforcements. 14
In an experimental study done by Boopathi et al. 15 friction stir processing method is employed in the fabrication of aluminum alloy-based B4C reinforced surface composite. The volumetric concentration, rotational speed, and travel speed are varied for the evaluation of the composite in terms of tensile strength and wear. Tool travel speed of 40 mm/min, tool rotational speed of 1400 rpm, and 15% of B4C resulted in the highest value of 347 MPa in tensile strength and a minimum of 55 µm in wear. Friction stir processing is employed in the fabrication of aluminum-based surface composite with better improvement and least defects. 16
Apparao et al.
17
conducted a machining study on AA7075-SiC-Al2O3 composites to assess tool wear and material removal rate, optimizing spindle speed, feed rate, and depth of cut using Response Surface Methodology. Results showed minimal tool wear at 1000 rpm, 0.02 mm/rev, and 1 mm cut depth, while maximum MRR occurred at 1838 rpm, 0.04 mm/rev, and 1.81 mm cut. To evaluate surface roughness, Bhuvanesh Kumar et al.
18
were done machining of AA7075-Zr
The literature indicates that there are significantly fewer studies on the characterization and machinability of AA7475 reinforced with nanoparticles. In this study, hybrid Al2O3-TiO2 nanoparticles are reinforced into AA 7475 alloy in order to explore the hardness of the composite. Most research focuses on the fabrication but overlooks post-processing steps of hybrid composites, leading to tool wear and surface integrity issues. The optimum process parameters for the fabrication and machining of AA7475-Al2O3-TiO2 composite were identified using the Taguchi method and Grey Relational Analysis (GRA). The characterization was done to assess the input parameters of the Friction Stir Process (FSP) on the hardness. Furthermore, the machining was done to achieve an improved surface finish, enhanced material removal rate, and reduced tool wear during the end milling of the AA7475-Al2O3-TiO2 composite. The effect of the hybrid Al2O3 and TiO2 reinforcement with the AA7475 for matrix fabrication through friction stir process with the milling parameters on the matric is focused in this study.
Materials and methods
Materials
Composite materials
This experimental work utilizes AA7475 rolled alloy as the base metal, while the reinforcement materials are nano
Chemical composition of AA7475 plate.

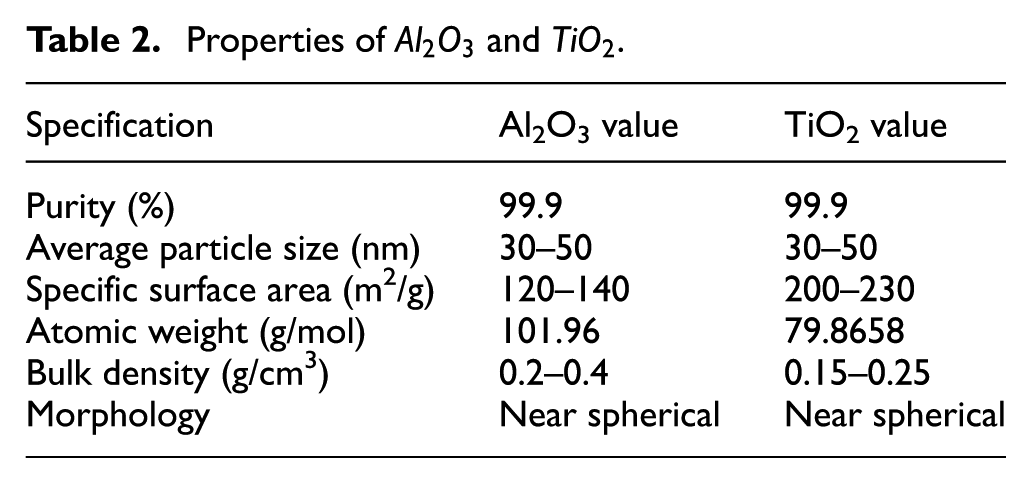
Properties of
Tool and equipment
The alloy AA7475 undergoes heat treatment. Initially, the alloy is made as a plate. Then, to improve mechanical properties and refine the microstructure, the Friction Stir Processing (FSP) method is used, which entails plastic deformation and localized heating. This can be utilized to improve its strength and other characteristics. The experimental setup involved several equipment for different tasks. A DMTG CNC machine was used for preparing the workpiece, fabricating composite materials, and performing end milling operations. A lathe machine was employed to fabricate the friction stir tool. Surface roughness was measured using a Zeta Optical Microscope, while composite hardness was assessed with a Vickers hardness tester. An electronic weighing machine was used to measure weight loss during the wear test.
FSP tool
The tool used in this work is H13 and it is a type of steel alloy that is commonly used in the manufacturing of cutting tools due to its high strength, toughness, and resistance to heat and wear. Cutting tools made from H13 steel are known for their ability to maintain their shape and cutting edge even when subjected to high temperatures and heavy loads. 25 The FSP tool used has three components namely shank, shoulder, and pin. 26 Figure 1 shows the nomenclature of the FSP tool.
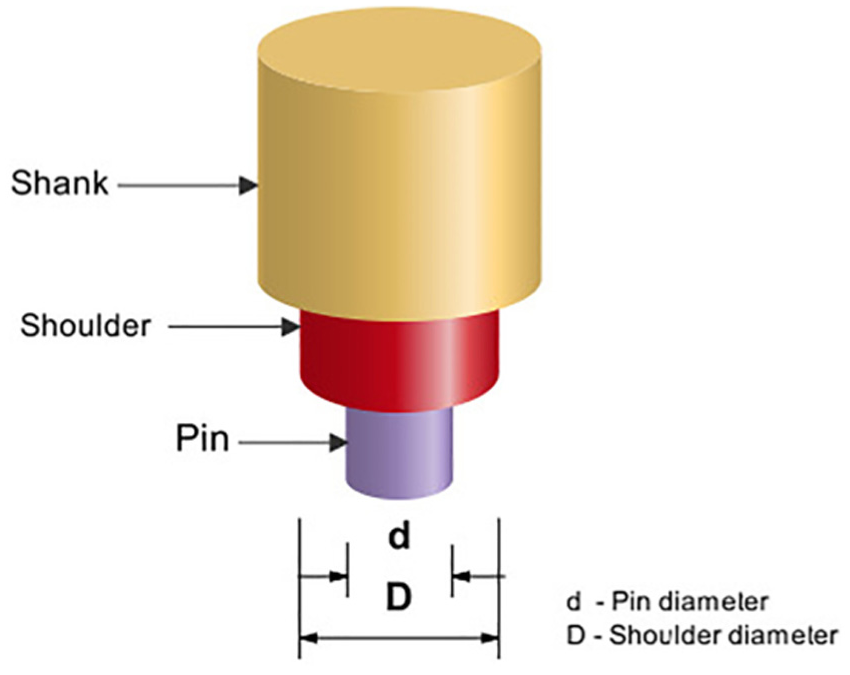
Nomenclature of a straight cylindrical pin of friction stir processing tool. 26
The shape and the design of a tool have a significant influence on the amount of heat produced, the force required to move the tool, and the flow of the melted material in the work. 26 Table 3 shows the specification of the FSP tool used in this experimental work. The selection of the parameters is based on the amount of reinforcements. The flat face of the shoulder removes material scattering during the process.
Friction stir processsing tool geometry.

Methods
Experimental design
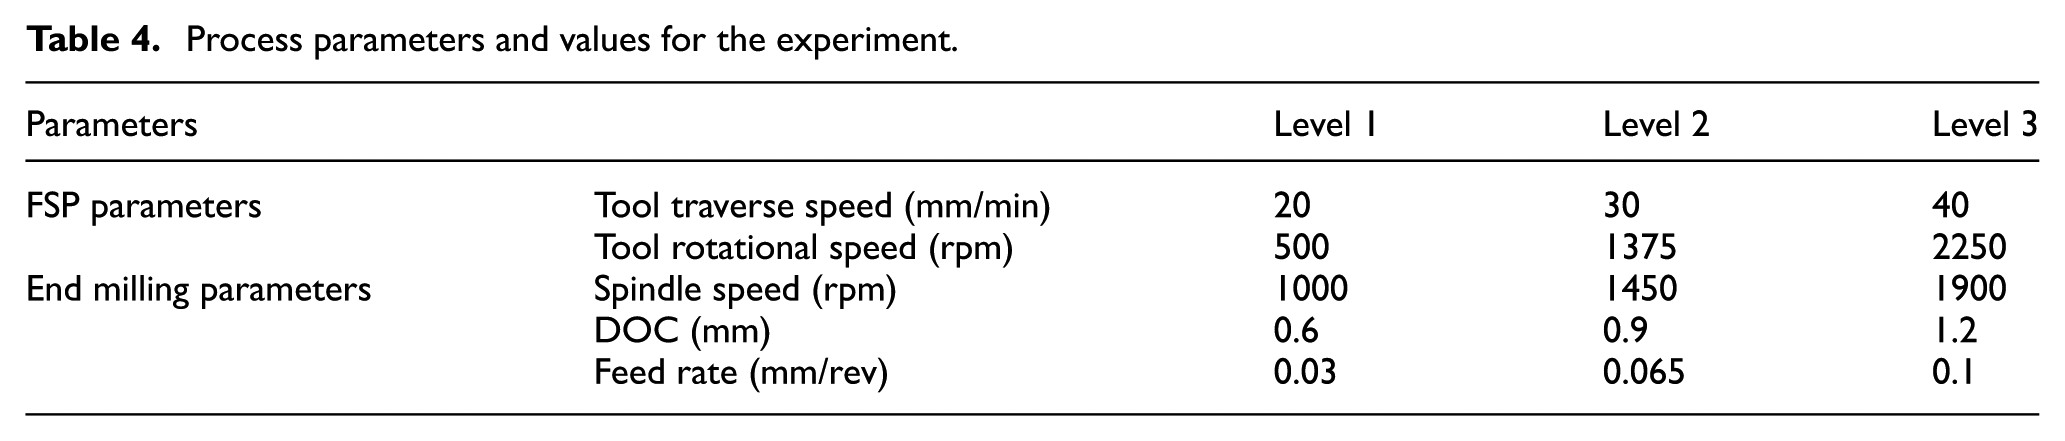
The experiment in this work is done based on Taguchi’s design of experiment. Taguchi’s design of the experiment is a standardized tool for deciding the number of experimental runs. 18 The input variables of the Design of the experiment (DOE) are rotational speed and transverse speed with three levels for friction stir processing. Furthermore, spindle speed, feed, and depth of cut with three levels for end milling are considered based on the related works performed. Based on the input parameters L27 orthogonal array has been utilized for DOE to analyze the effect of input parameters on the Ra, MRR, and tool wear. Table 4 presents all the process parameters and their respective levels selected for the experiment.
Process parameters and values for the experiment.
Experimental procedure
Friction stir processing (FSP) is employed in this experimental work for the preparation of the AA7475-based Al2O3-TiO2 hybrid reinforcement composite. The FSP is used for the fabrication of aluminum-based surface composite, which incorporates milling of the surface of the metal by rotating tool generating high heat. 27 This heat softens the material; with the rotation of the tool the materials are dispersed with the movement of the tool. Preparation of composite with reinforcement in FSP involves making of groove on the surface of the base metal. 28
The following procedures are utilized for the preparation of AA7475-Al2O3-TiO2 composite.
1. Cleaning of base metal: cleaning of the workpiece is crucial for maintaining quality in FSP. Acetone chemical is used for the cleaning of workpieces, which is used to remove plasticized residue that accumulates on the work during FSP. 29
2. Groove making: in order to fabricate surface composite using FSP, making a groove on the surface is the primary task. Groove is prepared on the surface of the plate for precise insertion of nanoparticles. 30 Among different grooving techniques, straight grooves are made for the uniform mixing of the reinforcement materials along the length of the work. 31 The groove dimensions depend on the amount of the reinforcement. 32 This relation is shown in equation (1).

For 20 volumetric percentage of reinforcement, 32 a groove with an area of 2.4 mm2 is made on the surface of the AA7475 plate. Two parallel grooves are made on a single plate with a similar volume.
3. Mixing of hybrid nanoparticles: the mixing of the equal ratio of the reinforcements is done by using high-energy ball milling. Figure 2 shows the mixed reinforcements dispersed in the prepared grooves.
4. Fabrication of the composite: AA7475-based hybrid reinforcement metal matrix composites are fabricated using the H-13 tool on a vertical-centered CNC milling machine by varying the FSP parameters. Table 5 presents the constant and variable parameters utilized for the friction stir processing. Inorder to achieve higher amount dispersion in the FSP zone 2 passes of the tool are siutable.33,34 To prevent the powders from scattering during the FSP, the groove surfaces were covered with a pinless tool before the processing. 26 Depending on the design of experiment nine composite samples are prepared by varying the process parameters.

AA7475 plate with Al2O3 and TiO2 powder before the FSP.
FSP parameters.

Machining responses
The machining process parameters significantly impact the surface finish of the machined composite material. To achieve a high-quality surface finish, it is crucial to optimize the cutting parameters. ZETA Surface Roughness Tester has been utilized for measuring the surface roughness of the machined composite. The average of three measured values at different locations is taken for the analysis.
The amount of materials removed is another criterion to measure the machining quality.17,19,20 For obtaining the material removal rate during the machining of the composite, the well-known formula presented in equation (2) has been used. 18

Where w is the width of a specimen in mm, D is the depth of cut in mm, d is the diameter of the milling cutter in mm, and t is the machining time in min.
Furthermore, machining quality is evaluated by tool wear during machining of composite fabricated by FSP.22,35 Tool wear (Vb) is an ongoing failure of cutting tools due to steady operation. It is also defined as the amount of material removed from the tool per machining time. Tool wear during machining has been obtained by the rate of the difference of cutting tool weight before machining and after machining as presented in equation (3). 36

Optimization technique
Taguchi’s orthogonal arrays are a type of highly efficient experimental design that focuses primarily on the estimation of main effects. In the Taguchi method, the variation in the responses is analyzed using the signal-to-noise (S/N) ratio, which provides insights into the process performance depending on the quality characteristics.37,38 The ANOVA is used also used and it is used by most researchers to identify the most significant factors affecting the responses and to determine the contribution of each factor. 39
The Grey Relational Analysis (GRA) is used with the orthogonal array to analyze the combined effect of the process parameters on multiple responses. The GRA is performed by following four main steps. 18 Normalization of the results found between zero and one followed by an absolute difference of the normalized value and grey relational coefficient. The last step is finding the average grey relational analysis.
The normalized values of the responses are calculated using the following Equations based on the performance characteristics. Equations (4) and (5) are used for finding normalized values for larger is better and smaller is better quality characteristics respectively.


Where,
From the normalized values, the absolute difference between each normalized value and the reference value

Where,
The grey relational coefficients (GRC) of the responses are then obtained using equation (7).

Where ξ is the distinguishing coefficient with the value in the range of 0 and 1. In this case, medium 0.5 is used for the calculation.
Grey relational grade (GRG) of the responses is calculated with the use of equation (8).

Where k is the number of replications
i is the number of responses
Results and discussions
Results on hardness of the composite
The hardness of the fabricated samples was evaluated using a Rockwell hardness tester. To ensure reliable and repeatable measurements, the hardness values were recorded at three distinct points on each sample, and an average value was calculated. The measurements were taken with a spacing of 1 mm from tangent to tangent, using a minor load of 10 kg and a major load of 60 kg, with a duration time of 15 s, in accordance with Rockwell hardness scale. Figure 3 presents the results of the hardness tests conducted on the Aluminum Metal Matrix Composites (AMMC) containing 20 wt% of nanoparticles, with varying tool rotational and traverse speeds.

Rockwell hardness.
Tool rotational and traverse speeds in Friction Stir Processing (FSP) significantly influence grain refinement and mechanical performance. Moderate increases in rotational speed enhance hardness up to 1375 rpm by generating sufficient frictional heat for dynamic recrystallization and better matrix-reinforcement bonding. However, excessive speeds reduce hardness due to reinforcement particle scattering, while higher traverse speeds promote finer grain structure. 40 Researchers, such as Natrayan, 12 have reported similar findings. The incorporation of the reinforcing ceramic particles into the matrix material enhanced the overall hardness of the composites. The maximum hardness of 112.46 HRF, achieved with 20% Nano-particles, was higher than that of the unreinforced aluminum alloy. It is 46.43% higher than the base plate of Al 7475. The hardness values increased with the addition of the reinforcement particles and by optimizing the tool traverse speed up to 1350 rpm. Further increases in the tool rotational speed, however, led to a decrease in the hardness values causing grain coarsening. 41
Machining results
Depending on the designed experiment, 27 experiments were done at different combinations of the process parameters on the prepared composite. Figure 4 depicts the machined composite materials of 27 experiments.
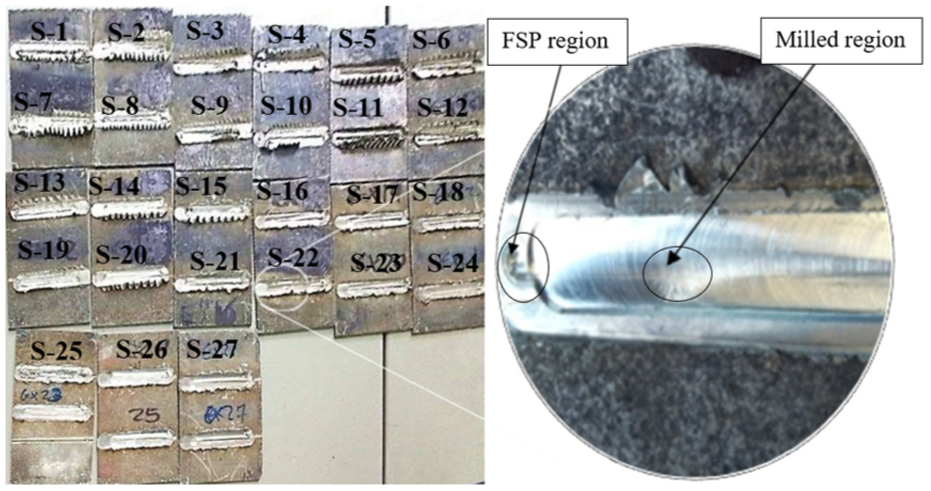
Workpiece after machining.
Table 6 shows the results obtained from the machining experiment in terms of surface roughness, tool wear, and MRR.
Experimental results of each experiment.

Analysis of surface roughness
S/N ratio of surface roughness
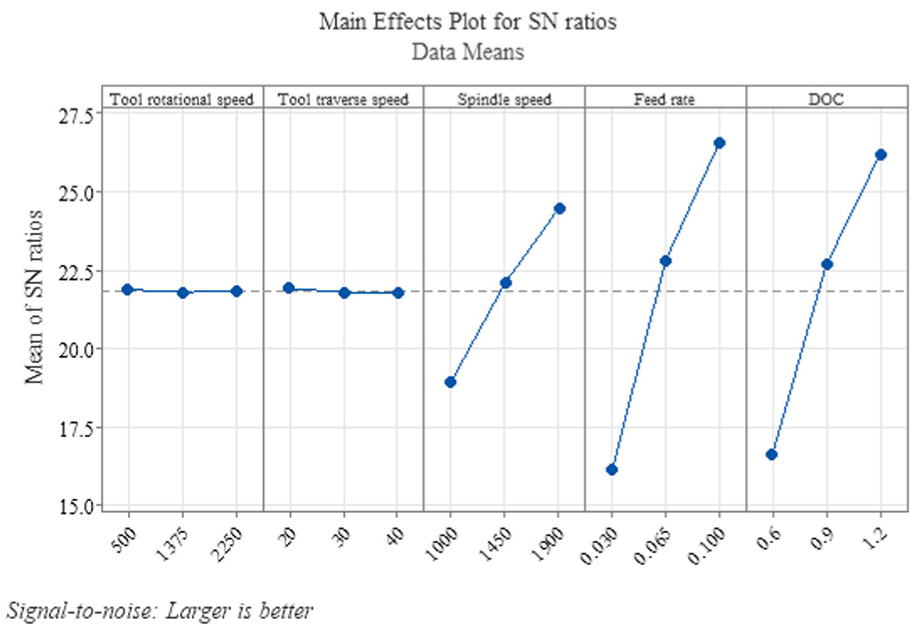
Figure 5 shows the graphical representation of the mean S/N of Ra with the variation in the levels. The increase in the spindle speed from 1000 to 1900 rpm increased the S/N of Ra at a higher rate. This agrees with the findings of Kumar et al., 42 increase in cutting speed increases the S/N of Ra. With the increase in the cutting speed, the contact between the tool and work at specified position decreases, this reduces the Ra of the composite. The increase in the feed rate and DOC decreased the mean S/N of Ra. Similar effects were obtained by Bhuvanesh Kumar et al. 18 and Rajeswari and Amirthagadeswaran. 43 Depending on the quality characteristics highest S/N ratio is obtained at the optimum parameters of 1900 rpm of spindle speed, 0.03 mm/rev of feed rate, 0.6 mm of DOC, 1375 rpm of tool rotational speed, and 30 mm/min of tool traverse speed.

Mean S/N ratio graph for surface roughness.
Analysis of Variance (ANOVA) for surface roughness
The computed results of the ANOVA for Ra drawn from Minitab 21 software are shown in Table 7. The confidence level of 95% at the significant level of 0.05 (5%) is used for the analysis.
ANOVA of surface roughness.
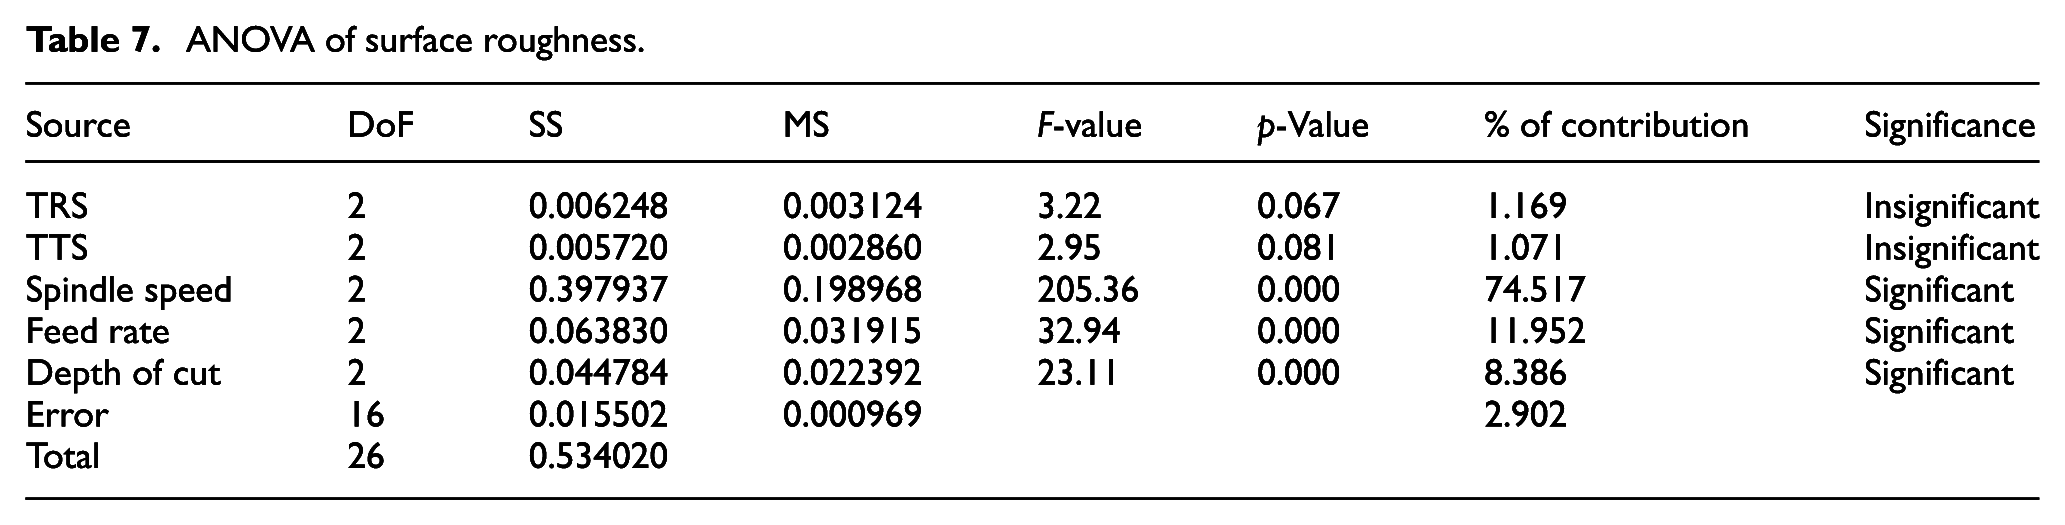
As shown in Table 7, spindle speed has the greatest impact on surface roughness (74.517%), followed by feed rate (11.952%) and depth of cut (8.386%). Tool rotational and traverse speeds have minimal effects. p-Values below the significance level confirm spindle speed, feed rate, and depth of cut significantly affect surface roughness. 17 While the p-values for tool rotational speed and tool traverse speed are greater than the significance level, this shows that these factors are insignificant for the occurrence of the Ra.
Model Summary for Ra:

The model explains 83.59% of the variability in surface roughness (Ra), with adjusted and predicted R-squared values of 79.68% and 74.17%, indicating strong predictive accuracy and model reliability.
Analysis of material removal rate
S/N ratio of material removal rate
Figure 6 shows the effect of the variation in the levels of the process parameter on the mean S/N of MRR. Based on the quality characteristics of MRR the larger S/N is obtained at the feed rate of 0.1 mm/rev, spindle speed of 1900 rpm, and depth of cut of 1.2 mm. The increase in the depth of cut increased the mean of S/N of MRR. This is due to the amount of material carried by each pass with the increasing depth of cut. This agrees with the findings of Alam et al. 39 when characterizing the MRR. Similarly, the increase in the feed rate increased the mean S/N of MRR. As the material fed by each pass increases the material carried by the tool increases, which results in the increase of MRR. Similarly, the increase in the feed rate increased the mean S/N of MRR. As the material fed by each pass increases the material carried by the tool increases, which results in the increase of MRR.
Mean S/N ratio graph for material removal rate.
Analysis of Variance (ANOVA) for material removal rate
The computed result for the ANOVA of the MRR drawn from Minitab 21 software is shown in Table 8. The confidence level of 95% at the significant level of 0.05 (5%) is used for the analysis.
ANOVA for material removal rate.
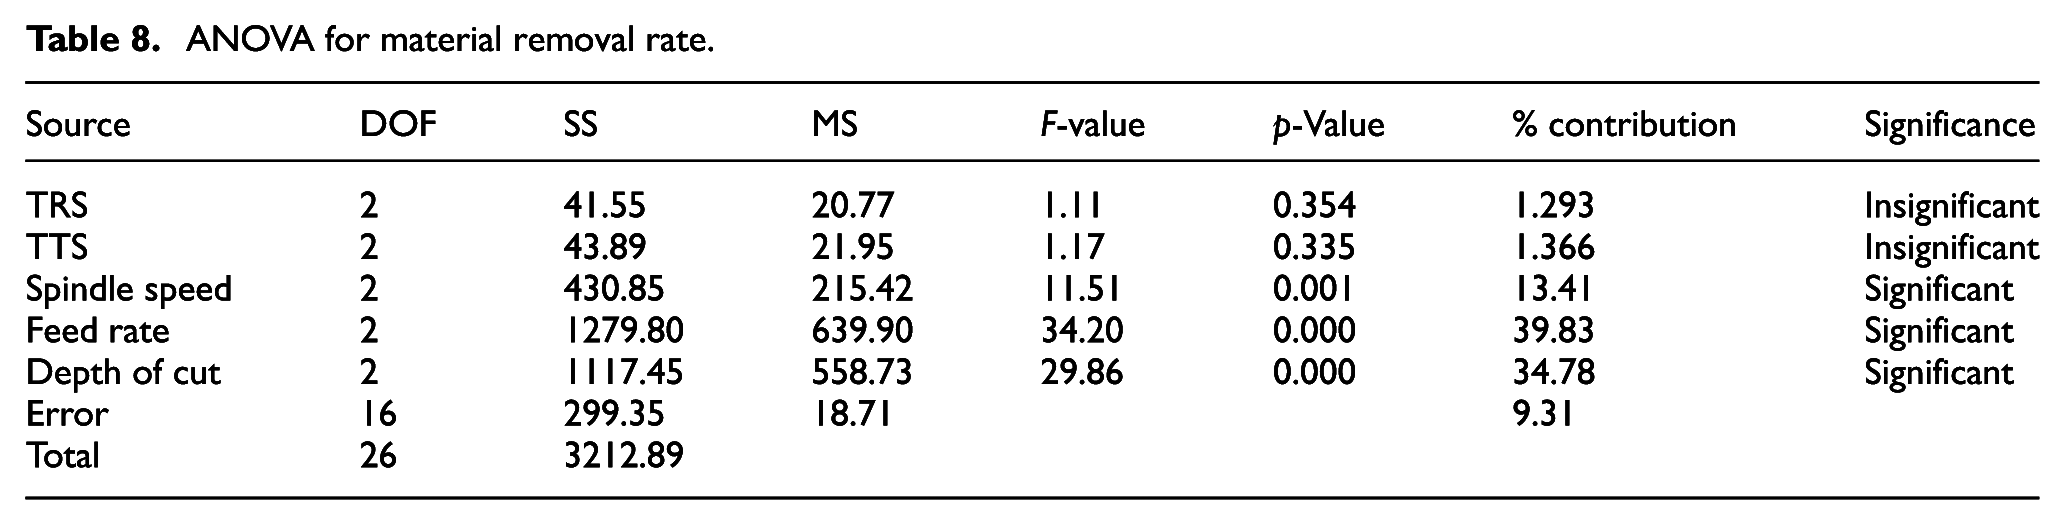
From Table 8, the feed rate is the most affecting parameter followed by the depth of cut, and spindle speed with the contribution of 39.83%, 34.78%, and 13.41% respectively. The tool rotational speed and tool traverse speed have the least influence on the MRR with contributions of 1.293% and 1.366% respectively. The p-values for spindle speed, feed rate, and depth of cut are less than the significant level, this shows these factors are significant for the occurrence of the MRR. As the p-value for the factors is less than the significant level then the significance of the factor is more. 44 While the p-values for the tool rotational speed and tool traverse speed are greater than the significant level this shows these factors have little effect on the MRR.
Model Summary for MRR:
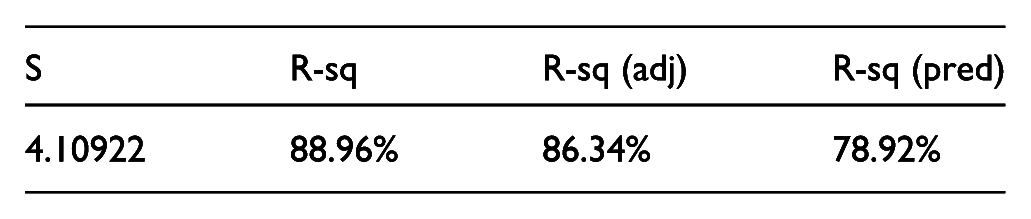
The model accounts for 88.96% of the variation in Material Removal Rate (MRR), with adjusted and predicted R-squared values of 86.34% and 78.92%, indicating high model accuracy and good predictive capability.
Analysis of tool wear rate
S/N ratio of tool wear
Figure 7 shows the variation of mean S/N of tool wear with the variation in levels of process parameters. Based on the quality characteristics of too wear the higher S/N is obtained at the feed rate of 0.03 mm/rev, spindle speed of 1000 rpm, DOC of 0.6 mm, 500 rpm of tool rotational speed, and 40 mm/min of tool traverse speed. The tool rotational speed and tool traverse speed plot show they have minimum effect on the tool wear.

Mean S/N ratio graph for tool wear.
Analysis of variance (ANOVA) for tool wear
The computed results for the ANOVA of the tool wear drawn from Minitab 21 software are shown in Table 9. The confidence level of 95% at the significant level of 0.05 (5%) is used for the analysis.
ANOVA for tool wear.

As described in Table 9, spindle speed is the major influencing factor on the tool wear followed by feed rate, and DOC with the contribution of 41.69%, 29.24%, and 19.81% respectively. Tool rotational speed and tool traverse speed have little contribution to the tool wear. The p-values for spindle speed, feed rate, and depth of cut are less than the significant level, this shows these factors are significant for the occurrence of the tool wear. While the p-values for the tool rotational speed and tool traverse speed are greater than the significant level this shows these factors have little effect on the tool wear. Factors with a p-value greater than the significance level are significant for the occurrence of the responses. 18
Model Summary for TWR
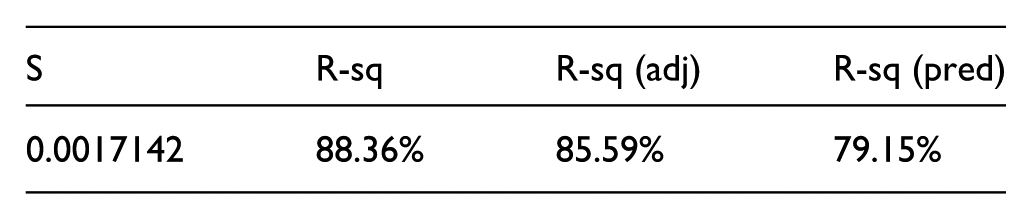
The model captures 88.36% of the variability in Tool Wear Rate (TWR), with adjusted and predicted R-squared values of 85.59% and 79.15%, demonstrating strong model fit and reliable prediction performance.
Regression model analysis

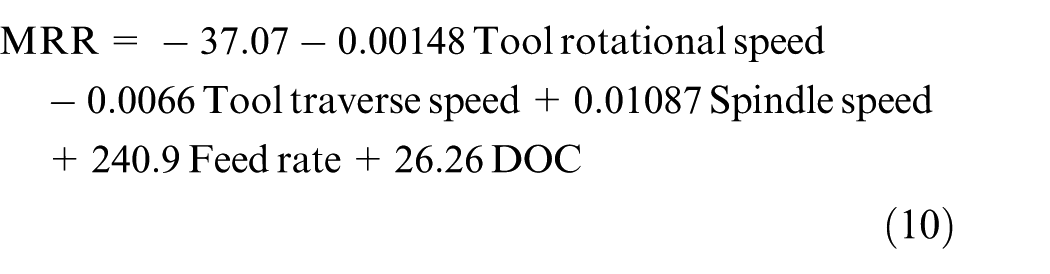

From the regression model in equation (9), the increase in the speed decreases the Ra by reducing the contact between the tool and work during machining, this reduces the chance of leaving marks on the surface of the work. This agreed with the findings obtained during the machining experiment.18,45 With the increasing feed rate and DOC, the material carried by the tool increases this leaves scratches on the surface of the work with each pass. 46 From the regression equation (10), with the increasing feed rate and DOC, the amount of material carried by the tool increases, which increases the MRR. With the increasing speed large chips are generated, which increases the MRR. 44 The negative constant in the model indicates the fitted line of MRR intercepts at −29.13 as the factors get zero. 47 From the regression equation (11), the increase in tool rotational speed decreases the tool wear. With the increasing spindle speed, the friction between the tool and the work increases which generates more heat. The heat produced increases the tool wear rate. 17 The increase in the feed rate and DOC increases the contact between the tool and the work, which increases the wear of the tooltip. 43 The accuracy of the models can be confirmed by random selection. 48 In order to confirm the accuracy of the developed models, two experimental runs are selected and the respective percentage error is calculated. Table 10 shows the results of the prediction and the experimental values. The percentages of error are less than 10% this indicates the developed models are good for prediction. The coefficient of determination (R2) of the responses obtained from Minitab in Table 11 indicates the regression model is dependable.
Confirmation results for the regression.

Response of regression analysis.

Contour plot
Figure 8(a) shows the effects of the relationship between tool rotational speed and tool traverse speed on Ra. Lower Ra less than 0.2 µm is found in the lighter region within the tool rotational speed around 1375 rpm with respect to the tool traverse speed of 30 mm/min. Also, Figure 8(b) depicts the effects of the relationship between tool rotational speed and spindle speed on Ra. Lower Ra less than 0.2 µm is found in the lighter region within the tool rotational speed around 1375 rpm with respect to the spindle speed of 1900 rpm. Furthermore, Figure 8(c) illustrates the effects of the relationship between tool traverse speed and spindle speed on Ra. Lower Ra less than 0.2 µm is found in the lighter region within the tool traverse speed of around 30 mm/min with respect to the spindle speed of 1900 rpm. Figure 8(d) shows the effects of the relationship between tool rotational speed and feed rate on Ra. Lower Ra between 0.2 and 0.3 µm is found in the lighter region within the tool rotational speed around 1375 rpm with respect to the feed rate 0.03 mm/rev.

Contour Plots of surface roughness: (a) Contour Plot of Ra versus tool rotational speed, tool travel speed, (b) Contour Plot of Ra versus tool rotational speed, spindle speed, (c) Contour Plot of Ra versus tool travel speed, spindle speed, and (d) Contour Plot of Ra versus tool rotational speed, feed rate.
Figure 9(a) describes the effects of the relationship between tool rotational speed and tool traverse speed on MRR. Higher MRR between 20 and 30 mm3/s is found in the darker region within the tool rotational speed greater than 1375 rpm with respect to the tool traverse speed around 20 mm/min. Similarly, Figure 9(b) depicts the effects of the relationship between tool rotational speed and spindle speed on MRR. Higher MRR between 20 and 30 mm3/s is found in the darker region within the tool rotational speed less than 1375 rpm with respect to the spindle speed greater than 1000 rpm. Also, Figure 9(c) illustrates the effects of the relationship between tool traverse speed and spindle speed on MRR. Higher MRR between 20 and 30 mm3/s is found in the darker region within the tool traverse speed around 20 mm/min with respect to the spindle speed greater than 1000 rpm and in the region within the tool traverse speed around 40 mm/min with respect to spindle speed of 1900 rpm. Figure 9(d) shows the effects of the relationship between tool rotational speed and feed rate on MRR. Higher MRR between 30 and 40 mm3/s is found in the darker region within the tool rotational speed around 500 rpm with respect to the feed rate 0.1 mm/rev.

Contour Plots of material removal rate: (a) Contour Plot of MRR versus tool rotational speed, tool travel speed, (b) Contour Plot of MRR versus tool rotational speed, spindle speed, (c) Contour Plot of MRR versus tool travel speed, spindle speed, and (d) Contour Plot of MRR versus tool rotational speed, feed rate.
Figure 10(a) indicates the combined effects of different process parameters on tool wear. In Figure 10(a), minimal tool wear (below 0.003 g/s) occurs in dark-shaded regions at higher tool rotational speeds above 1375 rpm and a tool traverse speed of about 40 mm/min, as well as at lower speeds near 500 rpm with a traverse speed around 20 mm/min. In Figure 10(b), low tool wear is observed at a rotational speed of 2250 rpm and spindle speed near 1450 rpm, and also at 500 rpm with a spindle speed of 1000 rpm. Figure 10(c) presents a similar trend between tool traverse speed and spindle speed, showing minimal wear at 40 mm/min with 1450 rpm and 20 mm/min with 1000 rpm. Lastly, Figure 10(d) reveals reduced tool wear below 0.003 g/s when the tool rotational speed is under 1375 rpm and the feed rate is below 0.065 mm/rev, indicating optimal process combinations for reduced wear.

Contour Plots of tool wear rate: (a) Contour Plot of tool wear versus tool rotational speed, tool travel speed, (b) Contour Plot of tool wear versus tool rotational speed, spindle speed, (c) Contour Plot of tool wear versus tool travel speed, spindle speed, and (d) Contour Plot of tool wear versus tool rotational speed, feed rate.
Grey Relational Analysis
The normalized values for the surface roughness and tool wear are calculated by using equation (5). The normalized value for material removal rate is calculated based on equation (4). The respective absolute differences of the responses are calculated based on the normalized values by using equation (6). Table 13 displays the summary of the calculated normalized and absolute difference values.
The Grey Relational Coefficient (GRC) of the response for each experimental run and the respective Grey Relational Grade (GRG) calculated using equations (7) and (8) are shown in Table 12.
Normalized, absolute difference values, GRC, and GRG.

The average grey relational grade is then calculated by fitting the average GRC of the levels and factors with the L27 orthogonal array in Table 6. Table 13 shows the calculated results of the average GRG.
Average GRG.

From Table 12 experiment number 13 yielded the first rank in GRG. The experiment with the higher GRG has a better quality of product. 18 The effect of the factors and the optimum value of the individual factor are determined from the GRG.
Table 13 depicts the best results that can be obtained with the optimum combination of the parameters. According to the table, a higher average GRG is obtained at the second level of tool rotational speed, second level tool traverse speed, third level of spindle speed, first level of feed rate, and first level of DOC. Milling the composite material made with 1375 rpm of tool rotational speed and 30 mm/min of tool traverse speed by the milling parameters 1900 rpm of spindle speed, 0.03 mm/rev of feed rate, and 0.6 mm of DOC yield better results.
Confirmation test
The validation experiment was performed utilizing the identified optimal parameter arrangement, and the results are presented in Table 14. The corresponding improvement is calculated as reported by Muaz and Choudhury. 49
Confirmation results.

By using the following formula (12) percentage of improvement was calculated in Table 14.

While Muaz and Choudhury focused on SiC-reinforced composites, their percentage improvement provides a validated framework for comparing property enhancement.
The validation experiment revealed that the optimal process parameters for the 7475/
The values obtained from the confirmation experiment were in close agreement with the optimized parameters. However, there was a slight variation in the surface roughness and tool wear rate, as shown in Table 14. This can be attributed to changes in the cutting tool weight and machining conditions. The improvement rates for the surface roughness and tool wear rate were 3.12% and 1.14% respectively. As compared to Rajeswari and Amirthagadeswaran
43
results obtained while milling composite prepared from AA 7075 with reinforcement of 5 wt%
Conclusion
This study assessed the end milling of Al7475-Al2O3-TiO2 hybrid composites fabricated by friction stir process. The machining performance of the fabricated hybrid metal matrix composite is evaluated in terms of surface roughness, material removal rate, and tool wear rate. The results of machining are analyzed and optimized using Taguchi-based GRA.
The study discovered that the highest hardness values with 46.43% increment from base alloy found in composite fabricated with 1375 rpm tool rotational speed and 40 mm/min tool traverse speed beyond that the value of hardness shows decrease.
The machining responses showed, with the optimum process parameters tool rotational speed of 1375, tool traverse speed of 30 mm/min, cutting speed of 1900 rpm, feed rate of 0.03 mm/rev, and DOC of 0.6 mm, a least Ra of 0.1503 µm is obtained. A maximum MRR of 47.5145 mm3/s is obtained with the process parameters tool rotational speed of 500 rpm, tool traverse speed of 40 mm/min, cutting speed of 1900 rpm, feed rate of 0.1 mm/rev, and DOC of 1.2 mm. Tool wear of 0.00079 g/s is obtained with the optimum process parameters tool rotational speed of 500 rpm, tool traverse speed of 20 mm/min, cutting speed of 1000 rpm, feed rate of 0.03 mm/rev, and DOC of 0.6 mm.
The ANOVA and regression model results showed that the cutting speed has the most significant influence on reducing Ra. The feed rate is the most significant factor for increasing the MRR and it is also found that the cutting speed is the most influencing factor in minimizing tool wear rate.
The Taguchi-based GRA showed the optimum parameters for the evaluation conditions are 1375 rpm tool rotational speed, 30 mm/min tool traverse speed, 1900 rpm speed, 0.03 mm/rev feed, and 0.6 mm DOC. The confirmation experiment by the optimized process parameters showed an improvement rate of 3.12%, and 1.14% in terms of Ra and tool wear rate respectively.
Recommendation
The optimization of AA7475 aluminum alloy reinforced with Al2O3 and TiO2 nanoparticles using friction stir processing shows strong potential for improving material properties. Future research should investigate other aluminum alloys, reinforcement combinations, and additional machining parameters to better understand their influence on performance. This study is valuable for aerospace and automotive industries producing high-strength, lightweight components, as well as for researchers focused on enhancing the characterization and machinability of hybrid metal matrix composites for advanced engineering applications.
Footnotes
Appendix
Handling Editor: Riccardo Nobile
Author note
We, the authors, hereby declare that this manuscript is our original work, has not been previously published, and contains no plagiarized material. All sources used have been properly cited, and we confirm that all authors have read and approved the final version of the manuscript.
Funding
The authors received no financial support for the research, authorship, and/or publication of this article.
Declaration of conflicting interests
The authors declared no potential conflicts of interest with respect to the research, authorship, and/or publication of this article.
Data availability statement
All data generated or analyzed during this study are included in the manuscript.