
Abstract
The rotor temperature monitoring is crucial for reliability and performance of permanent magnet synchronous motor. Overheating is the main reason for motor demagnetization, which may lead to power output interruption. However, direct measurement of rotor temperature is difficult to be widely applied in electric drive products due to expensive equipment and complicated integration. This paper introduces an innovative approach for estimating rotor temperature of permanent magnet synchronous motor based on BP neural network with big data-driven. The architecture of BP neural network is constructed by adopting Bayesian optimization theory, meanwhile related control parameters of rotor temperature estimation are picked out by Pearson correlation analysis. And then, BP neural network is trained forward and backward by using sufficient experimental data to obtain optimized weights and biases. Finally, wireless temperature measurement equipment is integrated into electric drive system on whole vehicle. Experimental results show that the maximal error is within 6.2°C under different operation environment and road conditions. The proposed method in this paper can meet requirements of rotor temperature estimation precision without extra cost and be extend to other motor application fields.
Introduction
Permanent magnet synchronous motor (PMSM) is widely used in electric vehicle (EV) industry due to its advantages including high power density, high operation efficiency as well as excellent start torque.1,2 The key issue for PMSM applications is focus on how to improve motor thermal safety and excellent torque capability with smaller size.3,4 Irreversible demagnetization and the permanent loss of magnetism may occur if rotor temperature rises above the magnetic Curie temperature of the magnetic material. 5 The remanent magnetic flux density decreases with the increase in temperature, leading to the decline of PMSM torque output capability. Additionally, accurate rotor temperature estimation can improve motor torque control precision and peak torque duration.
In recent years, the research on rotor temperature estimation is gradually increasing to ensure thermal safety and reliability of PMSM. Rotor temperature estimation method can be divided into the direct contact measuring method and the indirect estimation method. The direct contact measurement of rotor temperature is mainly carried out by using slip ring device to obtain rotor temperature from surface-mounted thermocouple adhered to rotor permanent magnet.1,6,7 For this method, it requires machine structure modification because thermocouple cables go through motor shaft and is connected with the data acquisition equipment.
Indirect estimation methods are preferred considering some flaws of direct contact measurement. There are three main pathways for indirect rotor temperature estimation including thermal model-based methods,8–10 flux linkage-based methods,11–13 signal injection and spectral analysis-based methods.14–16 Thermal model-based methods build heat transfer network to express power flow path and calculate rotor temperature, which requires precise motor parameters including the mechanical structure, materials, and cooling system parameters.17,18 But the temperature estimator is easily limited by application scenario, such as motor operation condition and working environment. Motor flux-based methods usually calculate real-time motor flux to obtain rotor temperature by looking up the relationship table from experiment test. 13 However, this algorithm precision suffers from motor flux observer while simultaneously estimating dq-axis inductance, winding resistance, and rotor flux linkage. Signal injection-based methods usually use high-frequency AC signal and fast Fourier transform algorithm to obtain resistance, which are closely related with rotor temperature.19,20 Nevertheless, this method can only estimate the average temperature, not the peak one, which is a common drawback of all resistance-based temperature estimation methods.
The topic discussed in this paper is contextualized in the field of PMSM rotor temperature estimation. To overcome disadvantages of the above algorithms, an innovative approach is proposed on back propagation neural network (BPNN) with experimental data-driven. Due to experimental data-driven BPNN training, the proposed method can estimate rotor temperature accurately under complex operating conditions such as different ambient temperature and comprehensive road conditions.
BPNN architecture design
BPNN usually consists of input layer, hidden layer, and output layer. Figure 1 describes the details of BPNN architecture. To improve rotor temperature estimation precision, control parameters strongly correlated with rotor temperature were obtained by Pearson correlation analysis described as expression (1). Input layer consists of eight nodes which represent eight input parameters, such as motor stator temperature, ambient temperature, cooling oil pump speed, DC bus voltage, d axis current, q axis current, motor speed, and torque. The number of layers and nodes in hidden layer is the primarily components of BPNN. More numbers of hidden layers and nodes bring complex calculation process and time consumption, reversely less numbers of hidden layers and nodes can’t meet the precision requirement of rotor temperature estimation.21,22 To solve the problem involving balance between calculation efficiency and estimation precision, the structure of hidden layers is optimized by Bayesian optimization theory to build with three network layers and 15 nodes for each hidden layer. The output layer is no doubt the only one node which belongs to estimation rotor temperature in our research. According to Figure 1, rotor temperature is associated with the input eight parameters by using weights, biases, and activation function operation in the hidden and output layers. Next, the method that uses experimental data to optimize BPNN and obtain high precision rotor temperature is introduced.
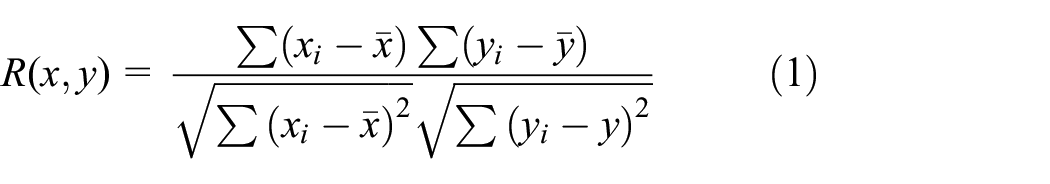
Where

The architecture view of BPNN.
BPNN algorithm development and optimization
In this section, BPNN algorithm is constructed by applying mathematical operations of layers’ weights, biases, and input parameters based on forward propagation.23,24 Then, BPNN algorithm is optimized by inputting experiment data to train layers’ weights and biases based on back propagation. The whole training optimization process is described as Figure 2.

The training optimization process of BPNN.
BPNN forward propagation
For forward propagation, input parameters are passed from the input layer to the output layer through three hidden layers. The initial rotor temperature can be obtained by using forward propagation to calculate input and output signals of each layer sequentially. The detail of signals flow is described as below.
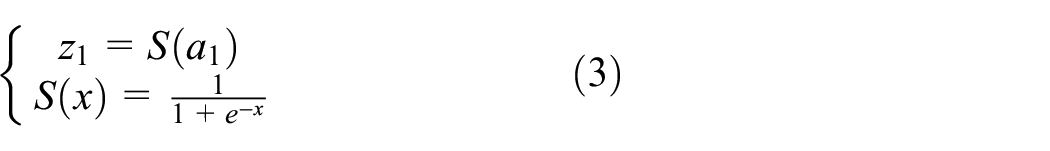
From input layer to the first hidden layer, input parameters are linearly processed by weight and bias of the first hidden layer as expression (2) and output parameter of the first hidden layer is nonlinearly processed by sigmoid activation function as expression (3).

Where
Where
From the first hidden layer to the second hidden layer,

Where

Where
From the second hidden layer to the third hidden layer,

Where

Where
From the third hidden layer to output layer, the estimated rotor temperature

Where
BPNN back propagation
The estimation precision of rotor temperature obtained by forward propagation is not enough. Therefore, back propagation is needed to optimize the weights and biases of BPNN layers based on experimental big data which is divided into training set (80%) and test set (20%) in the whole environmental operating range. The estimation error of rotor temperature from forward propagation can be obtained by expression (9). The loss function described as expression (10) is used to determine whether the back propagation optimization result meets the target. In the back propagation process, the gradient of loss function from the output layer are calculated to propagate these gradients back to the hidden layer, then weights and biases are updated by gradient descent optimization algorithm to accelerate loss function convergence.7,25 The optimization training ends when the loss function converges to a certain range.

Where

Where
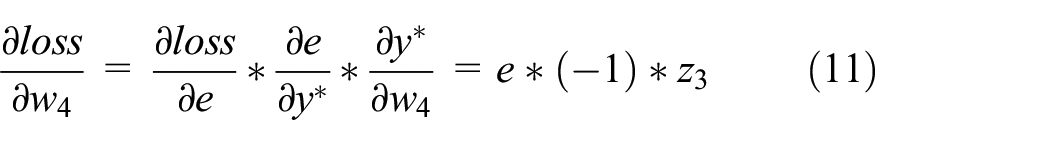
The loss function is used to calculate the corresponding gradients for the weights and biases of BPNN each layer by the chain derivation. For output layer, the gradients of weights W4 and biases b4 can be described as expressions (11) and (12) respectively.

For the third hidden layer, the gradients of weights w3 and biases b3 can be obtained by using the chain derivation of loss function to weights and biases from output layer and the third hidden layer successively. The entire solution process can be described as expressions (13) and (14).


For the second and the first hidden layer, the gradients of weights w2, w1 and biases b2, b1 can be also derived from the similar method of the chain derivation. Therefore, weights w2, w1 and biases b2, b1 are described as expressions (15), (16), (17), and (18) respectively.


The improved back training algorithm is proposed to control update speed of weights and biases based on expression (19). During the back propagation training of BPNN, learning rate has great influence on training effect. On one hand, the loss function may not converge due to the larger learning rate. On the other hand, it may take a long time to converge for the loss function because of the smaller learning rate. Therefore, learning rate can be empirically determined to ensure BPNN training effect.

Where
In order to verify excellent training effect of BPNN after forward and back propagation, Figure 3 shows the statistical results of relative error (RE), most of the errors are small and mainly concentrated near the zero-error line. Figure 4 presents the convergence process of loss function mean square error (MSE). The loss function achieves the target value of MSE after 12 training rounds.
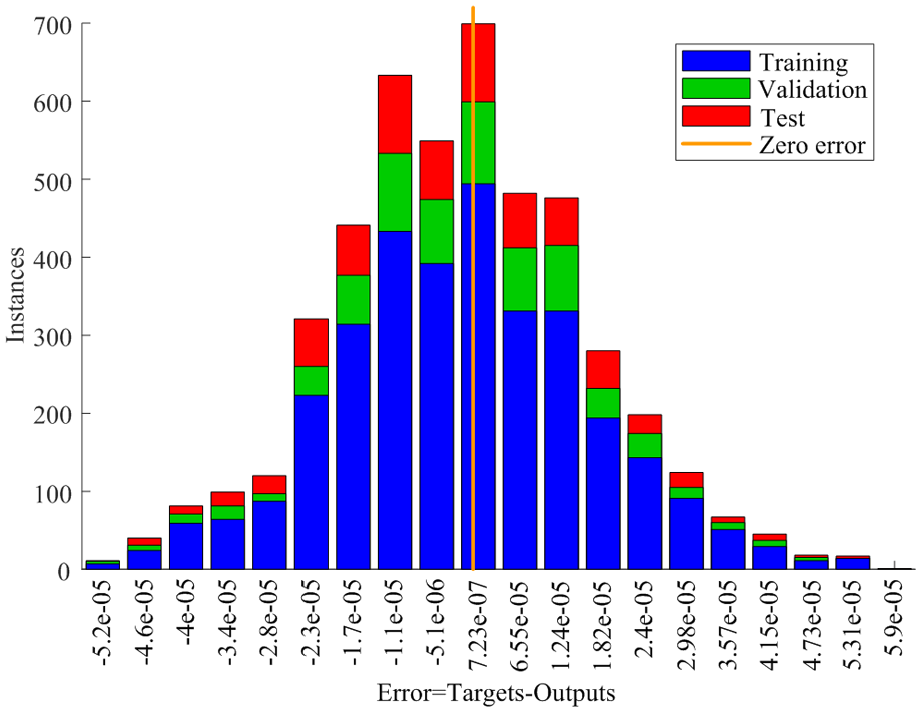
The relative error histogram of BPNN.
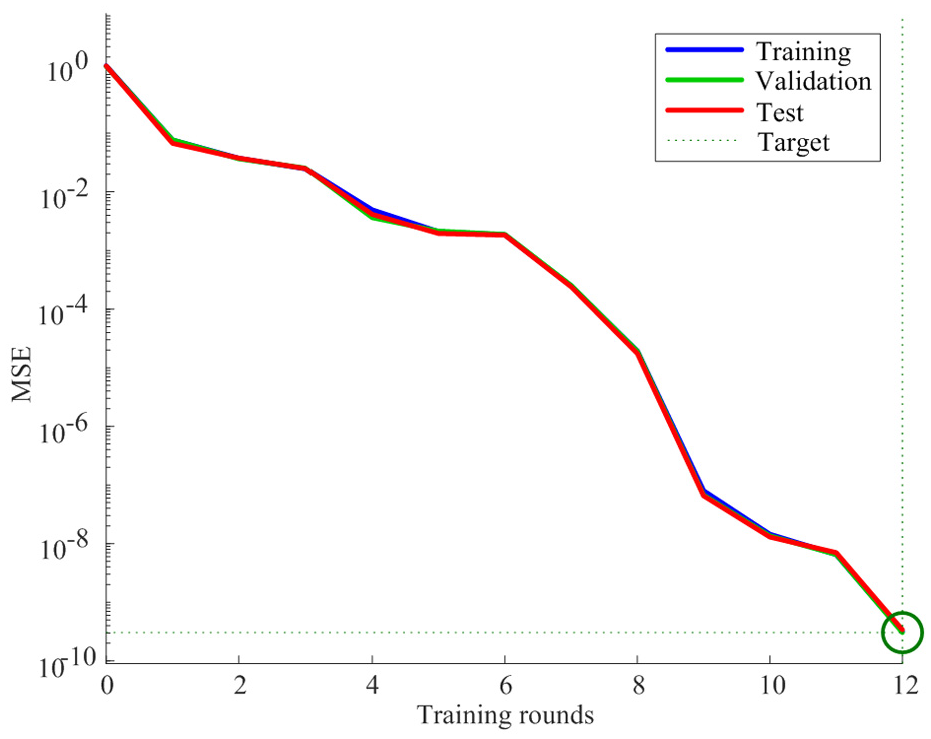
The mean square error of loss function.
Training data preprocessing
The abnormal experiment data should be preprocessed to eliminate the influence on the model precision optimization before the BPNN forward and backward training. The preprocessing flow of training data is shown in Figure 3.
Data missing processing
There may be a small number of missing data series due to the transient failures of sensor and data acquisition system during experiment process. The time series method is used to calculate new data to replace missing data (t time point) in Figure 5 by expression (20).

Where
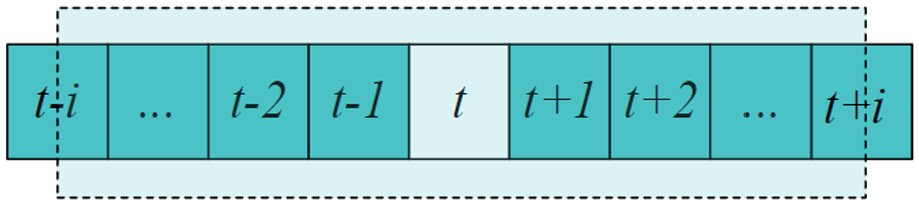
The diagram of filling data with time series method.
Data out of range processing
There may be measurement data exceeding normal maximum threshold range due to sensor signal interference. The threshold method is used to exclude data exceeding the normal maximum range by expression (21) and meanwhile the time series method is also used to supplement over-range data.

Where
Data white noise processing
There may be measurement signal white noise due to system and measurement errors. The arithmetic mean filter method is used to eliminate white noise signal by expression (22) and the arithmetic mean of the data is considered as the smoothed data to improve data application effect.

Where
Data normalization processing
Experiment data is normalized to eliminate dimensional differences among different types of input data based on expression (23) and improve the training effect and rotor temperature prediction accuracy before BPNN training.

Where
Rotor temperature test prototype manufacture
Test prototype should be constructed to obtain accurate and reliable rotor temperature measurement for BPNN model optimization. The wireless telemetry equipment is the first choice for measuring motor rotor temperature because of its stable signal transmission, reliability, durability, and low power consumption.26,27 Therefore, effective schemes of thermocouple layout and telemetry equipment integration are described as below.
The layout scheme of thermocouple
The distribution of rotor temperature field should be firstly analyzed by CAE simulation under 12 typical operating conditions to find the top 10 points (P1–P10) of rotor magnet with high temperature zones. And then all 10 thermocouples are attached to the rotor magnet surface with high temperature insulating glue and follow the red line path to go through blue hole according to Figure 6. Finally, the thermocouple wire harness is connected with the wiring port of the wireless transmission module through the shaft groove and wireless transmission module is fixed with flange plate in motor shaft according to Figure 7.

The layout of the top 10 high temperature points.
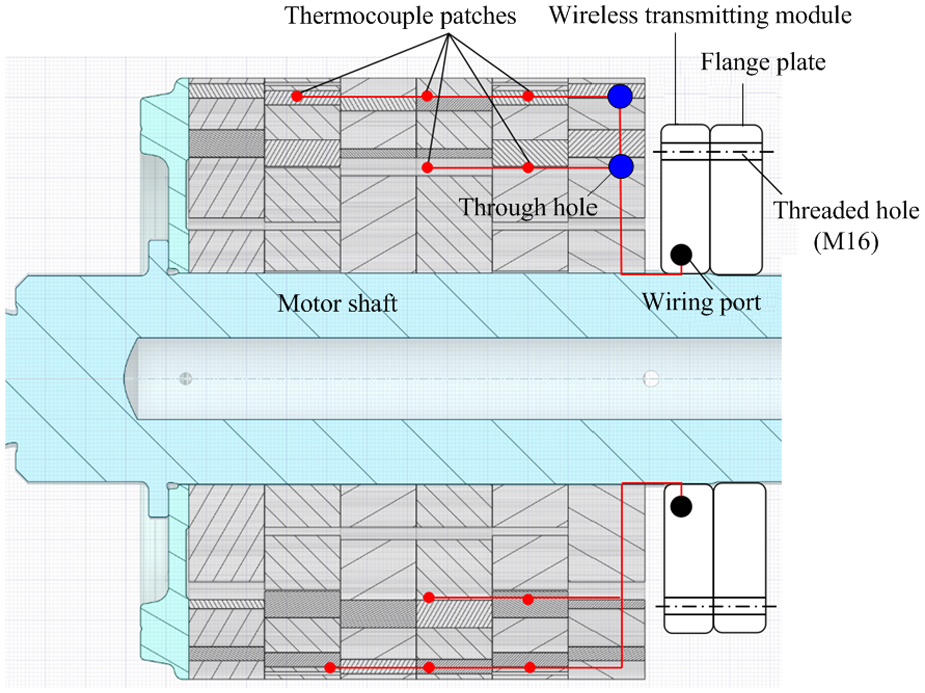
The connection scheme of thermocouple harness.
The integration scheme of wireless telemetry device
Figure 8 gives the details of the integration scheme for wireless telemetry equipment. Wireless receiving module fixed in motor shell obtains rotor temperature by signal link from wireless transmitting module to telemetry antenna. Electromagnetic shielding material is filled between the telemetry antenna and the inner cavity wall of the motor shell to prevent electromagnetic interference during rotor temperature signal transmission. Meanwhile, the wireless transmitting module is powered by the wireless receiving module through the telemetry antenna. The integration test results of wireless telemetry device are shown in Figure 9.

The integration scheme of wireless telemetry equipment.

The test results of wireless telemetry device.
Experiment validation
In order to verify the rotor temperature estimation precision of the proposed method in this paper, electric drive system with integrated wireless telemetry device is tested on the vehicle under different ambient temperature and road conditions. Figure 10 shows the test environment at low temperature, normal temperature, and high temperature. Additionally, road conditions consist of normal and limited conditions.

Test environment at different temperature and road conditions.
Figure 11 gives comparison results of estimated and measured rotor temperature under environment temperature −20°C in Yakeshi district. The integrated driving conditions include mountain roads, normal driving, overtaking, rapid acceleration, rapid deceleration, stopping. According to Figure 11 test results, the maximum estimation error is 4.5°C when the three driving conditions and the three natural cooling conditions are alternately performed. Mean square error (MSE) is about 2.6°C during whole driving condition with 2000 sampling points.

Test and verification results in low temperature (−20°C).
Figure 12 gives comparison results of estimated and measured rotor temperature under environment temperature 45°C in Turpan district. The integrated driving conditions include normal driving, overtaking, accelerating to 100 km/h with different throttles, rapid deceleration, constant speed, tip-in, and tip-out. According to Figure 12 test results, the maximum estimation error is 6.2°C when the above typical conditions are alternately performed. MSE is 2.9°C during whole driving condition with 2000 sampling points.

Test and verification results in high temperature (45°C).
Figure 13 gives comparison results of estimated and measured rotor temperature under environment temperature 25°C in Chongqing district. The integrated driving continuous great steep slope and stopping. According to Figure 13 test results, the maximum estimation error is 4.9°C when conditions low speed as well as high torque, stopping are alternately performed. MSE is 13.7°C during whole driving condition with 2000 sampling points.

Test and verification results in normal temperature (25°C).
Conclusion
Rotor temperature monitoring plays an important role in improving reliability and performance of permanent magnet synchronous motor. Direct measurement method has disadvantages of complicated structure design and expensive prices, which is unfavorable for large-scale industrial application of electric drive. Therefore, an innovative method of BPNN based on big data-driven is proposed in this paper.
Firstly, the BPNN architecture is constructed by Bayesian optimization theory and input layer parameters strongly correlated with rotor temperature estimation are obtained by Pearson correlation analysis. Next, the error is obtained by calculating the difference between estimated and measured rotor temperature during forward propagation. Besides, the loss function updates the weights and biases of each layer by using the processed experimental big data and chain derivation during back propagation. Finally, the rotor temperature estimation precision of BPNN in this paper is verified under different ambient temperature and road conditions. Test results show that the maximum errors are 4.5°C, 4.9°C, and 6.2°C under environment temperature −20°C, 25°C, 45°C and comprehensive road conditions respectively. The proposed BPNN method can be adapted to accurately estimate rotor temperature under different ambient temperature and road conditions.
Footnotes
Handling Editor: Sharmili Pandian
Funding
The author(s) disclosed receipt of the following financial support for the research, authorship, and/or publication of this article: Funding financial support for this article is SP200301, SP200303, SP200306.
Declaration of conflicting interests
The authors declared no potential conflicts of interest with respect to the research, authorship, and/or publication of this article.