
Abstract
This study investigates the microstructure, tensile properties, microhardness, and corrosion behavior of SS309L walls fabricated using cold metal transfer (CMT)-based wire arc additive manufacturing (WAAM). The microstructure of the deposited layers was analyzed and compared with previous studies. The findings indicate that the microstructure along the build direction is heterogeneous, consisting of austenite and delta ferrite (δ-ferrite) phases. The austenite phase increases from top to bottom due to cyclic heat transfer. The top region exhibits finer grains and a higher δ-ferrite content due to rapid cooling, resulting in increased microhardness. The average tensile strength of the WAAM-fabricated samples was slightly lower than that of the feed wire, while elongation values were comparable, demonstrating the suitability of WAAM for stainless steel part manufacturing. The fabricated samples exhibited excellent corrosion resistance, with a corrosion rate ranging from 0.01 to 0.023 mm/year. The primary mode of corrosion was identified as pitting corrosion. These findings contribute to the advancement of WAAM technology in industrial applications, particularly for fabricating stainless steel components with enhanced mechanical performance and corrosion resistance. The study provides valuable insights into optimizing WAAM processing parameters to achieve superior structural integrity, making it a viable alternative for manufacturing cost-effective and high-performance stainless-steel parts in the aerospace, marine, and automotive industries.
Keywords
Introduction
The most popular and well-known form of stainless steel is austenitic stainless steel which are highly formable, non-magnetic, and weldable. They are suitable for high-temperature applications like furnaces and jet engines that operate from cryogenic to red-hot temperatures due their exceptional oxidation resistance, creep resistance, and high temperature strength among other available grades. They are formed a solution containing 16%–25% chromium, molybdenum, and nitrogen, all of which contribute to their corrosion resistance. 1 For, stable austenitic structure, nickel or other austenite stabilizers must be added. 2 Austenitic grades of stainless steels are mostly used for many applications due to excellent mechanical properties. Carbon, nitrogen, and niobium can be added for applications requiring high-temperature strength. There are various proprietary alloys found in this group of materials such as 302B, 309, 310, 347. 3 SS309 is a highly alloyed grade that is primarily utilized for high temperature applications compared to SS310 due to its resistance to hydrogen sulfide (H2S) assaults at higher temperature. 4 The low-carbon version of SS309, known as SS309L, is suitable for the applications where high-temperature gases or condensates may cause sensitization and subsequent corrosion. Applications like firebox sheets, furnace parts, high-temperature containers, exhaust systems, catalytic converters, and so forth are typically where these problems arise. 5
Additive manufacturing (AM), often referred to as 3D printing, has become a transformative approach in manufacturing by enabling the direct fabrication of components from computer-aided design (CAD) data. Unlike conventional subtractive techniques, AM builds parts layer by layer, significantly reducing material waste and allowing for intricate geometries that are difficult or impossible to achieve through traditional methods. 6 Its ability to produce near-net-shape components with minimal tooling requirements has accelerated its adoption in sectors such as aerospace, automotive, marine, energy, and biomedical engineering. Metallic AM, in particular, offers opportunities for producing high-value parts from alloys like titanium, nickel-based superalloys, aluminum alloys, and stainless steels. However, challenges such as residual stress formation, anisotropic mechanical properties, process-induced porosity, and microstructural variability remain critical areas of research. Within the family of metallic AM processes, wire arc additive manufacturing (WAAM) stands out for its high deposition rates, cost efficiency, and suitability for producing large-scale metal components.
The American Society for Testing and Materials (ASTM) describes AM as the process of creating objects by adding materials layer by layer based on 3D model data, in contrast to traditional subtractive manufacturing methods. 7 The AM methods allow for the synthesis of materials that are expensive, such as tungsten or titanium, in either near-net shape or net shape. Metal AM processes fall into four categories as per ASTM standards: directed energy deposition (DED), powder bed fusion (PBF), sheet lamination, and binder jetting. 8 The WAAM is a promising AM technology that utilizes an electric arc along with wire as the deposition material, enabling a high deposition rate. WAAM broadly refers to all wire-based additive manufacturing methods that employ arc welding techniques. 9 WAAM is a sort of DED technique that builds 3D components by melting metal wire at a controlled pace and depositing it on a substrate or layer that has already been produced, according to ISO/ASTM 52900. 10 WAAM can be applied to the modification or reprocess of existing parts in addition to the production of new ones. 11 The primary advantages of WAAM include reduced lead times, decreased material waste, improved functionality, specialized tooling for low-volume products, and the ability to design with multiple materials. 12
The welding techniques employed in WAAM include gas metal arc welding (GMAW), gas tungsten arc welding (GTAW), and plasma arc welding (PAW). The GMAW-based WAAM method has a deposition rate that is roughly 2–3 times higher than that of GTAW and PAW. 13 One of the most popular welding techniques for WAAM is GMAW, which has been applied to cladding, surface, and AM for many years. The development of advanced control systems for arc welding power sources in recent years has enabled new welding process variants, such as controlled short arc and controlled spray arc processes. 14 Modern controlled short arc welding techniques require less energy than traditional uncontrolled short arc processes, making them suitable for use in additive manufacturing. Cold Metal Transfer (CMT) is the most recognized modified short arc process. 9 The CMT method is a development of the GMAW process that improves weld quality at a high deposition rate while requiring less heat input and spatter. 10 The wire motion, which aids in the molten droplet’s separation, is the foundation of the fundamental CMT process. This lowers the process heat input by enabling the arc to be periodically extinguished. 15 The basic CMT process cycle shown in Figure 1 consists of three phases (1) the Pulse phase, (2) the Wait phase, and (3) the Short circuit phase.
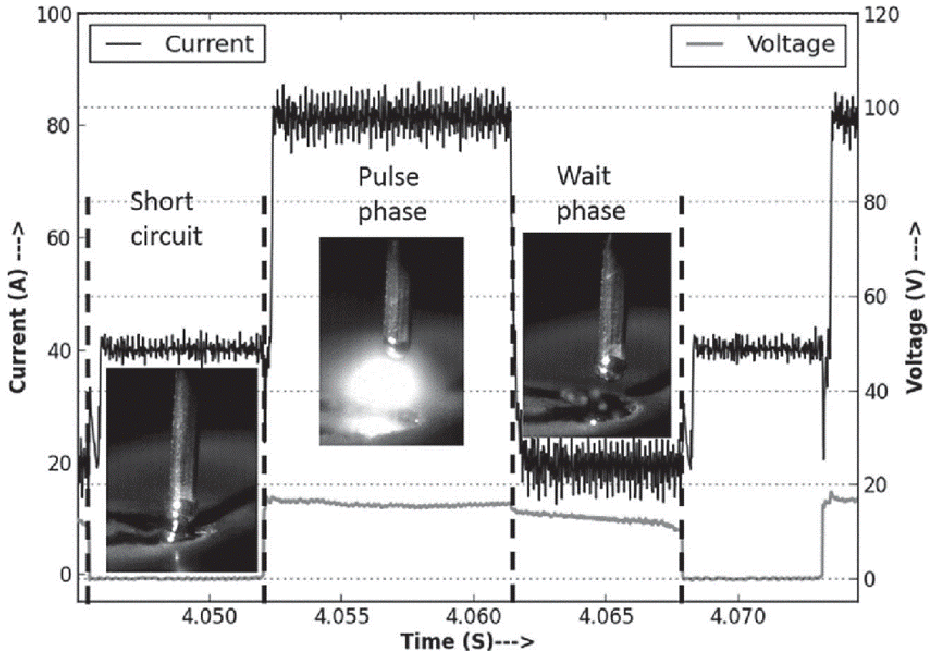
Current and voltage variation with time in CMT. 15
The filler metal is transported toward the weld pool that the arc creates during the first phase, also known as the pulse phase or arcing period. An arc is quenched and the welding current is decreased when the filler metal enters the weld pool (Wait phase). The subsequent event during the short circuit is the droplet separation, which is aided by the wire moving backward. There is a little current during the short-circuit period. The cycle then restarts with the arc being lit and the wire being forced in the direction of the weld pool.16,17 This cycle’s duration is not fixed; instead, it is tuned in real time based on predefined arc properties. A pulsed cycle is introduced to the process in CMT Pulse, which also results in an increase in heat input. Higher deposition rates result from this since each cycle has an additional droplet detachment. 15
In recent years, significant research works have been conducted on the application of WAAM for stainless steels, with majority of the studies were focused on austenitic grades such as SS304, SS316L, and duplex stainless steels (DSS) due to their weldability and corrosion resistance characteristics. For an instance, Jin et al. 18 investigated the mechanical and corrosion properties of WAAM-deposited SS316L, while Wang et al. 19 explored the anisotropic tensile behavior of WAAM-fabricated DSS. However, a thorough review of the current literature reveals that systematic studies on the microstructural and mechanical behavior of WAAM-deposited SS309L are scarce. Although a very few works have carried out on WAAM-based deposition of SS309L,20,21 their tensile strength and corresponding process parameters where investigated, but studies involving tensile characteristics, microhardness, and corrosion behavior in relation with microstructural properties have not been adequately explored.
This gap highlights the novelty of the present work, which aims at systematically evaluating the mechanical, tensile, and microstructural characteristics of SS309L components fabricated through WAAM, intended to establish a baseline data and understand the influence of anisotropy and build orientation on its performance.
Materials and methods
Materials
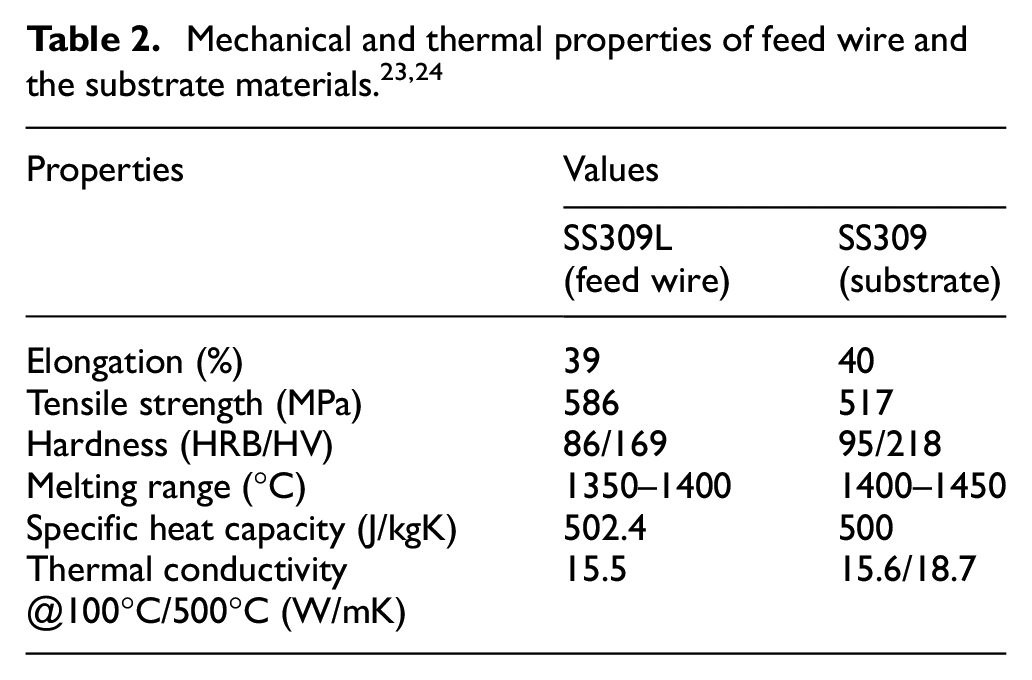
The filler wire of SS309L and the base plate of SS309 were used to carry out the research work. SS309L feed wire having a diameter 1.2 mm is used as a working material. The SS309 steel plate with dimensions 200 mm × 100 mm × 10 mm is used as a substrate. These metals are found to have similar chemical compositions. The weight percentage chemical composition, as well as the mechanical and thermal properties of both materials, are presented in Tables 1 and 2, respectively. 22
Chemical composition by weight percent for feed wire and the substrate materials.

Parameter selection
To produce quality beads, Microprocessor-controlled MIG welding machine with Fronius make TransPuls Synergic 3200 wire feeder was used. The trials were carried out by setting different input parameter options available. Several trials with different input parameters were performed, and the trials resulting in uniform and defect-free depositions were considered for the study since no research work explored the parameter optimization for SS309L components manufactured through WAAM. Finally, a total of five successful depositions were obtained without visible defects as shown in Figure 2. The parameter combinations used for the trails are shown in Table 3. The first four trials were carried out in CMT mode and found the beads with a rough appearance and non-uniformity in width along the length. The fifth trial was fabricated in CMT-Pulse mode, and both build quality and uniformity of width along length were found to be better. Therefore, it was decided to build a wall using CMT-Pulse mode, and the parameters were selected from the trials as shown in Table 3.
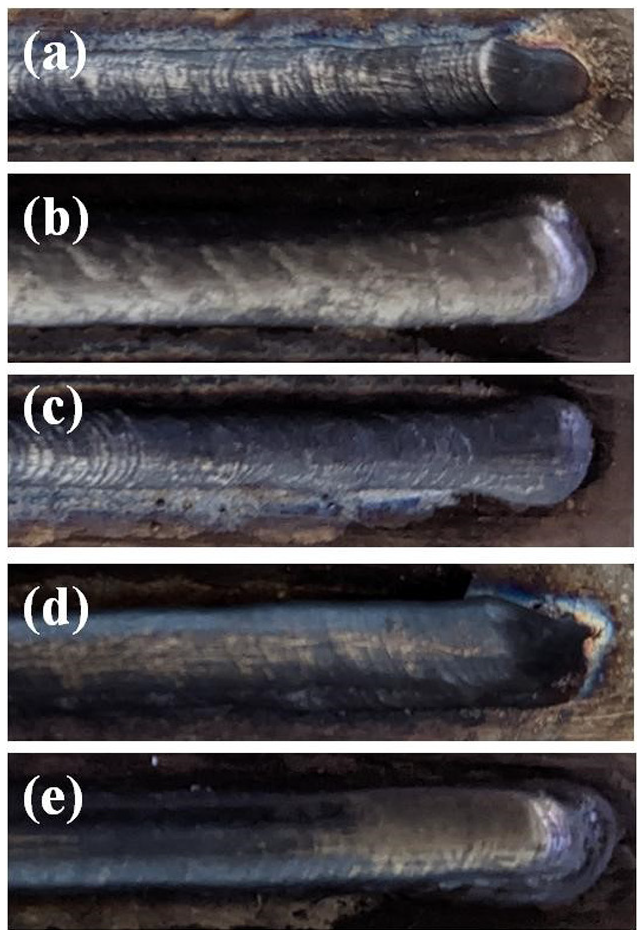
Deposited weld beads respectively for: (a) Trial 1, (b) Trial 2, (c) Trial 3, (d) Trial 4, and (e) Trial 5.
Input parameters for different weld trials.

Building a wall
The wire feeder was kept in synergic mode, and the material was selected appropriately with similar chemical composition of SS309. Table 4 shows input parameters set in the machine with synergic mode, and 100% Argon (Ar) is supplied as shielding gas at the flow rate of 15 L/min.
Parameters used for building the wall.

To avoid thermal shock to the base plate, the plate was heated slowly using n-butane gas (C4H10) along the length. The first layer was deposited on the plate for a length of 180 mm. To get a fully solidified and strong bead, the interpass temperature was maintained between 300°C and 350°C. It took around 4.5 min for a bead to cool down to interlayer temperature. The interpass temperature was measured using the Extech infrared thermometer. The oxide layer formed on a bead was removed using a wire brush before the subsequent layer was deposited. This way, an entire vertical wall of 80 mm height was fabricated layer by layer. It took 31 full length layers and an additional 5 short layers at the end to have a uniform size. The average bead width was measured as 8.5 mm. Different views of a fabricated wall are shown in Figure 3.

Different views of a fabricated component showing: (a) wall height, (b) substrate dimensions, (c) wall length and height after cut from substrate, (d) machined surface, and (e) wall thickness.
After the fabrication, the wall was cut out from a base plate and machined to get a flat and parallel surface with uniform dimensions. During machining, wall thickness was reduced to 4.5 mm from 8.5 mm. Figure 3 shows the dimensions of wall before and after machining.
Specimen preparation and testing methods
For testing purposes, different shapes and sizes of specimens were cut from a flattened plate as shown in Figure 4 and prepared for testing. For the tensile test, specimens were cut using wire EDM as per ASTM E8-E8M standard with sub-size specimen dimensions, and the metallographic specimens were cut as per ASTM E3 standard.

Locations of various test specimens.
For easy handling of the metallographic specimen, mounting was made using a mixture of acrylic powder and liquid in the ratio of 1:2 is used, then the mount was kept for curing for around 15 min. Metallographic specimens were polished with silicon carbide emery sheets with grades of 320, 600, 800, 1000, and 1200 and finally were cloth polished using 6-micron alumina powder to obtain a mirror-like finish. After polishing specimens were etched for about 75 s using a solution of 35% hydrochloric acid and 65% nitric acid in the ratio of 3:1 and rinsed in water and finally dried with a dryer.
Macrographs were taken using the Lawrence & Mayo manufacture macroscope, which was outfitted with Motic 5.0 software, for macroscopic observations. A scanning electron microscope (SEM) of make Zeiss Gemini SEM 300 and an OLYMPUS optical microscope with MetaPlus software were used for the microscopic investigation. For measuring ferrite content, Fischer make Feritscope was used. Using a diamond tip indenter and a load of 1 kgf for 10 s, the Wilson manufacture Vickers 402MD tester was used to measure the microhardness values. For corrosion test, 3.5% [W/V] NaCl electrolytic solution was used for testing 0.36 cm2 area of specimen as per ASTM G102-89 standard. For the tensile test, TINIUS OLSEN made H50KL/150:25KN UTM was used.
Results and discussion
Microstructure
For distinguishing the deposited layers, all the specimens were studied with 10× magnification. The boundaries separating the layers are highlighted in Figure 5. The deposited layers and boundaries formed due to fusion between adjacent layers are clearly visible. It is also observed that the shape and dimensions slightly vary for each layer in every sample. The layer thickness of top layer is thicker than the bottom layers of the wall. As the bottom layer undergoes more number of thermal cycles upon continuous layer deposition, the microstructure refinement occurs more compared to top layers resulting in varying thickness across the different zones of built wall. Hence thickness of all identical layers from the samples are averaged. The thickness of the deposited layers is measured to be 2.6 mm within the five samples.

Macrostructure of: (a) sample 1, (b) sample 2, (c) sample 3, (d) sample 4, and (e) sample 5 showing hardness spots, ferrite measurement spots, and layer thickness.
For stainless steel joints, there are four possible solidification modes: totally austenitic (A mode), austenitic-ferritic (AF mode), ferritic-austenitic (FA mode), and entirely ferrite (F mode). This allows for the production of four different ferrite morphologies in stainless steel joints at room temperature: globular, acicular, lathy, and vermicular (skeletal). All three other ferrite forms have shape instability associated with the globular type due to heat effects, while solidification and solid-state transitions are associated with the first three types. The Ni equivalent (Nieq) and Cr equivalent (Creq) are useful for predicting the phases that will form in the microstructure. 25 These values, calculated using the Schaeffler equations, are defined as: Nieq = Ni + 30C + 0.5Mn and Creq = Cr + Mo + 1.5Si + 0.5Nb. Based on Table 1, the Nieq and Creq values for the WAAM sections are 14.54% and 25.445%, respectively, resulting in a Creq/Nieq ratio of 1.75. When this ratio falls between 1.48 and 1.95, the FA mode is present. According to the pseudo-binary phase diagram, this predicts the formation of δ-ferrite as the primary phase and austenite as the secondary phase.
The temperature cycles of subsequent layers during deposition can also influence the microstructure along the building direction. As ferrite is not an equilibrium structure, heat cycling can dissolve it and lead to variations in ferrite content across different regions. Therefore, microstructural characterization was conducted in five distinct regions from the top to the bottom of the WAAMed wall, as the cooling rates predominantly determine the microstructure formation in steel products with the same elemental composition. Figures 6 and 7 presents the microstructures of all the samples.

Microstructures at 100 × magnification of (a) sample 1, (b) sample 2, (c) sample 3, (d) sample 4, and (e) sample 5.

Microstructures of each sample with different magnifications.
All locations showed, as expected, a randomly distributed δ-ferrite (dark phase) with a body-centered cubic structure and an γ-austenite (in light green color) phase with a face-centered cubic (FCC) structure. Ferrite (δ–phase) is present mainly in columnar dendritic form and sometimes equiaxed, elongated dendrite as well. Because of the low carbon contents, no carbide precipitation was discovered similar to the other study by Chen et al. 26 Conversely, the ferrite grew perpendicular to the building direction toward the molten pool’s center as a result of the dendritic solidification, that takes place perpendicular to the fusion lines. Hence the dendrites are oriented perpendicular to the build direction. Because of the faster cooling than the higher sections of any particular layer, delicate columnar structures with tiny dendritic arm spacing were thus seen next to the fusion line. However, away from the fusion line, the microstructure transitioned from fine to coarse columnar formations. The grains in the subsequent layers showed the same pattern of growth. Branching is observed in all samples which indicates the broadening of grains due to subsequent deposition of layers and formation of dendrites in the direction of heat flow. 27 It’s also important to note that, as a result of each succeeding deposition’s rising temperature, dendritic arm spacing exhibited an increasing tendency from top to bottom. These dendrites with branching of subsequent layers forms chains of grains parallel to the building direction as shown in Figure 6. These results also showed good agreement with 19 earlier observations. In all samples, the boundary separation between two layers is clear with distinct structures without any defects. 28 This ensures the proper adherence of all layers from top to bottom.
In contrast, the formation of ferrite in austenitic stainless steels was mainly influenced by higher concentrations of Cr, Si, and Mo. Across all regions, the ferrite morphology was found to be similar, predominantly exhibiting skeletal, lathy, and globular structures. The upper regions of the WAAMed part exhibited more lathy structures, attributed to the restricted diffusion during ferrite-austenite transformation under conditions of rapid solidification. 29 A ferrite scope was used to ascertain the ferrite content of the layers in order to highlight the variations between the regions. An average of 10 readings for each sample is taken as the final ferrite content. Figure 8 shows the readings of ferrite content by weight for each sample and their average values are calculated as 9.48, 8.94, 8.45, 7.8, and 7.96 respectively for sample 1–5. Additionally, it is clear that the ferrite content increases from the bottom to the top layer. It is due to the increase in ferrite (δ–phase) that gets added upon during subsequent deposition of layers. 30

Graph showing ferrite content variation across samples.
Microhardness and tensile tests
For microhardness measurement, six readings per sample across various locations were taken to get an average value. Figure 9 illustrate the variation in hardness values among the samples. Components fabricated using WAAM show minor variations in hardness values along the build direction, attributed to the presence of multiple weld beads with a highly heterogeneous microstructure. Areas with greater ferrite content and fine dendritic structures exhibit higher hardness levels. Conversely, softer areas in the upper region with a coarser structure experience dissolution of δ-ferrite into austenite. Compared to the austenite phase, the ferrite phase has a higher hardness. The hardness values of sample-1, sample-2, sample-3, sample-4, and sample-5 were recorded as 171.16, 173.84, 169.86, 169.9, and 157.4 HV, indicating a slight variation among the first four samples. These findings verified a direct correlation between δ-ferrite and the hardness levels. The results gained align with a related study found in the literature.31,32 The least hardness was found as 157.4 HV from sample-5 as more austenite phase is developed at the bottom layers.

Microhardness of all five samples at different locations.
Tensile test results of the five specimens taken at various positions and angles are shown in Table 5. From the tensile test graphs, results such as ultimate tensile strength, total elongation, and break distance (i.e. total extension of the sample at the moment of fracture including both the elastic and plastic deformation) were fetched. Before breaking, every sample underwent elastic and plastic deformation. The maximum elongation found in the vertical sample (T1) with 40.4%. Elongations of all specimens were nearly uniform except the horizontal specimen cut from middle portion (T3) which is only 32.5% attribute to a variation of 7.9% from maximum value. The parts have demonstrated significant elongation values (about 38%) that are comparable to the feed wire (39%), making WAAM parts a strong contenders for use in the production of stainless-steel components. It is noticeable that for both T1 and T5 specimens, tensile strength is comparatively lower, but percentage elongation is higher than the original wire. The break distances for T1 (16.2 mm) and T5 (16 mm) were higher compared to other samples (ranging from 12 to 13 mm), indicating better ductility for these samples.
Tensile strength and percentage elongation values for all five specimens.

Anisotropy in WAAM-fabricated components develops majorly due to layer-by-layer fashioned deposition and associated thermal cycles. Newly deposited layer cools rapidly while, bottom layers experience reheating and slow cooling rates leading to non-uniform microstructure across the build direction. The δ-ferrite phase being harder than austenite found relatively higher in top layers accounts to good mechanical characteristics. Tensile specimens extracted along the deposition direction displayed predominant tensile strength values due to more uniform grain structures. In contrast, the samples extracted along build direction exhibited comparatively low tensile strength, attributed to weaker interlayer adhesion due to coarser microstructures at the interfaces. This variation manifests the presents of anisotropic characteristics of the wall along the build direction. 33
The tensile curves of the base metal, and the test samples are shown in Figure 10. It is obvious that the base metal possess peak tensile strength of 586 MPa and all other samples’ the values vary from 450 to 556 MPa. The yield transition of base metal is identified around 400 MPa while the other samples range from 270 to 330 MPa. Total elongation of T1 (40.4) and T5 (40.1) is slightly greater than base metal (39) compromising their tensile strength. The slope from elastic to ultimate tensile strength (UTS) is steep in consistent for base metal while the other samples shows slight variations. All the samples exhibit similar trend or little early drops, however, T-5 shows better post-UTS behavior, and more gradual than others. Collectively, the base metal outperforms well in both strength and ductility, while T-4 with lowest elongation resulting a least favorable choice.

Tensile curves showing stress versus strain of: (a) base metal, (b) sample 1, (c) sample 2, (d) sample 3, (e) sample 4, and (f) sample 5.
Corrosion test
Potentiodynamic polarization tests were employed to evaluate the materials’ resistance to pitting and corrosion, following ASTM G102-89 standards. The experiments were conducted using a CHI-660e potentiostat in a test solution of 3.5 wt% NaCl at a controlled temperature of 25°C ± 0.1°C. The scan rate used was 10 mV/min. A platinum grid functioned as the counter electrode, while a saturated calomel electrode (SCE) served as the reference electrode. The working electrode was prepared by embedding the specimen in epoxy resin.
Potentiodynamic polarization tests were used to generate the Tafel graph as shown in Figure 11 and Anodic and cathodic Tafel constants can be measured automatically from the Tafel graphs. Graphs reveal a similar pattern from top layer to bottom layer which infer that the corrosion rate is uniform across the height. From Table 6, it can be noted that the corrosion rate varies from around 0.01 to 0.023 mm/year which is an impressive number. Also, the current density increases from top to middle layer and then decreases toward the bottom layer. Similar trend is observed on the anode Tafel slope (βA, V/dec) and the cathode Tofel slope (βC, V/dec) as well. This shows that the middle region layer has undergone controlled cooling than the upper and lower region layers. The middle region is covered by actively heating layers at the top and cooler layers at the bottom. Repeating heat from the arc and residual heat below the middle layer creates a buffer zone in which temperature is gradually changes leading to slower and uniform cooling. This is referred as controlled cooling that results increased current density and lowers the polarization resistance (Rp). 34 However, Rp increases gradually toward top region, indicating the change in this temperature profile.

Tafel graphs for each sample.
Corrosion test parameters.

After the corrosion test specimens were examined for magnification of 200× as shown in Figure 12 to know about the corrosion mechanism. Images show pitting corrosion as the main reason for corrosion. Pitting corrosion is present in different pit shapes like deep, shallow, and localized pits. The main cause of corrosion is the presence of varying temperature profiles across the deposited layers. The corrosion resistance of SS309L is strongly influenced by austenite and ferrite phase distribution. Being FCC structure, austenite contains higher nickel content, which stabilizes passive chromium oxide film. The formation of a stable Cr2O3 layer on the surface of stainless steel significantly contributes to its corrosion resistance. Furthermore, the ferrite phase is more corrosion resistant because to its higher chromium content. The deep pits are the areas where the reaction of subsequent layers is heavy with corrosion agent (Sodium Chloride) and this indicates the presence of transition layers having less Cr2O3. The shallow and localized pits are the areas where the corrosion resistant layers of ferrite phase of Cr2O3 is presented.
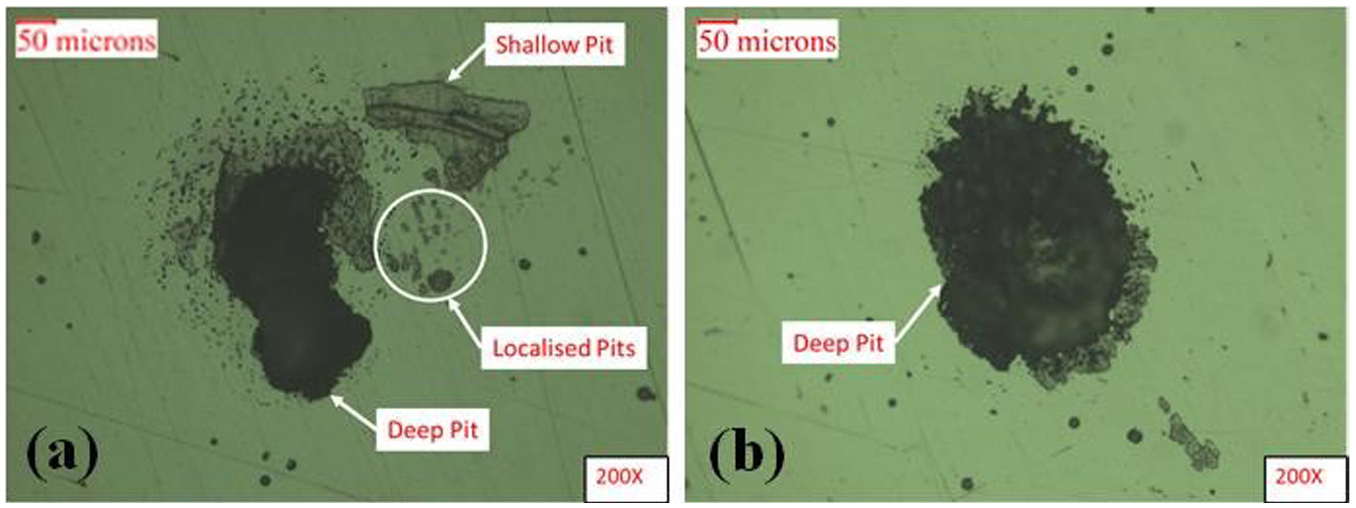
Corroded samples showing: (a) localized pits and (b) deep pits.
The localized microanalysis of pits are further performed through SEM area analysis. As shown in Figure 13, no separate measureable oxygen enrichment was detected in the selected area. Similarly, no presence of hydrogen or hydrogen-induced features was observed in the elemental analysis. Interpretation revealed a high chromium content, supporting the effect of austenite and ferrite phase distribution on corrosion resistance which is aligned with previous literature. 35

SEM and EDS results showing: (a) localized pits under SEM, (b) selected area for EDS, and (c, d) EDS results.
Conclusion
This work demonstrated the successful fabrication of an SS 309L wall on an SS 309 substrate using the WAAM process, followed by a comprehensive evaluation of its structural integrity, mechanical performance, and corrosion behavior. The principal observations are as follows:
The WAAM process yielded a defect-free wall, free from cracks, porosity, or lack of fusion, with strong adhesion between successive layers.
Macrostructural analysis revealed clearly defined layer boundaries, with an average thickness of approximately 2.6 mm per layer.
The deposited material exhibited an austenitic (γ) matrix containing δ-ferrite in the form of continuous dendritic networks. Fine columnar grains with small dendritic arm spacing were found near the fusion line, transitioning to coarser columnar structures farther away. The average ferrite content was 8.5 wt%, increasing gradually with build height.
Microhardness measurements confirmed that δ-ferrite regions possessed higher hardness than austenitic regions, with values increasing from 157.4 HV at the top to 171.16 HV at the bottom.
Tensile testing indicated that the horizontal specimen achieved the highest strength (556 MPa), comparable to the feed wire, while the 45° inclined specimen recorded the lowest strength (450 MPa).
All specimens displayed good corrosion resistance, with corrosion rates ranging from 0.01094 to 0.02302 mm/year (average 0.01737 mm/year). Microscopic analysis identified pitting as the primary corrosion mode.
The parameter set used in this study was determined through trial-and-error to achieve uniform, defect-free beads. These findings can guide parameter optimization in future WAAM investigations.
Overall, the study confirms the capability of WAAM to produce high-quality SS 309L components with desirable structural and corrosion properties, while also providing microstructural insights that can aid in tailoring mechanical performance through process control.
Footnotes
Handling Editor: Chenhui Liang
Ethical considerations
This study does not involve human participants, animals, or any ethical concerns requiring approval.
Author contributions
M. Bhuvanesh Kumar: Supervision, Conceptualization, Validation, Writing – Original Draft, Writing – Review & Editing. Sandesh Sanjay Khairnar: Investigation, Formal Analysis, Writing – Original Draft. Milon Selvam Dennison: Writing – Review & Editing.
Funding
The authors received no financial support for the research, authorship, and/or publication of this article.
Declaration of conflicting interests
The authors declared no potential conflicts of interest with respect to the research, authorship, and/or publication of this article.
Data availability statement
The datasets generated and analyzed during the current study are available from the corresponding authors upon reasonable request.