
Abstract
To address the challenge of balancing accuracy and computational efficiency in evaluating the measurement error and uncertainty of surface profile errors on complex free-form surfaces, this paper proposes an evaluation method combining adaptive sparse grids and polynomial chaos expansion. First, the surface profile error of the car door outer surface is initially evaluated using a NURBS surface fitting and segmentation approximation algorithm. Next, based on the error evaluation results, a polynomial chaos expansion model for the surface profile error is established. This model is optimized using Cholesky decomposition to handle variable correlations, sparse grid integration for efficient generation of multidimensional integration points, and maximum entropy method for direct reconstruction of probability distributions, thereby achieving efficient evaluation of the measurement error and uncertainty of surface profile. Numerical and experimental validations based on the car door outer surface demonstrate that compared to the ISO standard method, this method achieves a mean prediction error of less than 0.3% and a standard deviation relative error of less than 0.5% with a reduction of 99.6% in the number of sample calculation points. The evaluation results are accurate, and the computational efficiency is improved by 96.4%.
Introduction
With the wide application of complex freeform surfaces in high-end manufacturing fields such as aviation, aerospace, and automobiles, the requirements for the geometric accuracy of workpieces are increasing, especially the accuracy of surface profile evaluation has gradually entered the sub-micron order. 1 In the context of intelligent detection, how to effectively evaluate the error and uncertainty of freeform surfaces under the conditions of small samples, high precision and low cost has become the focus of attention in academia and industry. Among them, the small sample problem has received extensive attention in many fields, including hydraulic engineering, aerospace, mechanical engineering, 2 etc. Researchers have proposed different methods to solve the unique characteristics of small-sample problems, including Monte Carlo method, Bayesian method, and bootstrap resampling method, which can alleviate the evaluation error caused by insufficient samples to a certain extent. 3 At the same time, the general grayscale modeling theory 4 has also been applied to the modeling and uncertainty description of complex structural systems, showing good adaptability and flexibility. In practical engineering applications, the uncertainty assessment of surface profile error often faces challenges such as small data sample size, complex distribution form, and uncertainty of the measurement system. 5 Therefore, it is of great engineering application value to study a method for evaluating the uncertainty of surface profile error, which is suitable for small samples, does not require complex prior assumptions, and takes into account modeling accuracy and computational efficiency.
At present, systematic uncertainty solving algorithms mainly include simulation, analytical, approximation, and surrogate model. 6 Among them, although the Monte Carlo simulation (MCM) in the simulation method has theoretical universality and high accuracy, it has limitations such as slow convergence, large variance, and strong dependence on computing resources under the condition of small samples. 7 In order to overcome these problems, in recent years, researchers have actively introduced various efficient surrogate modeling techniques, such as chaotic polynomial expansion (PCE) and support vector regression (SVR), to reduce the number of samples and improve the modeling efficiency. 8 Among them, the Generalized Chaotic Polynomial Expansion (gPCE) method has attracted extensive attention because of its high computational accuracy and the ability to adapt to arbitrary probability distribution inputs. Especially in complex engineering systems with multi-source input and nonlinear response, efficient surrogate modeling methods combined with sparse sampling strategies are gradually becoming a research hotspot.
The basic theory of chaotic polynomials was first proposed by Wiener, 9 which is derived on the basis of homogeneous functions, and has a solid mathematical theoretical foundation. Due to its high computational accuracy and good versatility, the PCE method has been widely used in engineering problems. In recent years, researchers have been working to enhance the adaptability and sparsity of PCE methods in dealing with non-Gaussian distributions, high-dimensional parameter spaces, and response modeling of complex systems. For example, Cao et al. 10 proposed an optimal sparse PCE strategy for arbitrary probability distributions, which significantly improved the modeling versatility and sensitivity analysis efficiency in complex uncertain systems. Liu et al. 11 fused manifold learning and PCE methods to construct a dynamic uncertainty propagation analysis framework suitable for nonlinear active suspension systems. Sun and Wang 12 effectively modeled the uncertainty of the available transmission capacity in the power system based on the sparse PCE model. In addition, Li 13 introduced a spectral method represented by non-intrusive polynomial chaos (NIPC) to deal with the problem of “dimensionality disaster” in uncertainty quantization. These research results provide important theoretical support for the popularization and application of the PCE method in complex engineering scenarios, and also directly inspire the Adaptive Sparse Mesh PCE (ASG-PCE) method proposed in this paper to achieve efficient modeling and robust evaluation of geometric error uncertainty in freeform measurement scenarios.
Based on the above research background, this paper proposes a small-sample error uncertainty evaluation method (ASG-PCE) that combines adaptive sparse mesh and chaotic polynomial expansion. By introducing a refined matching strategy and a distributed adaptive modeling framework, this method can significantly reduce the sample requirements and computational overhead while maintaining high modeling accuracy, and has good engineering applicability and promotion potential. Firstly, the systematic error caused by the non-coincidence of the coordinate system is eliminated through the surface coordinate transformation. NURBS curve interpolation was used to fit the profile curve. The segmentation approximation method is used to evaluate the error of the surface contour deviation. On this basis, a chaotic polynomial expansion model is constructed to model the uncertainty in the measurement of surface profile error. The Adaptive Sparse Mesh Chaotic Polynomial Expansion (ASG-PCE) method was used to optimize the number of sample points and the calculation speed. Finally, taking the error detection of the outer contour of the door and the outer contour of the automobile inspection tool as practical application examples, the evaluation results are compared and analyzed by combining the GUM method and the MCM method, and the modeling accuracy and computational efficiency advantages of the proposed method under the conditions of complex nonlinearity and small samples are verified.
Surface profile error assessment
Based on the requirements for surface profile tolerance without a reference, it is divided into shape control and related feature control. When the surface profile has no reference, it is used to control the deviation of the measured surface relative to the theoretical profile. It is primarily used to control the dimensions and shape of features relative to the theoretical profile. 14 This paper mainly utilizes coordinate transformation to match the discrete point set measured on the actual machining surface with the theoretical surface point set. After coordinate transformation, the measured points are fitted with a NURBS surface, and the minimum distance from the points on the measured surface to the theoretical surface is solved using the segmentation approximation algorithm. Figure 1 is the flowchart of surface profile error assessment.

Flowchart of surface profile error assessment.
Surface coordinate transformation
Based on the ISO1101 profile error solving method, the shape error of the part must conform to the minimum zone criterion. The essence of surface profile error assessment is to continuously adjust the transformation coordinates of the measured surface to find the best transformation matrix that minimizes the maximum distance from the measured points to the theoretical surface.
Assume the set of measurement points on the actual surface is
Given

Surface fitting
Since the measurement points of freeform surface parts are distributed as discrete numerical points, it is necessary to parameterize these points to reconstruct the surface for profile error assessment. NURBS surfaces possess characteristics such as local support, affine invariance, strong convex hull property, variance reduction, and local modifiability, 15 enabling interactive display and control of complex surface shapes. NURBS surfaces are a generalization of Bezier surfaces and non-uniform rational B-spline (NURBS) surfaces, and are defined as follows 16 :


Where
Surface profile error calculation
The profile error


This paper uses a segmentation approximation algorithm to iteratively calculate the shortest distance from points on the reconstructed surface to the theoretical surface. It can quickly locate candidate regions and progressively approximate the true nearest point. 17 The computational steps are as follows:
Step 1: Set the initial parameters: segmentation count
Step 2: Calculate the Euclidean distance from the measurement point to each grid point

Step 3: Record the minimum distance value
Step 4: Further subdivide the neighborhood into
Evaluation of uncertainty in surface profile error
Evaluation of uncertainty based on polynomial chaos expansion method
During actual surface profile error measurements, factors such as measurement experience and the method for calculating surface profile errors can significantly influence the final results. 18 Traditional Monte Carlo methods (MCM), due to their high computational costs, are difficult to meet the real-time requirements of precise measurements. To address the uncertainty in measurements of complex surface profile errors under small sample conditions, the gPCE method models the entire measurement process as a stochastic process. Based on the probability density distribution functions of the input parameters, suitable orthogonal basis functions are chosen, and the output of the stochastic process is expanded in the spectral space formed by these basis functions. This transforms the problem into determining the coefficients of orthogonal polynomials in the spectral space.
The polynomial chaos expansion method 19 is, in principle, more computationally efficient than the MCM method because the computational cost is directly related to the order of the desired polynomial expansion. This method uses spectral space orthogonal decomposition, making it highly efficient. In this paper, based on the gPCE method, measurement error responses are constructed as polynomial expansion models of the measurement process using different groups of measurement errors as random variables.
First for the input sample of random error variables,


Where
For each independent random input variable, the multivariate basis functions are the product of univariate basis functions. The basis functions are chosen based on the probability distribution of the input variables to satisfy their orthogonality. Different types of orthogonal polynomials for various distribution types are shown in Table 1:
Orthogonal polynomials for different distribution types.

Considering that actual analysis of the measurement process uncertainty cannot compute an infinite polynomial expansion, the polynomial expansion in equation (6) is truncated to reduce computational effort while maintaining a certain level of error calculation accuracy. This is achieved by limiting the total order of the polynomial to

The truncated gPCE is denoted as:

Where
The key of the gPCE method is to solve the polynomial coefficient


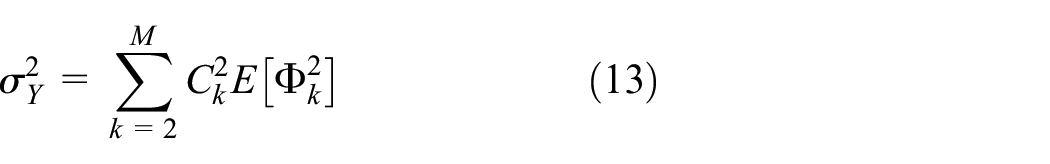
The statistical measure of the surface profile error measurement uncertainty for the profile contour is given by the mean and variance as:

Adaptive sparse grid polynomial chaos expansion-based uncertainty quantification method
Due to the computational efficiency issues of the polynomial chaos expansion method, which can easily lead to the “curse of dimensionality” in high-dimensional uncertainty quantification problems, 20 this method employs the Smolyak sparse grid method to compute the multi-dimensional matrix in equation (10) using a small set of nodes. These nodes generate standardized points and weights through integration. By using Cholesky decomposition to handle variable correlations, the method generates independent space integration points. These points are then combined efficiently through tensor products or sparse grids on each single variable, integrating the covariance structure to ensure that each integration point correctly reflects the structure of the multi-dimensional distribution. This approach enables the accurate assessment of the statistical properties of the measurement error in surface profile uncertainty. The method avoids the exponential increase in integration points with dimensionality, significantly reducing the computational complexity of high-dimensional integrals and enhancing the computational efficiency for high-dimensional uncertainty quantification problems.
First, based on the statistical moments of the input random variables, construct the Hankel matrix

In the equation,
Using the elements of matrix, derive the three-term recurrence relation and recurrence coefficients for the orthogonal polynomials:

Among which
Construct the tridiagonal Jacobi matrix

In the equation,
The integration points

Among which
To avoid the dimensionality curse associated with traditional tensorial integration, the Smolyak sparse grid algorithm is employed, combining different precision one-dimensional integration rules. The multi-index combinations that satisfy the precision parameter
At this point, a one-dimensional orthogonal rule sequence

In the equation:
Based on the tensor product operation of the sparse grid, the expansion coefficients
The polynomial base functions

The polynomial base functions
Solving chaotic polynomial uncertainty quantization coefficients based on the maximum entropy method
Traditional polynomial chaos expansion methods solve linear equations, leading to a computational complexity that grows exponentially with dimensionality. This paper innovatively introduces the maximum entropy principle,
21
directly extracting the statistical moments of the response
Based on the maximum entropy method, formulate a constrained optimization problem:


In the formulation:
This method avoids solving high-dimensional linear equations and directly reconstructs the probability density function from the statistical moments, significantly enhancing the computational efficiency. From this, relevant statistical parameters of the probability distribution can be directly extracted:
Expected value and variance:


Experimentation and comparative validation
Measurement programs and sampling strategies
This experimental measurement was conducted using a fully automatic three-coordinate measurement machine, the Leitz NCA8106. The experimental environment met the national standard requirements. The outer contour of the full-size inner and outer panel structure car door was sampled and measured (Figure 2). A uniform distribution sampling method was used, and 40 measurement points were selected from the outer contour according to the ISO 1660-2017 surface profile measurement standard, ensuring uniform and complete coverage of the measurement points, as shown in Figure 3.
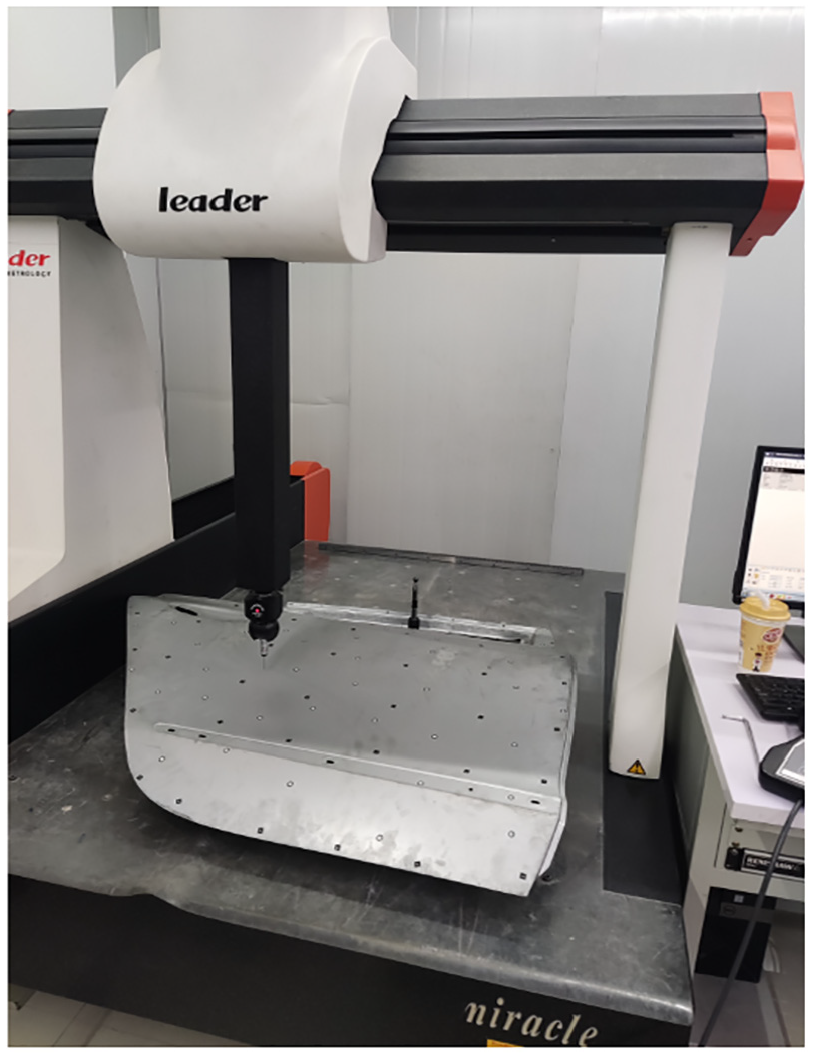
Measurement process of the car door outer contour surface.
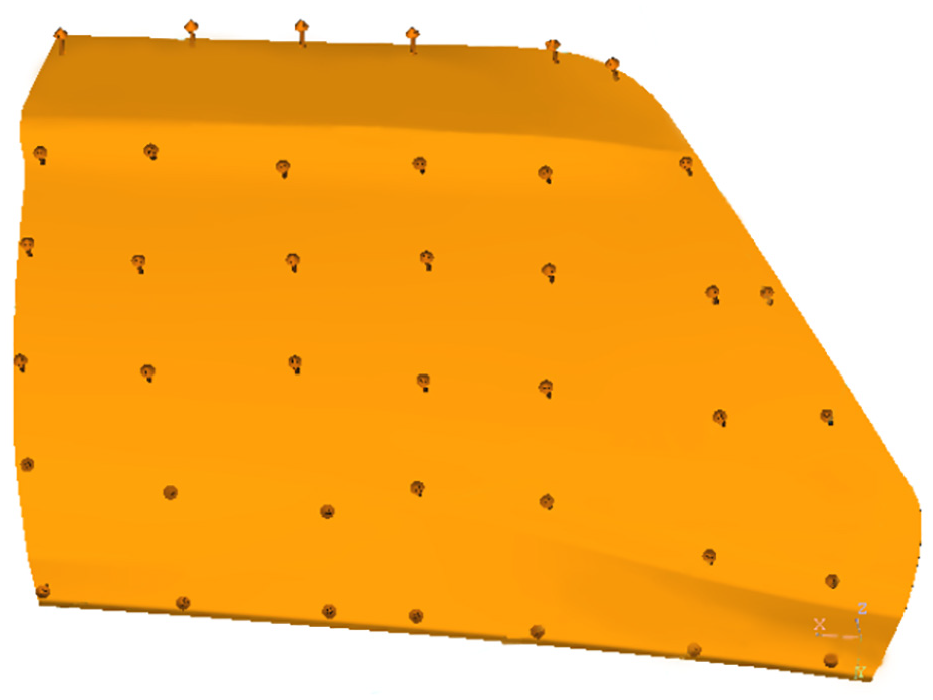
Measurement point distribution map.
The same experimenter and the same experimental environment were used to measure the car door five times, resulting in 40 × 5 coordinate points on the car door surface profile. A portion of the measurement data is shown in Table 2, while the remaining measurement data is not listed here.
Measured data from the three-axis coordinate measuring machine (Part) mm.

Surface contour error evaluation
The transformation matrices are applied to the Table 2 measurements using equation (1). The transformation matrices


By applying the transformation matrix, we obtain the set of analysis measurement points
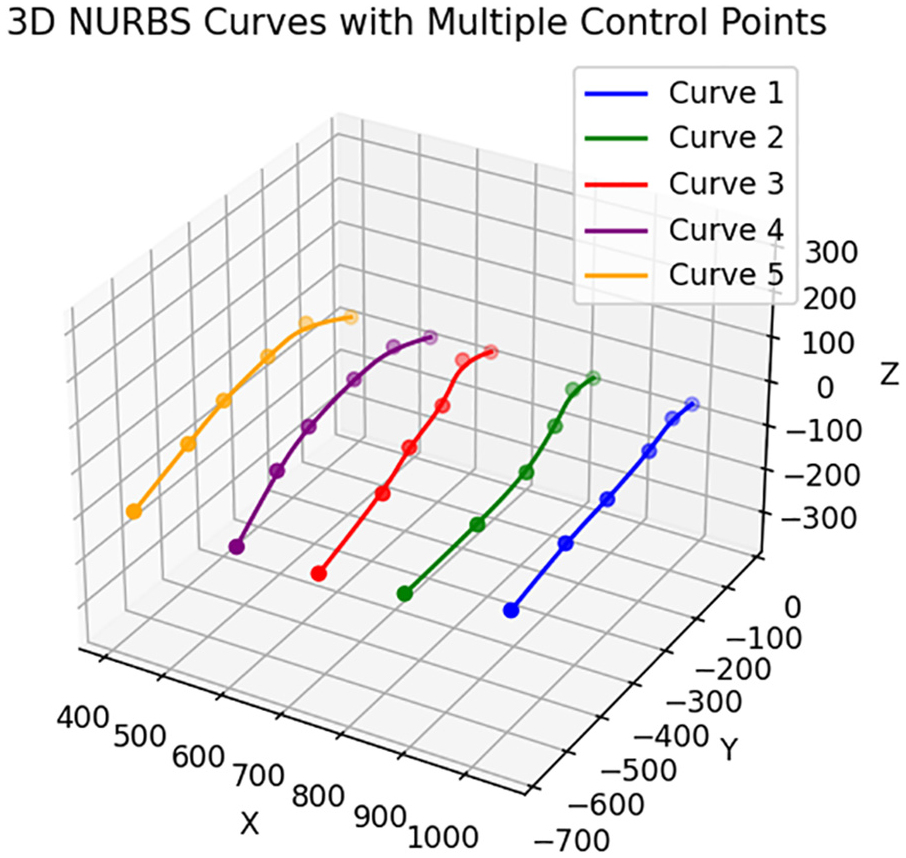
Third degree NURBS fitting curve.

Third degree NURBS fitting surface.
According to the segmentation approximation method described in this paper, the surface profile error was calculated. The data for the surface profile error is shown in Figure 6. By analyzing the profile error data and using equation (5), the minimum distance for one group of measurement points can be calculated as 0.0345 mm. Using the same method, the evaluation results for five groups of measurements were calculated and are shown in Figure 6.

Data information chart of surface profile error.
Uncertainty evaluation result comparison and verification
To investigate the accuracy and efficiency of the improved polynomial chaos expansion method (ASG-PCE) for evaluating the measurement error and uncertainty of surface profile errors, the surface profile error sample distribution of the car door outer surface was evaluated using the national standard method GUM and MCM, as well as the traditional polynomial chaos expansion method (PCE) and the method proposed in this paper (ASG-PCE). The evaluation results and computational efficiency were then compared and analyzed to verify their accuracy and efficiency.
Uncertainty evaluation of surface profile error based on GUM and MCM
GUM is the internationally recognized method for evaluating measurement uncertainty. Considering the sources of uncertainty for surface profile errors, the single-point uncertainties caused by each component are calculated. 22 First of all, the measured data of the three-coordinate measurement of the car door is taken as an example to calculate the influence of each factor, and the results are shown in Table 3.
The uncertainty component

The uncertainty component

The uncertainty component

Uncertainty component
Results of uncertainty assessment of GUM components.

The amount of deformation caused by the measured force:
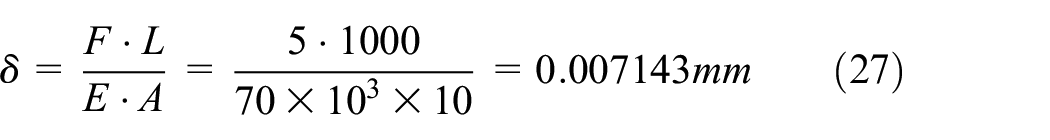
The force deformation error obeys a uniform distribution and its uncertainty is

Linear expansion coefficient calibration errors and their uncertainties:


For the above single-point uncertainties, the standard uncertainty

The GUM method was used to synthesize the uncertainty of each parameter into the standard uncertainty. Select the confidence level
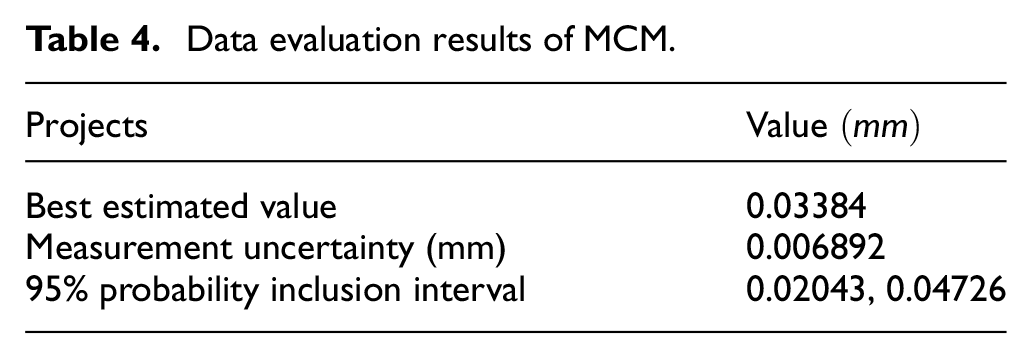
MCM stands for Monte Carlo Method, which is one of the commonly used methods for the uncertainty evaluation of geometric errors. It is primarily based on numerical analysis techniques that do not require assumptions about the distribution of input variables, relying on large-scale random sampling to approximate the true probability distribution. Here, MCM is adopted as the reference method in this study. The error measurement values’ probability distribution for the door experiment is calculated using the MCM method. The input values for the surface profile error are set to a normal distribution with 95% coverage probability. The number of runs for a single batch of uncertainty evaluation is 105, and the results from multiple runs are shown in Figure 7. The output includes the mean and standard uncertainty (Table 4).

Histogram of probability distribution and distribution curve of MCM method.
Data evaluation results of MCM.
Measurement uncertainty assessment of surface contour error based on gPCE
To investigate the accuracy of the polynomial chaos expansion method (gPCE) in evaluating the uncertainty of small sample surface profile data, the measured five groups of surface profile measurement errors are used as sample input values for the gPCE method. For the first group of data, first, the K-S test is used to verify whether the measurement error data follow a normal distribution. The null hypothesis
Subsequently, we analyzed the distribution of the surface profile error data of the first group, and found that the data were relatively uniformly distributed within the range of its values, with small fluctuations and no obvious skewness or kurtosis characteristics, showing a typical homogeneous distribution characteristics. In the absence of sufficient prior knowledge, using a uniform distribution of the maximum uncertainty in the known range as the input distribution for modeling can avoid the introduction of model bias due to overfitting or subjective assumptions. In addition, uniform distribution has high numerical stability in the construction of sparse meshes, which is suitable for the selection of generalized polynomials in chaotic polynomial expansion.
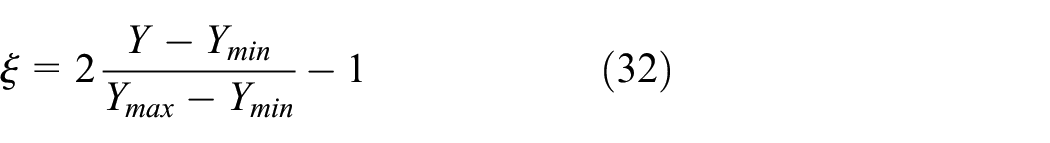
Assuming that the surface profile measurement errors are approximately uniformly distributed, the original data are mapped to the interval

The order
Based on equations (10) and (11), solve for
The actual error measurement sample distribution is often not only uniformly distributed, but the error distribution is the four standard distributions of normal distribution, uniform distribution, and Beta distribution. Therefore, in order to explore the dependence of the surface profile error uncertainty evaluation model proposed in this paper on the measurement error distribution, the mean errors of the surface profile calculated by the coefficient C values of the chaotic polynomial coefficients in normal distribution, uniform distribution, triangular distribution, and Beta distribution calculated by Table 1 and equation (19) are 0.033923, 0.033952, 0.033952, and 0.033900, respectively. Although there is a large difference between different distributions, the contour error value changes little after the basis function selected according to the distribution, which indicates that the model has little correlation with the distribution of the measured samples, and the method does not rely on the specific input distribution assumption, and can maintain high accuracy even under the condition of no distribution assumption.
Based on the polynomial coefficients, the statistical uncertainty quantities can be determined. This section evaluates the measured five groups of data using the polynomial chaos expansion method, and the evaluation results are in Table 5:
Rating results of gPCE method under different measurement sample groups.

Measurement uncertainty assessment of surface contour error based on ASG-PCE
This study constructs a polynomial coefficient matrix based on measured data and performs
Based on the
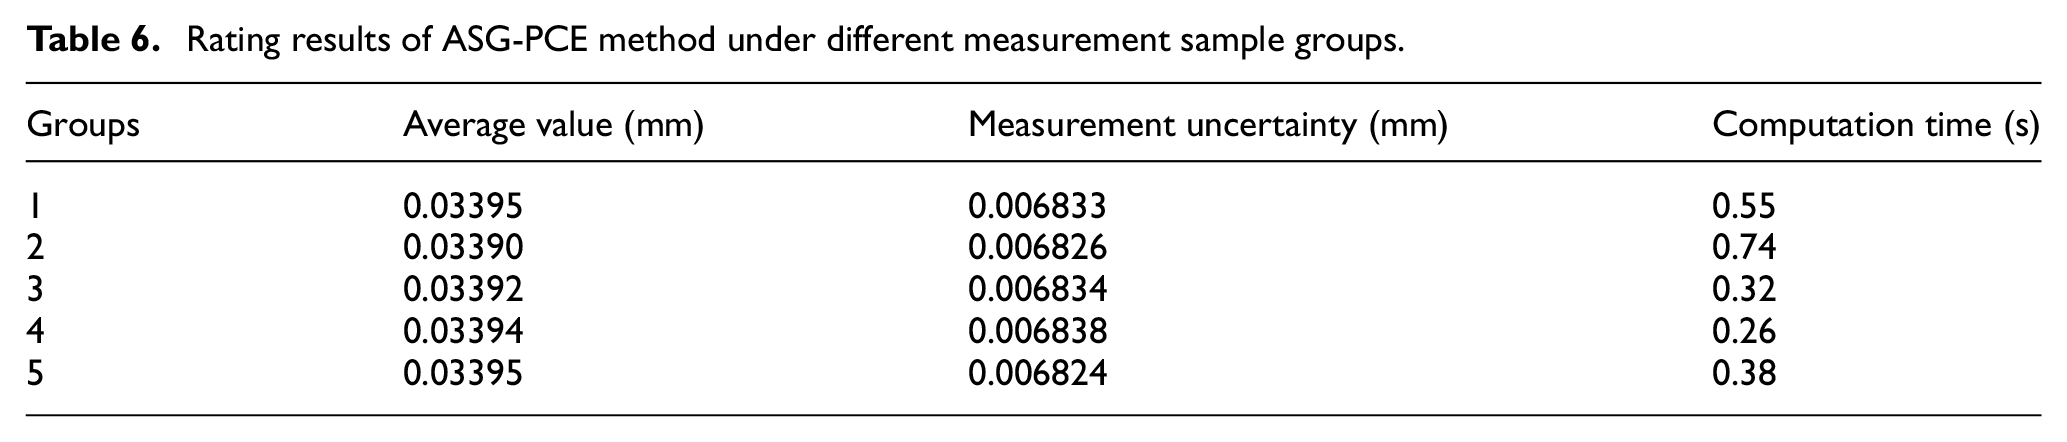
First, input
Rating results of ASG-PCE method under different measurement sample groups.
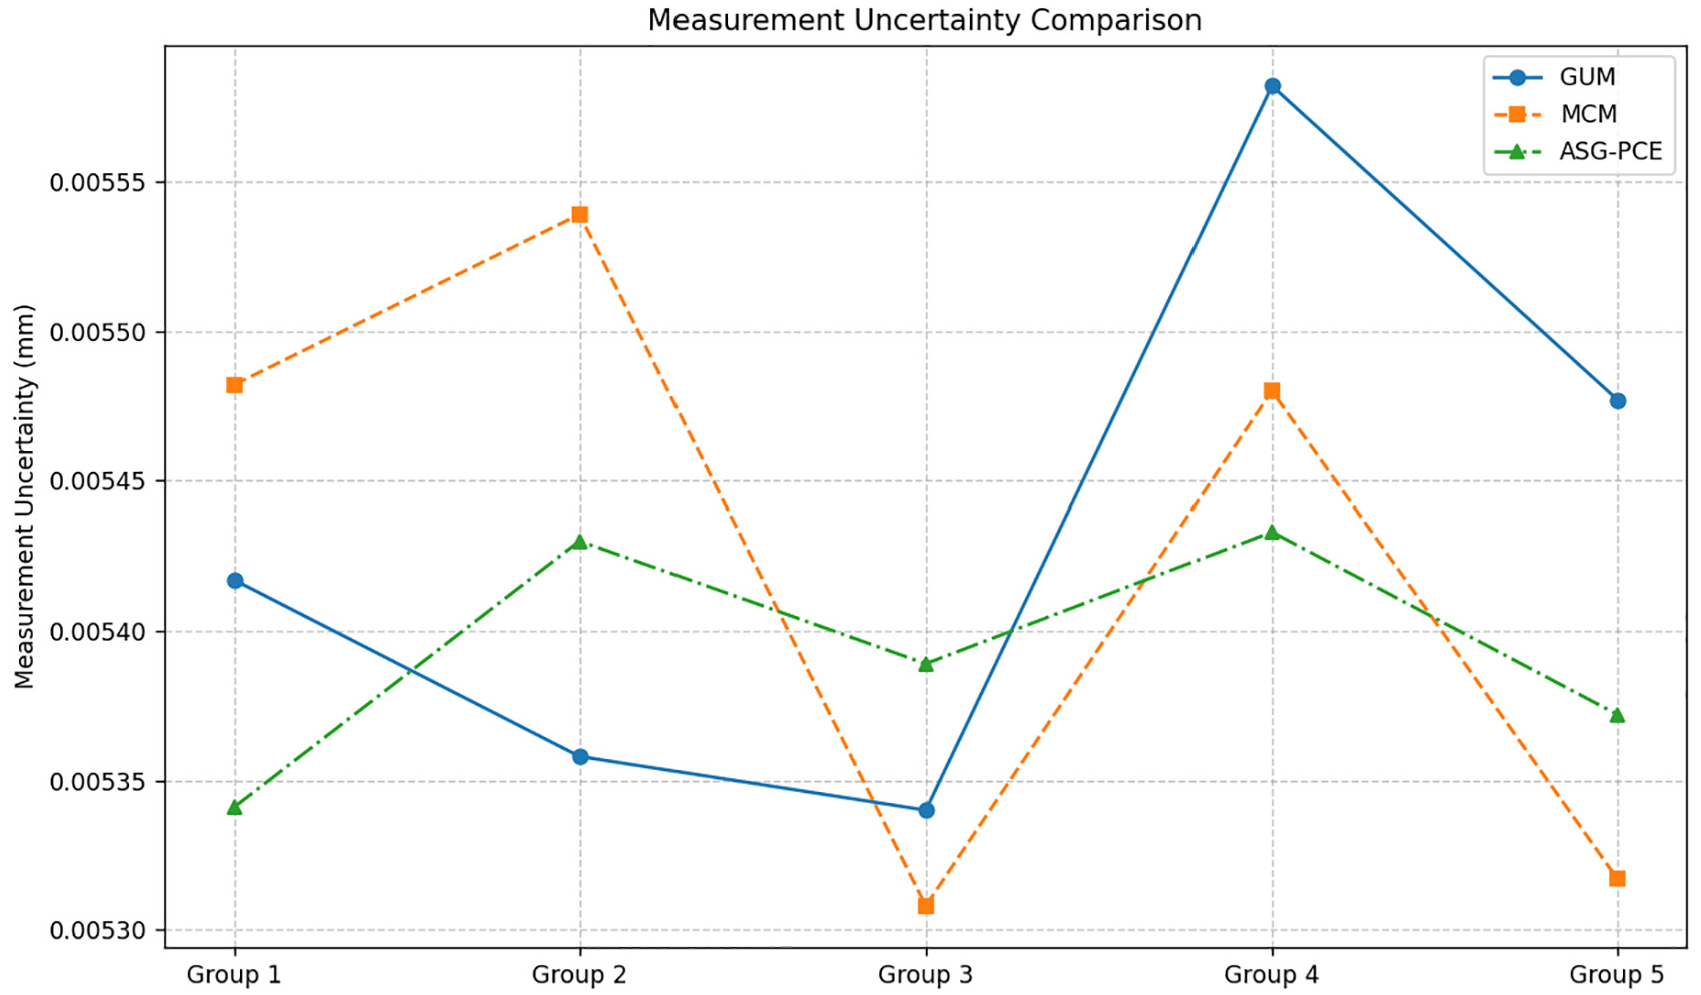
According to the numerical calculation results of the uncertainty of the measurement error of five groups of car door outer contour by using the GUM method, the MCM method, the PCE method and the ASG-PCE method in Figure 8, the evaluation results of the ASG-PCE method are more stable than those of the GUM method, and the evaluation results of the MCM method fluctuate greatly and the accuracy of the evaluation results is lower. According to the comparison of the above results, when the measurement sample size is small, compared with the GUM method and the MCM method, the uncertainty evaluation accuracy and stability of the chaotic polynomial expansion method on the surface profile error are higher. When the number of sample groups is small and the probability distribution is irregular, the adaptive sparse chaotic polynomial expansion method can best fit the uncertainty assessment under the real situation, and the evaluation results are stable and reliable, and the calculation accuracy is high.

Comparison of measurement uncertainty evaluation results of different methods.
As can be seen from Table 7, the gPCE method and the ASG-PCE method can significantly improve the calculation efficiency while ensuring the accuracy of the uncertainty evaluation error of the surface profile measurement of the free-form surface, taking the evaluation results of the GUM method and the MCM method as reference. Among them, the ASG-PCE method further reduces the number of samples required to only 40 points and shortens the computation time to 0.45 s through the adaptive sparse grid construction and maximum entropy sampling optimization strategy, which is effectively reduced in computation time compared with the MCM method (using 105 points and taking 4.68 s). While taking into account the modeling accuracy, this method significantly alleviates the problem of “dimensionality disaster” in small-sample and high-dimensional scenarios, and effectively improves the efficiency of uncertainty evaluation. It provides a theoretical tool for evaluating the measurement error uncertainty of free-form surface profiles in complex nonlinear small sample situations.
Uncertainty evaluation indexes of surface contouring error under different methods.

In order to further explore the influence of sample size change on the evaluation performance of ASG-PCE method, this paper takes the external contour error data of the door as the research object, and sets the sample size of 5–80 groups for simulation calculation. Figure 9 illustrates how the ASG-PCE method varies under different sample sizes.
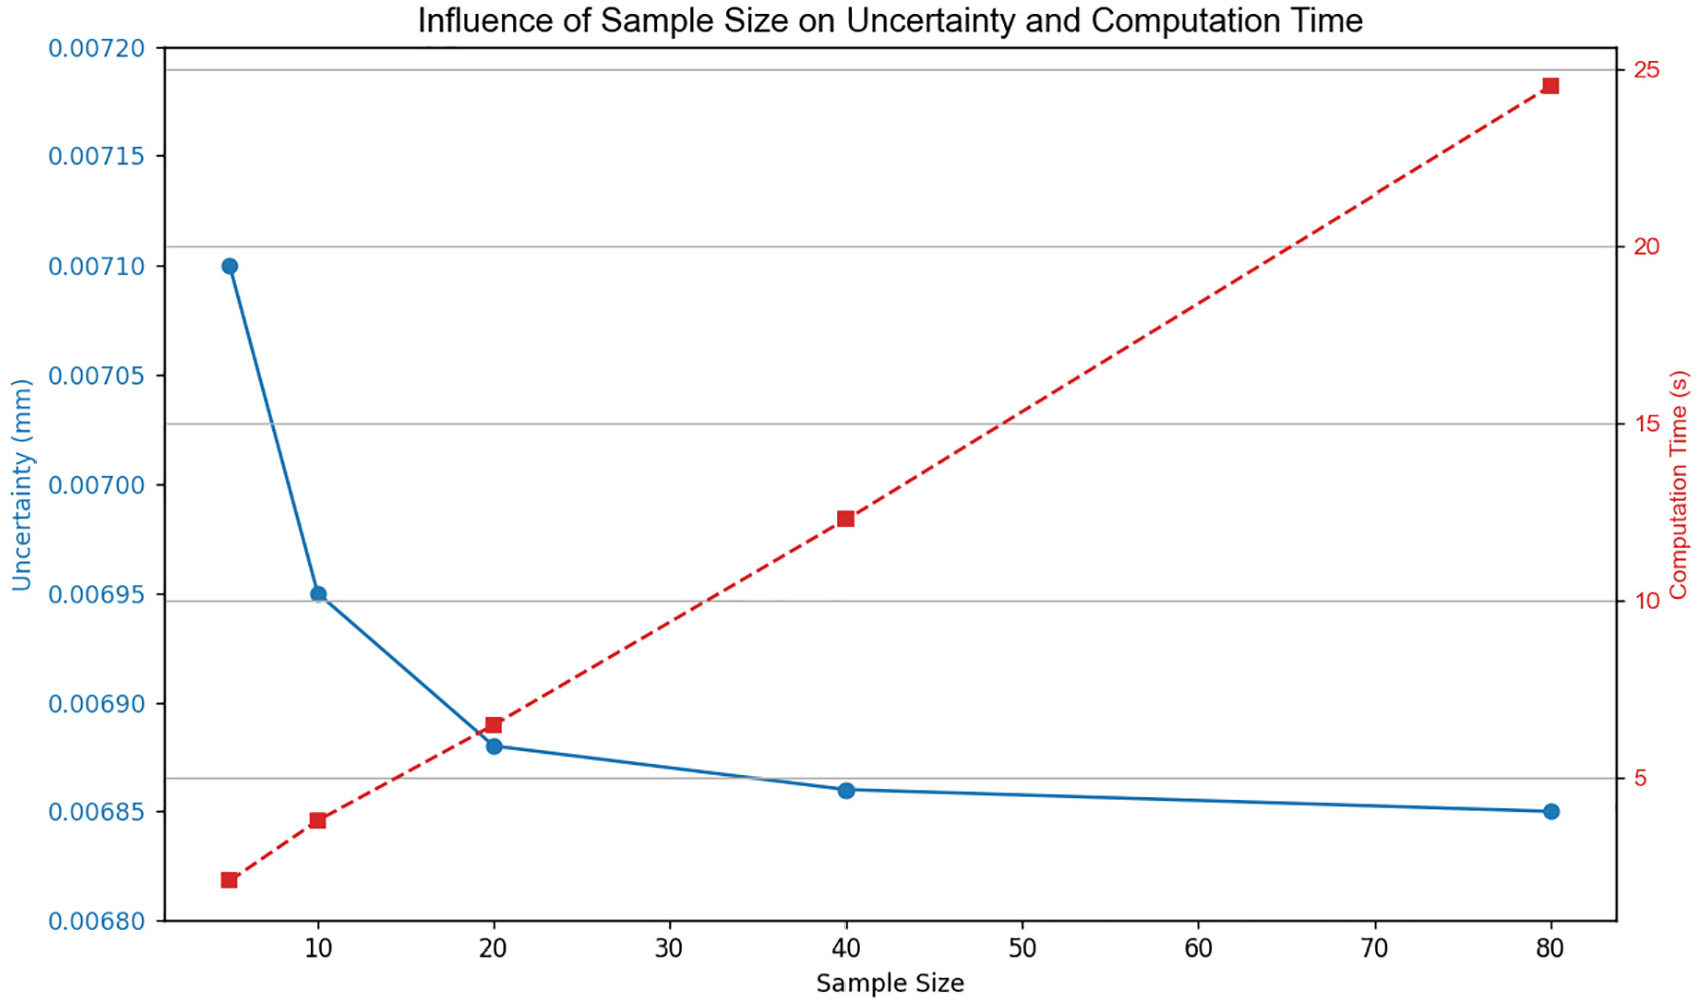
The results of ASG-PCE method under different sample sizes.
The figure shows that as the sample size increases from 5 to 80, the improvement trend of the ASG-PCE method in accuracy gradually stabilizes, indicating that it has good convergence. Compared with the MCM method, ASG-PCE can obtain more accurate uncertainty estimation results under small sample conditions, and shows higher sample utilization efficiency. In terms of computational efficiency, the ASG-PCE method always maintains a low computational time over the entire sample size variation range, especially in the case of small sample size, and its computational time is significantly lower than that of the traditional MCM method, which verifies its good balance between efficiency and accuracy. This is mainly due to the adaptive control of the sample number in the high-dimensional parameter space of the sparse mesh construction, which effectively avoids the sample dimension disaster. With the increase of the sample size, the evaluation results are further stable and the computational cost increases slowly, showing good convergence and practicability, especially suitable for engineering scenarios with limited measurement data but high requirements for uncertainty evaluation accuracy and efficiency.
Measurement uncertainty of surface profile error for spherical regular surfaces
In order to further verify the applicability of the ASG-PCE method proposed in this paper to evaluate the uncertainty of the surface profile measurement error of other surfaces in the actual engineering measurement scene, the Layton NCA8106 automatic coordinate measuring machine was used at a laboratory temperature of 20°C to measure the spherical regular surface of the outer contour of JZQA20-10, the standard part of the automobile testing instrument, and 40 measurement points were selected to be evenly distributed on the outer contour surface, and the sampling point distribution was shown in Figure 10, and the measurement was repeated five times.

Measurement process and measurement point distribution diagram of the outer contour surface of the automotive reference part JAQZ20-10.
According to the coordinate measurement of the measuring points, the transformation matrices R and T were applied. The coordinate values of the measurement points were transformed using equation (1) with the matrices:

Third NURBS fitting surface of the outer contour of the automotive reference part JAQZ20-10.
The computed maximum normal distance from the measurement points to the theoretical surface was 0.005428 mm, and the minimum distance was 0.001322 mm, yielding a surface profile error of 0.004106 mm. The results for all five measurement groups are detailed in Table 8.
Evaluation results of contour error of standard parts of automobile inspection tools.

ASG-PCE method, GUM method, and MCM were used to evaluate the uncertainty of the surface profile error measurement with benchmarks, and the evaluation results are shown in Table 9 according to the above five groups of surface profile error evaluation distributions.
Evaluation indexes of the uncertainty of the contour error of the standard part surface under different methods.

The ASG-PCE method, GUM method, and MCM method were used to evaluate the uncertainty of the measurement error of the surface profile experimental measurement data, and the line comparison chart of the evaluation results is shown in Figure 12, and the fluctuation range of the evaluation results of the ASG-PCE method is significantly smaller than that of the MCM method, which shows stronger convergence and numerical stability in the uncertainty evaluation. Furthermore, it can be seen from the figure that the stability of the ASG-PCE method in the evaluation results is better than that of the traditional Monte Carlo method, which indicates that the method can still maintain a stable evaluation ability under the condition of small sample independent testing, and improve the consistency and reliability of the uncertainty evaluation results of surface profile error measurement.
Comparison diagram of the measurement error uncertainty of the standard parts of automobile inspection tools under different methods.
Taken together, these results further verify that the ASG-PCE method not only performs well under complex surface profile evaluation conditions, but also has high accuracy and robustness in modeling and evaluating the uncertainty of regular surface profile error measurement, which fully demonstrates its application potential in complex engineering measurement scenarios.
Conclusion
This study proposes an uncertainty evaluation model for geometric errors based on adaptive sparse grid polynomial chaos expansion, achieving efficient and high-precision uncertainty evaluation of free-form surface profile errors under conditions of small sample measurement points. Through experimental verification and comparative analysis, the following conclusions are drawn:
Compared with the traditional GUM method and MCM method, the ASG-PCE method shows more stable measurement uncertainty estimation results, smaller error fluctuations, and stronger fitting ability while maintaining the consistency of the evaluation mean, especially suitable for small samples, non-normal distribution or “black box model” input scenarios.
Compared with the MCM method, which requires a large number of sample points (105 samples are required), the ASG-PCE method can obtain similar or even better evaluation results with only 40 sample points, and the calculation time is only 0.45 s, and the average calculation time is effectively reduced. At the same time, compared with the conventional gPCE method, it is further optimized in terms of the number of sample points and calculation time, and has stronger high-dimensional adaptability.
By deeply integrating the Smolyak sparse grid algorithm with the maximum entropy method, this study achieves efficient quantification of surface profile error uncertainties. This method provides theoretical tools and technical support for high-dimensional uncertainty analysis in precision manufacturing and optical inspection of complex shapes, with significant engineering application prospects.
On this basis, we will further study the adaptive precision parameter selection strategy and the non-parametric maximum entropy optimization algorithm to improve the robustness of uncertainty modeling under high-dimensional and complex distribution input conditions, and explore the applicability and scalability of the method under dynamic error evaluation and unsteady state measurement conditions.
Footnotes
Handling Editor: Shun-Peng Zhu
Funding
The author(s) disclosed receipt of the following financial support for the research, authorship, and/or publication of this article: This work was supported by the Shanghai Association for the Promotion of Scientific and Technological Achievements (LM2018-5), the project of the Shanghai Institute of Technology (XTCX2022-15).
Declaration of conflicting interests
The author(s) declared no potential conflicts of interest with respect to the research, authorship, and/or publication of this article.
Data availability statement
The data used to support the findings of this study are included within the article, and further data or information can be obtained from the corresponding author upon request.