
Abstract
The excellent strength-to-weight ratio of composites is why they are widely used in different industries. However, these components are susceptible to damage and deterioration after prolonged use and loading, making repairing rather than replacing them economically viable. The research is being carried out to evaluate a repair technique for composite structures by resin injection through the damaged area. This experiment fabricated composite specimens with eight resin layers in the (0/0/90/90)s sequence using unidirectional glass fiber and epoxy resin by vacuum-assisted resin injection. The diameter of the drill was 7 mm to make the damage more realistic. The hole was damaged around the periphery of the hole. The specimens were divided into three groups: two groups were subjected to low cycle fatigue, and one of the specimens was repaired using resin injection techniques. As for the third group, all of them were subjected to the three-point bending test and the results were compared to check the effect of the resin injection repair method on the fatigue strength. Acoustic emission (AE) was used to investigate and classify the damage mechanisms. The repair technique proved to be very effective in restoring the compressive mechanical properties of the specimens, as the recovery rates were 93% and 86% for the (0/0/90/90)s and (90/90/0/0)s lay-up sequences, respectively.
Introduction
The automotive and aerospace industries are seeing more and more use of composites since they are stiffer, stronger, and better at damping than metals. The composite materials mostly involve a polymer matrix made up of thermosets or thermoplastics and then reinforced by continuous fibers of glass or carbon. In this context, the replacement of conventional materials with GFRP (glass fiber-reinforced polymer) composites can achieve weight reductions of up to 20%–35%. On the other hand, the use of CFRP (carbon fiber-reinforced polymer) composites can achieve weight reductions of 40%–65%.1,2 The most common damage mechanisms encountered in composites are fiber-matrix debonding, matrix cracking, delamination, and fiber breakage.
Recent advancements have shown that the incorporation of nanofillers, such as multi-walled carbon nanotubes (MWCNTs) and graphene nanoparticles (GNPs), into GFRP composites can lead to substantial improvements in mechanical properties. Specifically, the addition of 0.2% MWCNTs and GNPs has been reported to enhance compressive strength by 80% and flexural strength by 62%. 3
There are several repair methods for composite materials. By doing so, they will encourage people to adopt healthier habits and reduce their risk of chronic diseases.
Bolted patch repair is an older method of repairing metal structures.4,5 This technique implies that holes are drilled into the part, and the composite layers are fastened with bolts on either side, one or two of them. When dealing with components that undergo drilling, an increase in weight is typically observed. It’s important to consider that the holes created during the drilling process can serve as focal points for stress concentration. This stress concentration can potentially lead to further damage to the component.
Scarfing Repair Method is the technique of removing the damaged area along with its surroundings at a shallow angle, which produces a trough. Another element that is added to the structure and bonded to the structure with the adhesives is a piece of trough. 6
The Composite Patch Repair Method is another method of repairing of metal and composite structures. Although this method is investigated by other researchers, 7 it primarily enhances the strength of the structure rather than repairing the damaged zone. Recent studies have highlighted that the efficiency and durability of composite patch repairs are significantly influenced by parameters such as adhesive properties, patch geometry, and environmental conditions. 8
The characteristics of composite materials allow for different behaviors under stress. Even if a composite starts with an initial crack, its development under repetitive loading varies; it might either grow or remain unchanged. Particularly in composites that are very uneven in structure with a high-volume fraction (VF) of fibers, cracks tend not to spread across the fibers. Instead, they may bypass the fibers altogether, sometimes neutralizing the crack’s impact when it intersects with them. Acoustic emission testing is utilized in various ways today, including:
Detecting diverse damage mechanisms in materials such as crack propagation, material creep, fatigue, structural failure, and the breaking of fibers and matrix within composites.9–13
Conducting regular inspections of engineering structures.14–16
This research is essential as it is less expensive to replace the components that have been subjected to cyclic loading than to replace them. Thus, the resin injection repair method17–20 was researched, which is not only less expensive operationally but also more operationally effective. The first step was to identify the damage, and then the resin injection method was applied to the layers where damage was expected. Recent studies highlight that resin-injection repair involves drilling vent and injection holes into the damaged composite area, followed by injecting resin to restore structural integrity. However, finite element analysis has shown that high stresses develop at the edges of these holes, which may interact and affect the composite’s mechanical behavior under loading. 21 Comparative studies have demonstrated that the resin injection repair method can restore up to 93% of the original bending strength in delaminated composite laminates under flexural loads, outperforming micro-bolt repair techniques, which achieve up to 70% strength recovery. 20 Recent studies on stitched composites have shown that acoustic emission (AE) techniques effectively characterize damage evolution under flexural loading. A high stitch density weakens flexural strength due to increased stitch defects but enhances residual strength by improving bonding between fabric layers. AE monitoring revealed that a rapid increase in cumulative AE energy signals the onset of severe damage, with variations in stitch density influencing the first moment of this energy increase. For example, at a stitch density of 4 × 4 mm, the first rapid increase in cumulative AE energy was observed at 128 s, while at lower stitch densities of 8 × 8 mm and 12 × 12 mm, it occurred at 175 and 178 s, respectively. This highlights the role of stitch density in damage evolution and structural integrity. 22 This result can be confirmed by the received signals. This research, following the analysis of the signals obtained, was carried out by injecting resin in the hole sectors where the maximum damage was expected as they had been identifiable from previous studies. This technique also includes hole drilling, just like the patch replacement method. The hole is created in different ways, for instance, by vacuum holes and by using an entry and an exit hole where resin injection takes place through one hole, and the injection process is completed through the other hole. The patch repair method has a high chance of crack formation around the hole due to the pressure. On the other hand, the injected resin and the resultant pressure fill any potential cracks so that no defects are introduced during the repair process.
Considering previous research, it can be concluded that the resin injection repair method has not been previously studied for evaluating fatigue strength after low-cycle fatigue testing, and the induced defects have been artificial. However, in this research, the defects are introduced naturally.
Due to the harsh operational environments that composite structures often experience, the resin injection repair method has been developed for composite structures subjected to high temperatures.
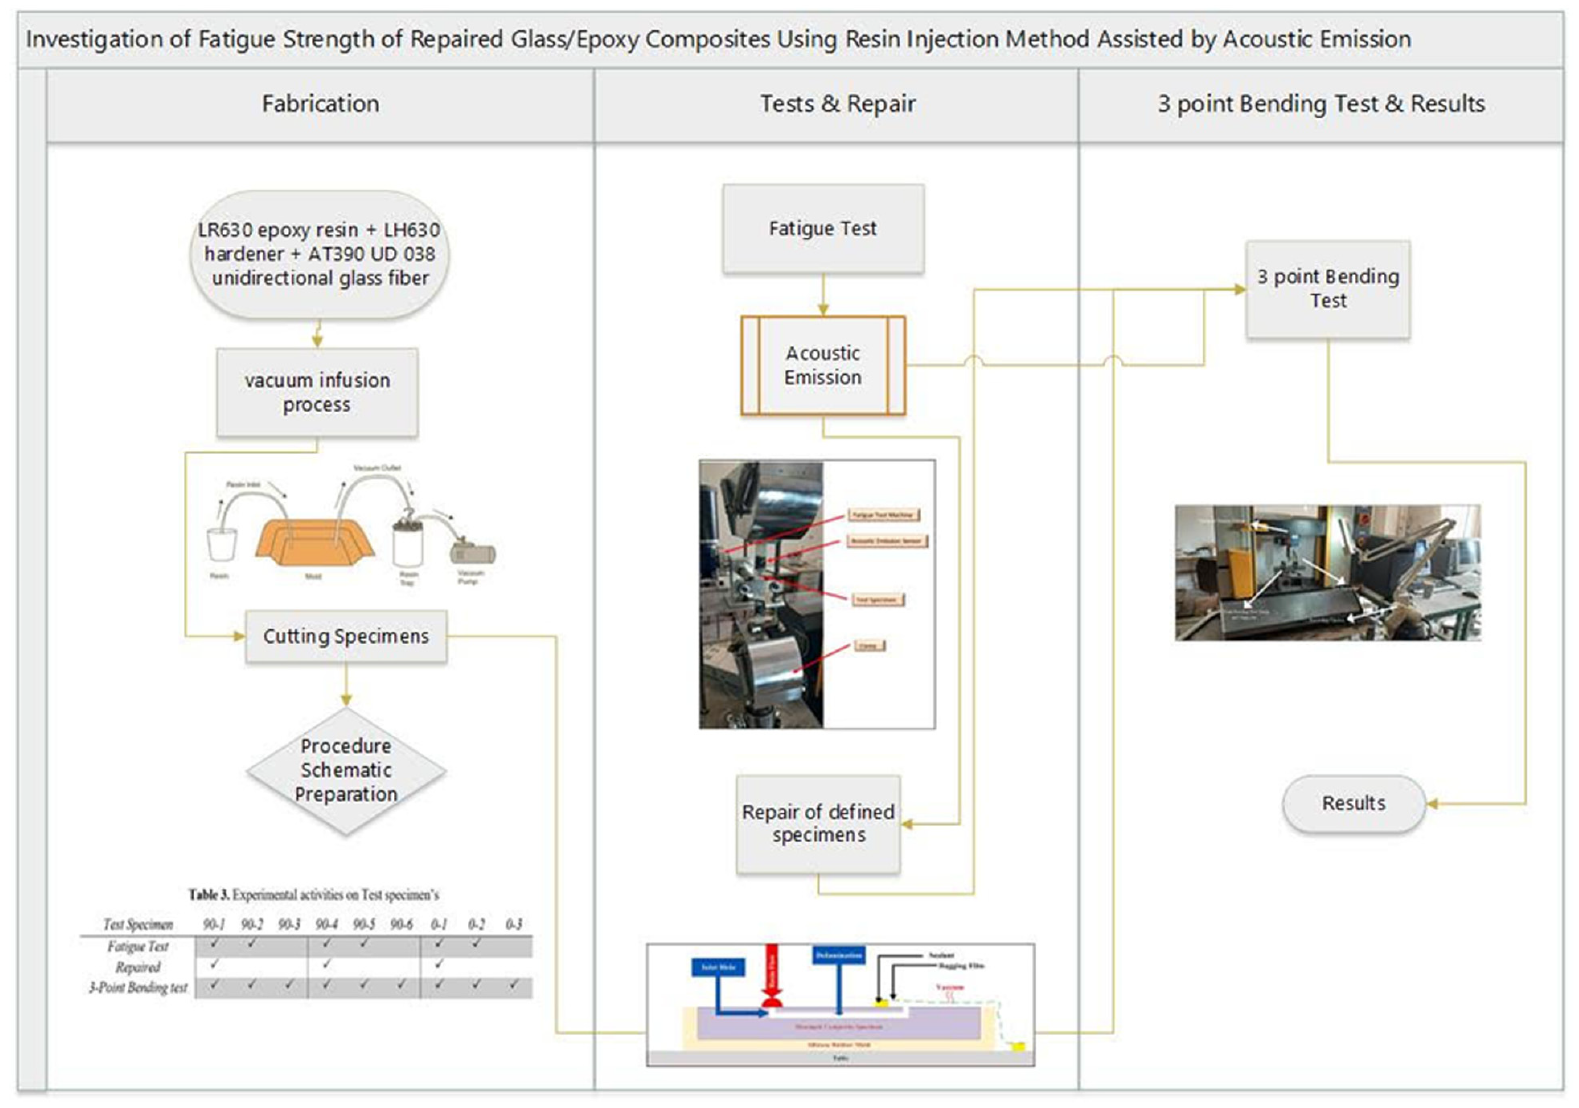
The composite samples were fabricated in the laboratory using unidirectional E-glass fibers and LR 630 epoxy resin 2 through vacuum-assisted resin injection. To induce delamination in the samples, they were drilled using a 7 mm drill bit. After sample fabrication, two groups were subjected to cyclic fatigue loading, and one group was repaired. Finally, all three groups underwent three-point bending tests according to the ASTM D790 23 standard. Additionally, acoustic emission sensors were used to investigate the initiation and growth of damage mechanisms during the fatigue testing.
By reviewing relevant literature, it can be concluded that no previous research has been conducted on resin injection repair after fatigue testing, and the induced defects have been artificial, whereas, in this research, the defects are natural. Since this research focuses on evaluating the effect of resin injection repair on fatigue strength, the samples were ultimately subjected to three-point bending tests under identical conditions.
Acoustic emission
Kaiser conducted the first comprehensive scientific study in the field of acoustic emission in 1950. 24 In addition to acoustic emission techniques, ultrasonic-based monitoring has been widely used to evaluate machining parameters and detect damage in composite and metallic materials. Studies have shown that ultrasonic-assisted machining improves surface roughness and reduces cutting forces, making it a valuable tool for enhancing material integrity and post-repair performance. 25 Green performed the first practical application of acoustic emission for structural health monitoring in 1964. 24 In 1969, Gerberich and Hartbower conducted a detailed study on slow crack growth for D6ac steel under a hydrogen atmosphere. 26 By combining AE with digital image correlation (DIC), recent studies have provided valuable insights into the mechanical behavior of bio-composites under different loading conditions. The integration of these methods enables precise detection of damage mechanisms, including fiber rotation and crack formation under shear stress. Additionally, variations in AE parameters during the Fp transition phase facilitate early identification of the maximum load transition, making AE a powerful tool for fatigue damage characterization in composite structures. 27
Acoustic emission (AE) monitoring has become an essential tool for assessing the condition of concrete and composite materials, helping engineers detect damage before structural failure occurs. Studies show that AE is particularly useful in monitoring concrete structures exposed to long-term loading and environmental degradation, offering a reliable way to assess their durability over time. 28 It has also been applied to fire-damaged fiber-reinforced concrete, where changes in AE signal characteristics indicate a loss of strength and stiffness after extreme heat exposure, with temperatures reaching 850°C. 29 Additionally, research on epoxy resin-repaired fiber-reinforced concrete highlights AE’s ability to track fracture progression and evaluate the effectiveness of repairs, especially in situations where conventional non-destructive testing methods are impractical due to construction limitations. 30 These studies reinforce the value of AE monitoring in identifying damage mechanisms, improving structural reliability, and guiding maintenance strategies.
Monitoring by acoustic emission method and its application in composite drilling
Studies on the application of acoustic emission techniques in composite failure have become the topic of many researchers’ papers. Recent research on glass fiber/epoxy composites has shown that combining acoustic emission (AE) monitoring with self-sensing materials, such as carbon nanotube (CNT) networks, provides deeper insights into how damage develops over time. By applying principal component analysis (PCA) and k-means clustering to AE signals, researchers have been able to distinguish between different failure modes, including matrix cracking, fiber/matrix debonding, delamination, and fiber breakage. Among these, fiber breakage produced the strongest AE signals, though it occurred less frequently than other damage mechanisms.
For instance, in composites with a (0/90)S stacking sequence, AE activity peaked at over 11,000 recorded events, most of which were concentrated near the final stages of failure. In contrast, unidirectional [0] laminates exhibited a more gradual damage progression, accumulating over 790,259 AE hits, with 97% of AE events occurring after the material reached its maximum stress level. This highlights how fiber orientation affects the way composites fail, making AE an essential tool for monitoring structural integrity in real time. 31
The next challenge for the acoustic emission method to be applied to composites is their non-isotropic and non-homogeneous structure that contributes to difficulty in understanding the acoustic signal due to wave propagation phenomena, such as diffraction and scattering. 32 Recent studies have demonstrated that acoustic emission, when combined with numerical simulation techniques such as the cohesive zone model, can effectively evaluate the structural integrity of composites repaired by resin injection. This approach enables real-time monitoring of damage propagation and provides a deeper understanding of post-repair mechanical behavior. 18 The most important task in AE signal processing is the separation of signal sources. Clustering is an important technique in data analysis that is a fundamental tool for data examination and interpretation. The core objective of data clustering is to divide the data into a set of clusters, each cluster reflecting information from a specific source. Godin and his research group executed the tensile test data for glass-epoxy composite to identify the failure modes. They used a mixture of SOM and k-means algorithms to classify the obtained AE signals into three separate groups. Hence, among the six time-domain parameters they selected, such as amplitude, rise time, duration, count, counts to maximum, and energy, they applied the clustering approach. The results were that the amplitude analysis of three failure mechanisms (matrix cracking, delamination, and fiber-matrix debonding) was performed. 32 Here, they utilized two types of supervised techniques and one of the unsupervised (Kohonen’s map) methods for the tensile test signals. The authors developed a hybrid approach through the use of K-means and k-nearest neighbors algorithms, which took three samples and generated three different failure mechanisms. The indicator failure modes were chosen based on the results. The parameters involve the duration of the event, the rise time, the amplitude distribution, and the number of hits. 33
Materials and experimental
Material used in the study
The materials used in this study include unidirectional glass fiber and epoxy resin, which were selected due to their widespread use in composite structures. The composite specimens were fabricated using vacuum-assisted resin injection to ensure uniform resin distribution and high fiber volume fraction (Table 1).
Materials of the experiment.

Composite fabrication
The VIP (Vacuum Infusion Process) method was used to fabricate the specimens, where the fiber layers were cut separately in predetermined sizes. The vacuum pump, tubing, and sealed bagging film indicate a controlled vacuum infusion process (Figure 1).
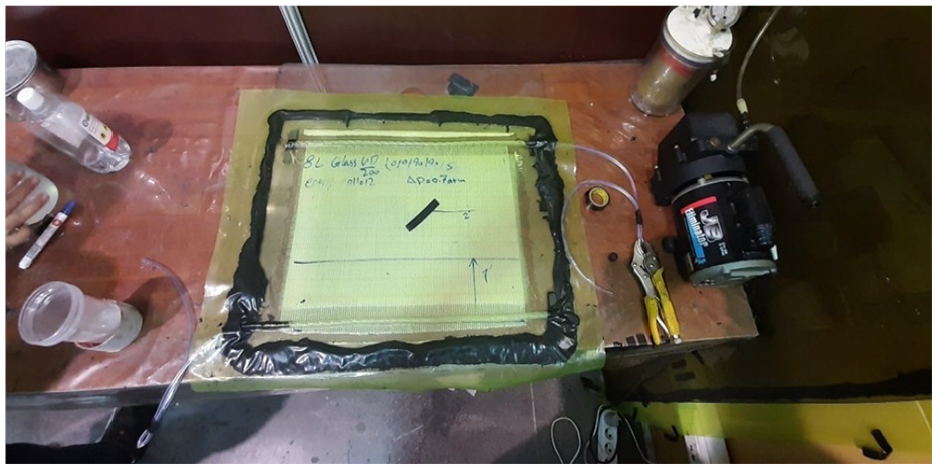
Overall view of specimen fabrication.
During this process, to prepare the composite matrix material, the epoxy resin and its hardener are mixed together in a laboratory beaker in the ratio recommended by the manufacturer (in this experiment, a ratio of 15 to 100). First, the surface on which the final specimen will be produced is thoroughly cleaned from any existing stains using a cleaning liquid (usually alcohol-based).
After completing the above activities, as per Figure 1 the fiber layers are placed on top of each other in order, and then the entire set of layers is vacuumed with special adhesives, ensuring that there are no gaps for the resin and hardener mixture to pass through.
The resin injection method was employed in the damaged area to repair specimens with delamination. In the next step, to induce further damage, the specimens were drilled with a 7 mm drill bit to create delamination. The fabricated specimens consisted of eight layers. The difference between the specimens lies in the stacking sequence.
Throughout this paper, all ply orientations are stated with respect to each coupon’s longitudinal (loading) axis. Because the coupons were cut either parallel or perpendicular to the panel 0° fiber direction, the same cured laminate (0/0/90/90)s appears as (0/0/90/90)s for the 0° coupons and as (90/90/0/0)s for the 90° coupons.
Test specimen fabrication
The dimensions of the test specimens are schematically shown in Figure 2. The specimens were prepared in accordance with the ASTM D7905 34 standard. And the dimensions of the test specimens are 20 × 160 × 1.8 mm with a bore of 7 mm in the middle.
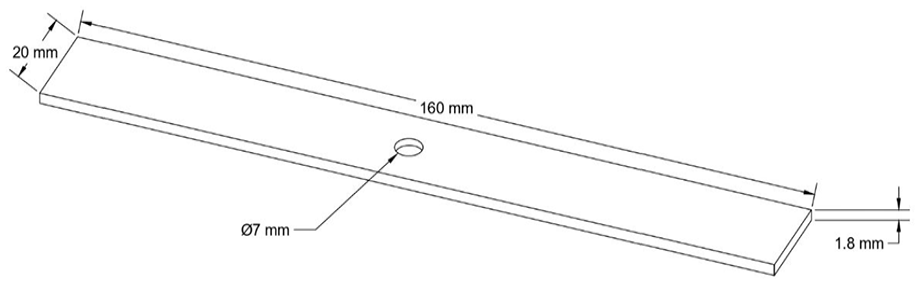
Schematic dimensions of the specimens used in the research.
Table 2 presents the specimens used in this research and stacking sequences. The Figure 3 illustrates the schematic of the specimens prepared from the main plate, which were cut using the water jet method.
Ply orientation with respect to the coupon (loading) axis.*
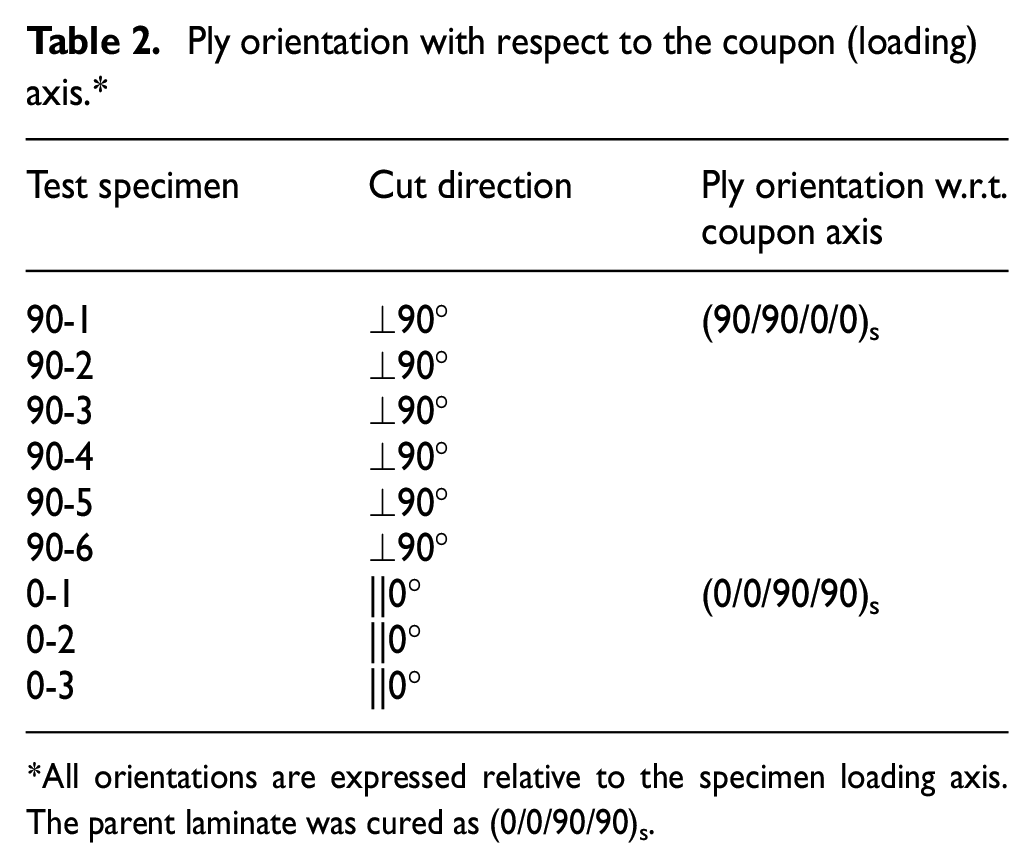
All orientations are expressed relative to the specimen loading axis. The parent laminate was cured as (0/0/90/90)s.

Test specimens with attached end tabs, prepared for fatigue testing.
Figure 3 shows the test specimens used in this study. To properly secure them in the fatigue test setup, grips were attached at both ends, ensuring even load distribution and preventing slippage during testing. To further enhance adhesion and minimize stress concentrations, end tabs—made from the same material as the specimens—were added at the gripping points. The specimens were precisely cut using a water jet to maintain accuracy and avoid any thermal damage that could affect their mechanical properties. The selected layup sequences, shown in Table 2, were designed to study how fiber orientation influences fatigue behavior (Figure 4).

Schematic and cutting location of test specimens—cut layout of tensile coupons and global fiber direction. Red arrows indicate the parent-panel 0° axis; dashed boxes show the 0- and 90-coupon families.
Table 3 demonstrates the stages of the mechanical tests, where specimens 90-1, 90-2, 90-4, 90-5, and 0-1 and 0-2 undergo fatigue testing. The bending fatigue test was conducted following ASTM D7774, 35 ensuring standardized evaluation of flexural fatigue properties. Only one set of each of these specimens is repaired by resin injection. In the next stage, all specimens undergo a three-point bending test to assess and analyze the effectiveness and recovery of the resin injection repair method on fatigued, repaired, and undamaged specimens.
Experimental activities on test specimen’s.

In this study, as mentioned earlier, nine different samples were investigated. The differences between each specimen are presented in Table 2 relative to the coupon axis. In this table, each tick mark indicates whether the sample has undergone the fatigue test, the three-point bending test, and whether it is repaired or intact. For example, specimen 90-2 underwent the fatigue test and the three-point bending test but was not repaired using the resin injection method.
Since the objective of this research was to investigate the efficacy of the resin injection repair method on the fatigue process, the three-point bending test was employed (after specimens undergone an initial fatigue test and the repair process) instead of fatigue testing for the purpose of comparing the fatigue strength of the specimens.
Fatigue test
The fatigue frequency of the machine was 3.3 Hz, and the specimens underwent approximately 2 h of cyclic loading. The final cycle experienced by the specimens ranged between 25,000 and 30,000 cycles. The difference in cycles during the tests was due to the test’s experimental nature and the machine’s stopping error during continuous operation. Besides, it may be found that the fatigue limit occurs at different cycles. The fatigue test in this research was done by constant displacement, with the position of the loading point in the fatigue machine being set to 8 mm as per the machine’s calibration. In other words, the deflection of 8 mm is the sum of the displacement of the machine’s jaws (2 mm) and the displacement of the specimen. That is why the recorded forces showed lower values, as the aim of this research is to compare fatigue repair methods, and the difference in results would not be important. The purpose of the two-channel AE system used was to record acoustic emissions during the tests. The AEWin software and the PCI-2 system with a sampling rate of 1 Ms/s were used. Two broadband, single-crystal piezoelectric sensors, designated as PICO, were used. These sensors were produced by PAC, with the designation of R50D. The sensor’s resonant frequency was noted to be at 513/28 kHz, with the operating range of 100–750 kHz being optimal. The sensor signal was boosted by 40 dB using a pre-amplifier. In order to improve the transmission of signals between the specimen and the sensor and to ensure that sensor coupling is properly done, vacuum silicon grease was applied to the specimen surface. While the acoustic emission sensors are sensitive to mechanical and magnetic noise, the tensile testing machine was operated free of load several times, moving up and down. The acquired signals were the acoustic emission signals that were picked up by the sensors from the mechanical and magnetic noise of the machine and the environment. These signals were eliminated by adjusting the threshold level. The threshold level was set at 35 dB to ensure that noise was eliminated during specimen testing, allowing the acoustic emission system to record only the acoustic activities of the test specimens.
Before mounting the two Pico sensors at a distance of approximately 40 mm from the center of the specimen, a preliminary pencil lead break (PLB) test was performed using a single sensor. This test, commonly used in acoustic emission studies, helps verify sensor functionality by mimicking the high-frequency stress waves generated during actual damage events. Once the system response was confirmed, the two sensors were attached to the specimen to continuously monitor acoustic emissions throughout the fatigue and bending tests.
After being placed in the tensile testing machine, the specimen was gripped 45 mm inside each jaw. During the testing of all specimens, the test was recorded by a camera simultaneously connected to a computer (Figures 5 and 6).

Specimen placement in the machine jaws and camera view.
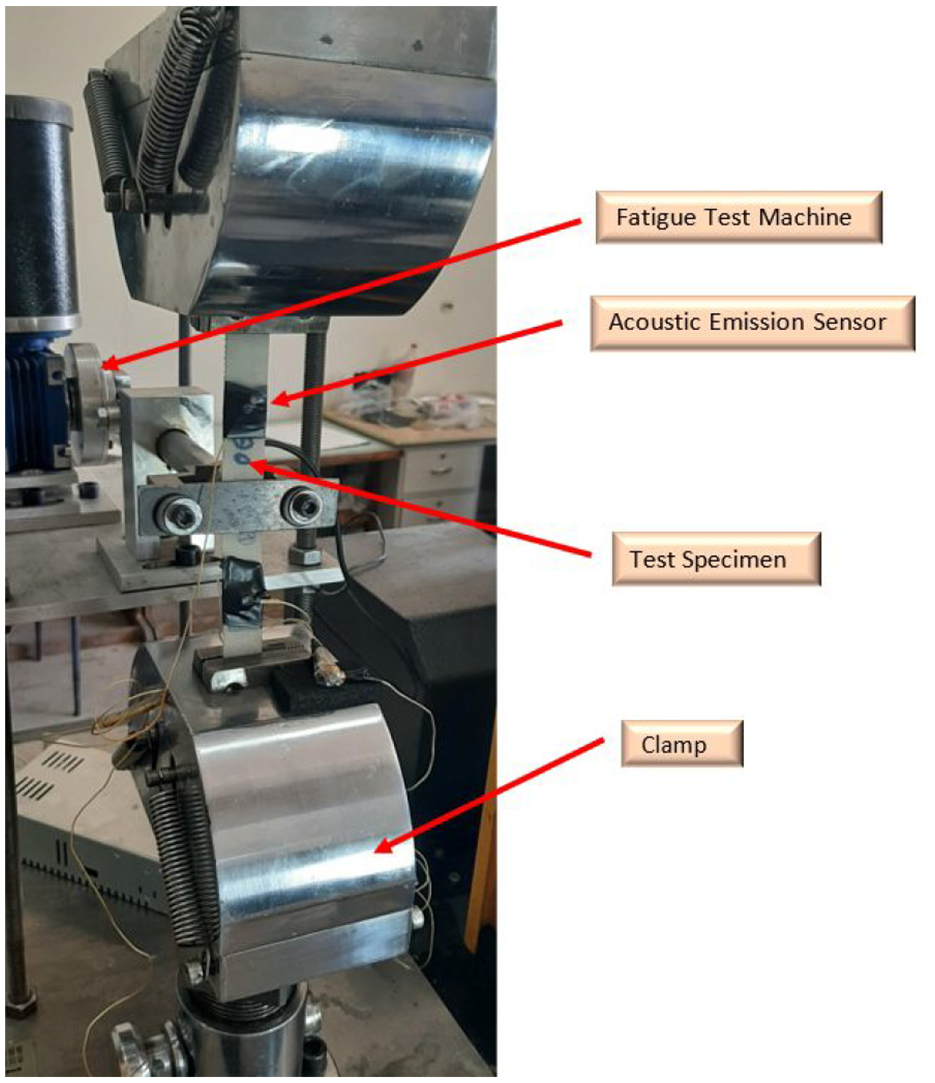
Placement of the acoustic emission sensor.
Figure 6 shows a schematic of the specimen placement inside the jaws and the location of the acoustic emission sensor, which was positioned 40 mm from the center of the specimen on both sides. Since this research did not aim to locate defects, and the primary purpose was to monitor acoustic emission signals, the exact placement of the acoustic emission sensors had minimal impact. The load was applied perpendicular to the specimen.
Resin injection repair method
To restore the composite samples with initial delamination, two small holes (3 mm in diameter) were drilled into the external surface, reaching the delaminated layer. One hole served as the inlet for injecting the resin, while the other acted as the outlet for air and excess resin to escape. The spacing between these holes was carefully chosen to ensure complete resin coverage over the damaged area. Figure 7 provides a schematic of this repair process.

The schematic of the resin injection repair method. 18
To prevent resin leakage, the transverse surface of the delaminated region was sealed with adhesive before injection. The specimens were then placed inside a silicone mold designed to match their dimensions, ensuring even resin distribution. Using a syringe, the prepared resin was injected into the inlet hole, while a vacuum-assisted process helped guide the resin through the delaminated area until it completely exited through the outlet hole.
This technique, adapted from Fardnam et al., 18 ensures that the resin fully infiltrates the damaged region, effectively restoring the structural integrity of the composite samples.
Three-point bending test
After analyzing the results of the fatigue tests and the data obtained from the acoustic emission sensors, all specimens, both repaired and unrepaired, were subjected to a three-point bending test.
The three-point bending test is a mechanical test used to calculate a material’s flexural modulus of elasticity, flexural stress, flexural strain, and flexural stress-strain response. This test is performed using standard equipment, known as a universal tensile testing machine, in various configurations (e.g. three-point or four-point bending). The main advantage of the three-point bending test is the ease of preparing a suitable test specimen. However, this method has some drawbacks: the test results are sensitive to the machine’s specimen geometry and the operation speed.
The standard for the three-point bending test conducted in this research is ASTM D790. 23 After considering the specimen geometry, using the following equation, the crosshead rate is determined to be 6 mm/min, which should be set in the universal testing machine:

R is the test’s crosshead rate, with units of mm/min.
L is the length of the specimen between the jaws, which is 80 mm in this test.
d is the thickness of the specimen in millimeters, which is 1.8 mm in this test.
Z is the outer fiber strain rate, with units of mm/mm/min and a standard value of approximately 0.01.
Ultimately, the crosshead rate is set to approximately 6 mm/min for the test. During the test, the specimen’s behavior was recorded using a camera.
Figure 8 illustrates the three-point bending test, where the specimen is placed on two jaws set 80 mm apart, and a tangential force is applied at the center of the specimen with a crosshead rate of 6 mm/min, initiating the test. The test ends when a visible failure occurs in the specimen, which should also be recorded by the acoustic emission method. Figure 9 shows the overall view of the test being performed on a universal tensile testing machine and recorded by a camera.

Three-point bending test.

Overview of the three-point bending test.
AE monitoring was not used during the three-point bending test because main goal was to evaluate the mechanical response and load-bearing capacity after repair, rather than tracking real-time crack growth as in fatigue loading. Since three-point bending typically leads to sudden failure rather than gradual damage accumulation, traditional load-displacement analysis provided a reliable assessment of structural performance.
Experimental
Table 4 outlines the key experiments conducted in this study, along with their methods and applicable standards:
Summary of experiments used in this study.

Results and discussion
This section compares the results obtained from acoustic emission data, fatigue test data, and three-point bending data. After examining and analyzing the acoustic emission data from each fatigue test, the stacking sequence’s influence on the specimens’ fatigue tolerance is evaluated, followed by an assessment of repeatability and validation. Finally, the three-point bending test results for fatigued and non-fatigued specimens are compared. It is worth noting that this research investigates the effect of filling delamination’s with resin, which leads to the retardation of delamination growth and crack propagation during the fatigue process.
Figure 10 shows the variation of force versus cycle for two specimens, 90-4 and 90-5, with a (90/90/0/0)s stacking sequence. These two specimens, one of which will be repaired later, initially exhibited similar behavior, indicating suitable repeatability. Considering that the fatigue test was conducted under constant displacement, it can be concluded that the force gradually decreases with a slight slope during cyclic loading. At the beginning of the curve, the slope of force reduction is steeper because the specimen initially has minimal damage mechanisms. As time progresses and damage mechanisms develop, the slope becomes more gradual. In other words, energy is released after the initiation of damage, and since the specimen cannot withstand higher forces or additional stress, the slope becomes more gradual.

Comparison of force-cycle curves in specimens 90-4 and 90-5.
In accordance with Figure 11, which is a comparison between samples 90-1, 90-2, and 0-1, it can be deduced that the stacking sequence is the key factor that determines the test. In respect of sample 0-1, where the stacking sequence is in the direction of the applied load, the sample demonstrates higher strength tolerance and higher forces are needed to achieve the desired displacement in the fatigue machine. Accordingly, the maximum force of the specimens 90-1 or 90-2 can be twice as much as that of the specimens at some points. For instance, specimen 0-1 experiences a force of approximately 80 N, which is twice as much as for specimens 90-1 or 90-2. One of the significant points to note in this curve is that the initial slope of sample 0-1 is steeper than those of other specimens, indicating that the rate of reduction of force during the early stages of loading is faster, which could be attributed to the onset of damage mechanisms at a faster rate.

Comparison of the influence of stacking sequence on fatigue loading force for specimens 90-1, 90-2, and 0-1.
In Figure 12, the variations in energy and force cycles demonstrate that the experimental results of fatigue testing and acoustic emission are in agreement. The graph reveals that with the increase of the loading cycles and the time, the number of high-level signals registered is also enhanced, which shows the development of new damage mechanisms in the sample. At the beginning of the figure, the energy is lower at the displacement fatigue loading condition, which remains constant. In contrast, at the end of the test, the energy is higher. With time and the evolution of the mechanisms of the damage, the number of received signals will also increase.
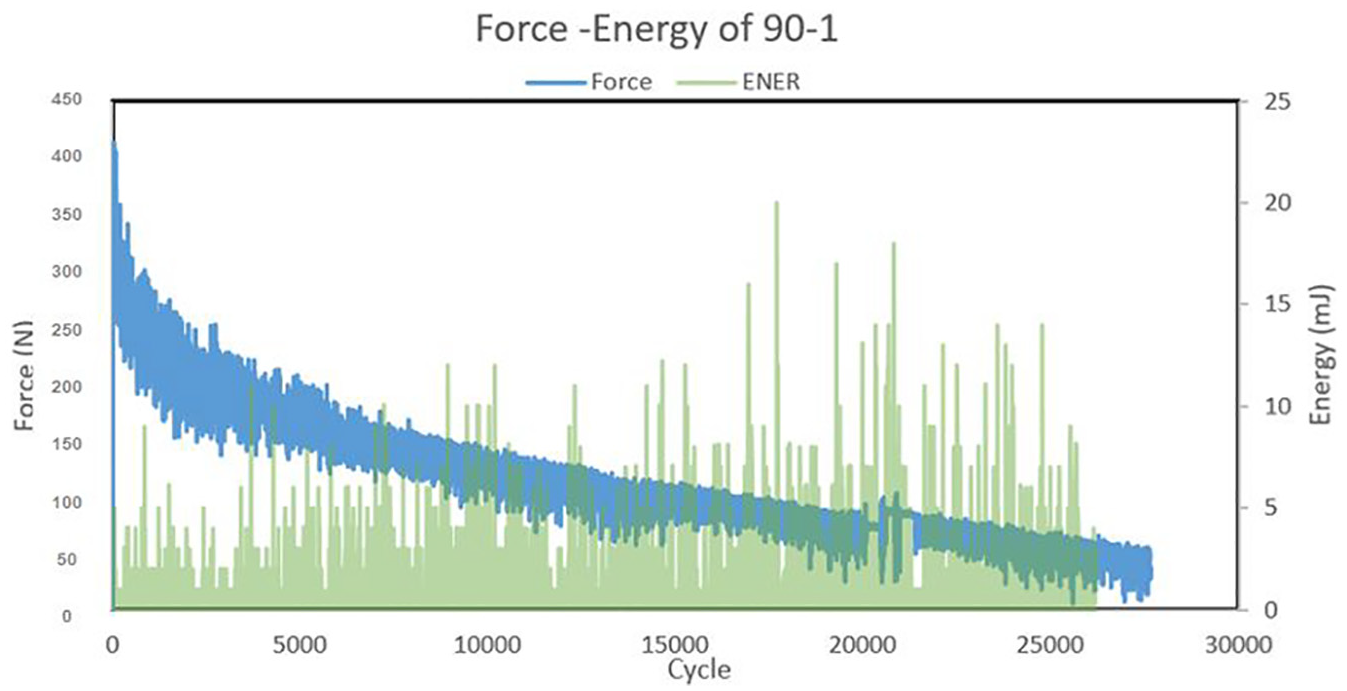
Force and energy variations for specimens 90-1.
Figure 13 illustrates the influence of the stacking sequence on the received energy signals. In other words, the received energy signals in specimen 0-1 are significantly higher than those in the 90-degree stacking sequence specimen, which can be attributed to the higher tolerance of the stacking sequence in the direction of the applied load.

Difference in received energy signals for specimens 0-1 and 90-2, and the effect of stacking sequence on received signals.
Classification of failure mechanisms using acoustic emission results
Determining the various failure mechanisms in composite specimen’s aids in achieving a deeper understanding of the delamination growth behavior in multilayer composites (Table 5). Based on previous research conducted by Saeedifar et al., 36 the dominant failure mechanisms that occur during delamination growth in multilayer composites are matrix cracking, delamination, and fiber breakage. The frequency range, amplitude, and energy of the signals associated with each of these failure mechanisms are somewhat distinct from other damage mechanisms. Other acoustic emission signals that may originate from different mechanisms in the specimen can be filtered by identifying the range of acoustic emission signal characteristics corresponding to these failure mechanisms. Saeedifar et al. used tensile tests on pure fibers and pure resin to determine the range of signals. Finally, the following results can be utilized since the same fibers and resins were used in this research. However, it should be noted that while our setup differs from Saeedifar et al., 36 the referenced failure mechanism frequency ranges are only used as a reference for signal classification, not as direct experimental validation.
Frequency ranges of failure mechanisms. 36

Recent studies have refined the classification of failure mechanisms in GFRP composites by analyzing their acoustic emission (AE) characteristics. Matrix cracking, delamination, and fiber breakage each exhibit distinct AE signal patterns, making it possible to differentiate them during structural monitoring.
Matrix cracking: Typically occurs in the 100–200 kHz range, as seen in three-point bending tests of GFRP composites. These low-frequency signals are associated with early-stage damage and gradual energy release.37,38
Delamination: Falls within the 200–300 kHz range, often overlapping with fiber/matrix debonding. Studies on tensile and flexural loading confirm that interlaminar damage produces moderate-energy AE signals in this range.39,40
Fiber breakage: Produces high-frequency signals, typically 300–570 kHz, with peak intensities above 400 kHz in high-energy fractures. This range is strongly linked to final failure stages under high stress.37,41
For consistency with previous research, the frequency ranges from Saeedifar et al. 36 are used as a reference, because tests conducted on pure resin and fiber providing a baseline for AE-based failure classification in GFRP composites despite testing variations.
Classification of failure mechanisms using frequency peaks
In this section, the activation of failure mechanisms based on the loading cycles of the specimens is investigated using the frequency peaks recorded by the acoustic emission sensor during the fatigue process.
According to Figure 14, which shows the distribution of frequency peaks and the cumulative energy curve of the signals recorded by the sensor for specimen 0-2 in the frequency ranges corresponding to different failure mechanisms, it is evident that the cumulative energy curve exhibits a steep slope in the range where frequency peaks were received from the acoustic emission sensor. Additionally, the dominant mechanism in this specimen is delamination.

Distribution of peak frequency signals and cumulative energy curve recorded by the sensor for specimen 0-2. Orange dots correspond to matrix cracking events (~50–175 kHz), blue dots represent fiber breakage events (~300–570 kHz), and the green curve shows the cumulative energy evolution throughout the fatigue cycles.
Figure 15 illustrates the effect of stacking sequence on the cumulative energy plot of the received signals from specimens 0-1 and 90-1. It is clear that the cumulative energy of the specimen with (0/0/90/90)s stacking sequence is higher compared to the specimen oriented perpendicular to the applied load. This difference is evidently due to the direction of the applied load on the specimen.

Effect of stacking sequence on the cumulative energy of received signals from specimens 0-1 and 90-1.
Figure 16 shows the effect of the stacking sequence on specimens 0-1 and 90-2. As observed in the figure, firstly, the recorded frequency peaks leading to matrix cracking for specimens 0-1 are more numerous than those for specimens 90-2, although, in some instances, the recorded signal amplitude may be smaller. Similar behavior is observed for delamination, with a higher accumulation of frequency peaks for specimen 0-1 compared to 90-2. Additionally, the range of fiber breakage is wider in specimens 0-1, although this is not the case for specimens 90-2.

Effect of stacking sequence on the received frequency peaks from specimens 0-1 and 90-2.
Observed damage on the specimen surface
According to Figure 17, corresponding to specimen 90-2, delamination and fiber protrusion can be observed, as indicated in the respective plots.

Delamination and fiber protrusion observed in specimen 90-2.
Results of the three-point bending test
Figure 18 presents a comparison of the three-point bending test results for repaired, undamaged, and unrepaired specimens. As evident from the force-displacement plots, the undamaged specimen exhibited the highest strength tolerance, the repaired specimen, and the unrepaired specimen. The initial slope of the curves indicates that the undamaged specimen had the highest compressive strength tolerance, and the repair of the fatigued specimen was not 100% effective. In fact, by comparing the maximum sustained forces, it can be concluded that the repair was approximately 86% effective. Furthermore, by comparing the areas under the curves up to the maximum force, a similar value of approximately 87.7% is obtained.

Comparison of three-point bending test results for undamaged (gray), repaired (blue), and unrepaired (green) 90-degree stacking sequence specimens.
Figure 19 illustrates a comparison of the force-displacement curves for two repaired specimens with different stacking sequences. The figure shows that the maximum force for the 0-degree specimens is approximately 54% higher than the maximum sustainable force for the 90-degree stacking sequence specimens. This can be attributed to the fact that fibers play a more significant role in composite materials than the matrix in sustaining axial loads. Therefore, when the fiber and loading directions are aligned, the specimen exhibits higher strength.
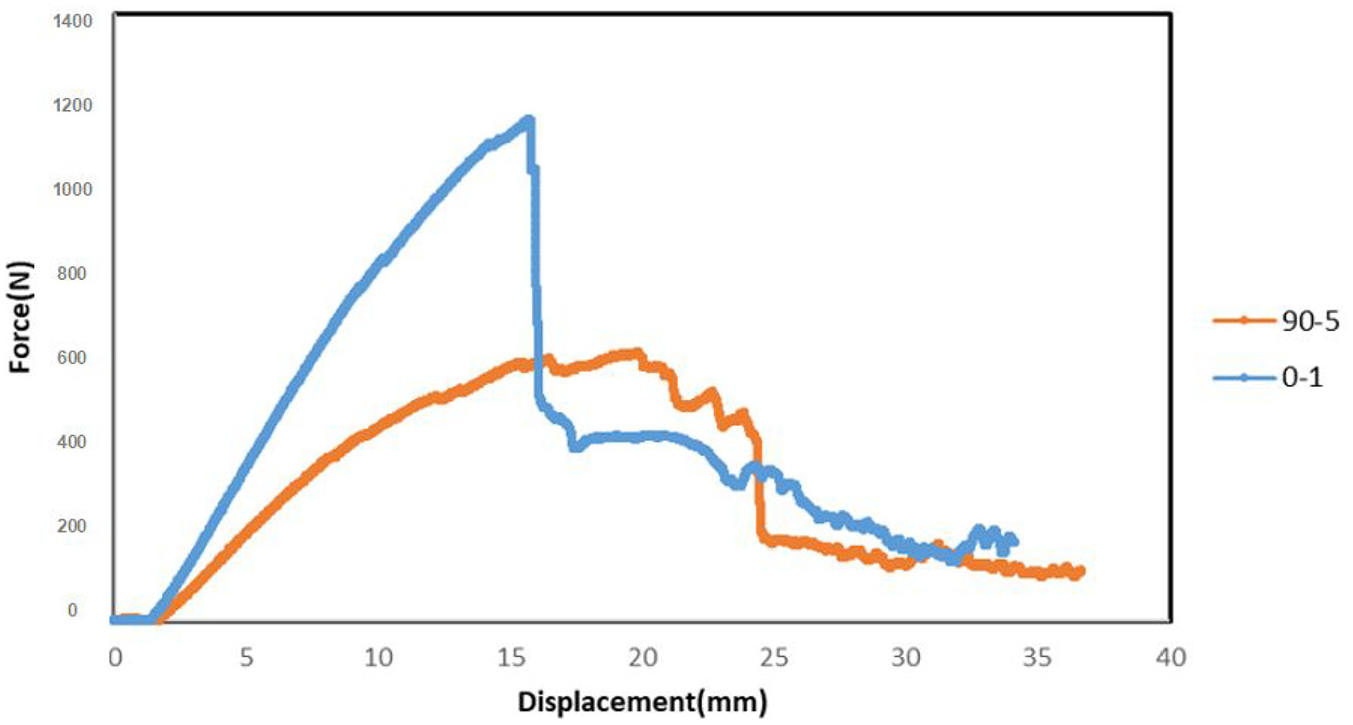
Effect of stacking sequence on the three-point bending test for repaired specimens.
Conclusion
In this experiment, a vacuum-assisted resin injection method was used to repair fatigue-damaged composite specimens. The specimens were fabricated with a (0/0/90/90)s stacking sequence using unidirectional glass fibers and epoxy resin. To simulate damage, a 7 mm drill bit was used to create holes, leading to localized delamination and matrix cracking. The specimens were categorized into three groups: two underwent cyclic fatigue loading, and one of the fatigued specimens was repaired using resin injection. After fatigue testing, all specimens were subjected to three-point bending tests to assess their post-fatigue mechanical properties. Acoustic emission monitoring was utilized during fatigue testing to track damage progression.
The most important results obtained in this research are as follows:
Specimens with the (0/0/90/90)s stacking sequence were found to be more resistant to compression compared to specimens with the (90/90/0/0)s stacking sequence, as the former approached the critical fatigue cycle with a higher tolerance limit. This suggests that the direction of loading plays a significant role in the fatigue behavior. However, it can be stated that samples cut parallel to the main specimen’s fiber direction (0/0/90/90)s were able to sustain compressive loads up to 54% more than the specimens cut perpendicular to the fiber direction (90/90/0/0)s. The reason for this is that the fiber alignment relative to the applied force significantly influences the mechanical response. Consequently, a specimen with fibers aligned parallel to the loading direction demonstrated higher load-bearing capacity due to the fibers directly carrying the axial stress, whereas in perpendicular stacking, the load was primarily borne by the matrix, which is less resistant to axial stress.
It should be noted that resin injection into the delaminated area is an effective repair method for restoring the compressive strength of composite specimens. Our previous findings indicate that specimens with the (0/0/90/90)s stacking sequence, referred to as 0-x test specimens, demonstrated a compressive strength recovery of 93% following resin injection. Similarly, specimens with the (90/90/0/0)s stacking sequence, referred to as 90-x test specimens, exhibited a recovery rate of 86%. These results highlight the effectiveness of the resin injection repair method across different stacking configurations.
A study was done using the acoustic emission method and the acoustic emission parameters, such as the energy of the received signals. The results of the experiment proved that they were consistent with the acoustic emission results.
Taking the frequency ranges of these three failure mechanisms, namely delamination growth, fiber breakage, and matrix cracking, reported by Saeedifar et al., 36 the frequency peaks of the different specimens were classified. Their research revealed that the delamination mechanism prevailed over other mechanisms in all cases studied.
By examining the acoustic emission (AE) signal characteristics associated with the induced damage, the occurrence and distribution of matrix cracking were found to be higher in the (0/0/90/90)s stacking sequence compared to the (90/90/0/0)s stacking sequence. This difference can be attributed to the greater ability of fibers in the (0/0/90/90)s sequence to resist compressive forces, thereby affecting the damage accumulation process.
Considering the images recorded during the specimen repair process, it can be observed that the resin injection repair method had a suitable effect on the holes in regions affected by delamination defects, which was also reflected in the results.
Footnotes
Handling Editor: Sharmili Pandian
Funding
The author(s) received no financial support for the research, authorship, and/or publication of this article.
Declaration of conflicting interests
The author(s) declared no potential conflicts of interest with respect to the research, authorship, and/or publication of this article.