
Abstract
In order to investigate the random vibration characteristics of a cold rolling mill under the excitation of different morphologies on the strip surface and to study the spatial distribution of vibration amplitude inside the key components of the cold rolling mill. Firstly, the 3D scanning equipment was used to obtain the surface morphology of continuous casting slabs, and then reverse engineering was used to obtain the height data of vibration marks on the slabs, and then the Gaussian distribution random function was used to carry out the data regression and the random vibration analysis of the whole model of the cold rolling mill, and finally the distribution of vibration amplitude inside the key components of the cold rolling mill was observed using the slicing method. The 3D scanning equipment was used to collect the surface morphology of the slab and the height data of the vibration marks on the surface of the slab were obtained by reverse engineering, and the random function Gaussian distribution method was used to regress the surface morphology of the continuous casting slab, and the sample collection of different morphologies of the strip surface was realized. The analysis process of random vibration characteristics of cold continuous rolling mill was sorted out, and it was found that the maximum value of random vibration displacement was on the transmission side, which verified that the vibration characteristics of cold continuous rolling mill could be better characterized by random vibration characteristic analysis. The slicing method observes the internal vibration amplitude distribution of the key components of the cold rolling mill, showing the phenomenon of “small in the middle and large at the end”. The application of the random function of Gaussian distribution provides a new method for the expression of slab morphology, and also provides a data basis for excitation of random vibration in cold continuous rolling mill. The application of the slicing method provides a new idea for analyzing the internal vibration state of key components of the cold continuous rolling mill.
Keywords
Introduction
The state of the surface morphology of the continuous casting billet varies with the vibration frequency and form of the mold, but how to obtain its surface characteristics is a difficult problem.
At present, the functions of 3D scanning equipment have been developed very maturely, and they are also used in a variety of environments, such as the establishment of 3D models of insect samples, the reverse engineering design of deformed airfoil structures, and the comparison of 3D scanning models of feet and ankles. The novel 3D scanner equipped with an IR Sharp Sensor provides precise measurements and creates detailed 3D models, significantly benefiting industries such as manufacturing and e-commerce. It facilitates 360° product views and immersive virtual environments, expanding the possibilities of design and presentation for an unparalleled user experience. 1 The study introduces a low-cost 3D scanner system designed for high-resolution insect models with true color accuracy. It digitizes natural history archives, enables remote specimen analysis, and supports functional research in entomology. Automated and efficient, this system is well-suited for large-scale museum digitization. Future steps will involve modeling small structures and exploring 3D-based insect identification using deep learning techniques. 2 The tool-chain effectively extracts and analyzes aerospace lifting surfaces, distinguishing between geometric and aerodynamic differences. Unlike reverse engineering, which aims to reconstruct design intentions, the project MILAN focuses on how construction methods influence aerodynamic behavior. While 3D scanning provides valuable surface data, it faces challenges such as scan defects and point cloud processing issues. Achieving accurate results necessitates over-coming these obstacles. 3 Six studies compared 3D scanning to traditional methods, such as plaster casting. The 3D scanning proved to be faster but exhibited variable reliability. The level of agreement varied depending on the specific foot parameter measured. The quality of the studies was rated as low to moderate. 4 Consensus was reached on formulating research questions, defining components of outcome measurement, and establishing design and analysis standards. A tool was developed to evaluate the quality of reliability studies, assisting researchers of all expertise levels. 5 The study developed a structured-light scanner and simulation pipeline to create pixel-accurate replicas, enabling 3D datasets with ground truth for surface reconstruction algorithms. Results highlight the achievable accuracy, emphasizing simulator validation. 6 All of the above applications provide a reference for equipment selection, applicable working conditions, application range, precision control, and optimization algorithms, among other factors.
However, the height fluctuation state of the surface vibration marks of the strip steel is relatively complex, and the surface topography state needs to be supported by massive data when establishing its 3D model, and the field application of the handheld laser scanner provides conditions for the real simulation of engineering practice.
The random vibration analysis has been deeply studied under a variety of working conditions. The paper develops an iterative Iwan element and a semi-analytical FFT Jacobian matrix algorithm designed for efficient random vibration analysis of bolted structures. By modeling random loads as complex exponentials, the approach employs Frequency-Time Method (FTM) and Amplitude-Frequency Transformation (AFT) techniques, significantly reducing computational effort. Results from a 2DOF oscillator and a Brake–Reuß beam model illustrate the algorithm’s efficiency, providing a novel frequency-time approach for nonlinear random vibration analysis in bolted structures. 7 A two-dimensional equivalent Reissner–Mindlin model (2D-ERM) was developed to analyze the random vibration characteristics of sandwich panels featuring a three-dimensional orthogonal accordion core. This model has been validated through 3D-printed tests and finite element (FE) simulations, achieving high precision with an error margin of less than 5%. The results indicate that strut geometry significantly influences stiffness and vibration performance, with the SP-3D-OAC design providing a 20% reduction in density while offering excellent vibration isolation, making it ideal for supporting precision equipment. 8 A finite-element model predicts nonlinear vibrations of an industrial structure with friction and elastomer joints. Experiments show the Harmony-Gamma structure exhibits complex nonlinear behavior, with frequency shifts, softening effects, and reduced amplitude peaks under increased excitation levels. 9 The aforementioned research papers indicate that random vibration analysis can effectively support the simulation of lightweight structures. This offers valuable insights for the application of lightweight strip steel structures during the rolling process.
According to different research objects, many scholars have carried out the analysis of random vibration characteristics under the impact load of different structures, and obtained qualitative results affecting different influence parameters. The study investigates the stochastic response and reliability of hyperbolic parabolic membrane structures under non-Gaussian typhoon wind loads. Using the Fokker-Planck-Kolmogorov (FPK) equation, it derives analytical solutions for the probability density function (PDF), root mean square (RMS), skewness, and kurtosis. The results reveal significant impacts of nonlinear stiffness and aerodynamic forces, with a reduced wind velocity identified as the most critical factor. A reduced wind velocity of 1.2 and a rise-span ratio of 1:10 are recommended for design purposes. 10 A new S-beam damping pallet reduces vibration energy by 46.3% compared to traditional pallets and offers a wider damping frequency range. It ensures cargo stability, protects goods, and enhances transport safety, as verified by finite element simulation with a 1% margin of error. 11 A time-dependent random model of a maglev system has been developed to analyze its vibration characteristics. Validated by field data, this model integrates finite element guideway modeling, random parameter analysis, and probabilistic methods, demonstrating both accuracy and efficiency while examining the impacts of speed, irregularity, and load. 12 The paper analyzes the random vibration and reliability of hyperbolic-parabolic membrane structures under wind loads, utilizing the FPK and DFPFC methods. Validated through experimental data, it examines the effects of wind speed, pretension, and rise-span ratio, providing essential insights for the design of membrane structures. 13 The research papers discussed highlight that random vibration characterization is applicable for simulating heavy structures. This provides a valuable reference for the deployment of heavy structures in cold rolling mills, particularly under the conditions of the rolling process.
All these applications underscore the importance of random vibration analysis for optimization across various industries. However, there are few studies on the random vibration characteristics of the cold continuous rolling mill, so this paper employs the methodology to investigate the random vibration characteristics of a cold rolling mill under the influence of varying strip steel surface profiles. This approach not only highlights the versatility and necessity of random vibration analysis but also sets a precedent for its application in optimizing operational parameters within the industry production.
Construction of different topography of strip surface
In previous finite element simulations, strip surfaces were typically modeled using smooth surfaces, sine function surfaces, or superimposed sine function surfaces. However, these approaches fail to accurately represent the surface morphology observed in the field and cannot capture the random characteristics of the surface topography caused by the strip production process. To address this, this paper employs a high-precision 3D handheld scanning device to collect data from actual strip surfaces in the field, thereby revealing the random characteristics of the strip surface features with greater authenticity.
Global 3D scanning device
Before scanning the different topography of the strip surface, it is necessary to confirm whether the sampling accuracy of the scanner equipment meets the requirements of use. AXE-B11 handheld 3D scanner was used to scan different morphologies of the strip steel surface to obtain its 3D point cloud data, and the measurement accuracy of the equipment is shown in Table 1.
Equipment measurement accuracy.

Following the manufacturer’s equipment usage instructions, the surface condition of the continuous casting slabs on-site was scanned using the scanning equipment and software configuration correctly, thereby obtaining the surface of the continuous casting slabs, as shown in Figure 1.

Surface scan of continuous casting slabs.
Reverse engineering measurement software extracts the surface of vibration marks
Using the commercial reverse engineering software PolyWorks, the surface vibration marks of the continuous casting slabs are identified, as shown in Figure 2.

Surface vibration mark measurement distribution chart.
The software measures the spacing and height of the surface vibration marks and generates Tables A1, A2, and A3 in Appendix 1 for the surface vibration parameters. The vibration mark spacing includes both horizontal and vertical spacing, with units in micrometers. Due to software limitations, the values for the vibration mark height spacing along the width direction do not achieve strictly equal division in a strict sense; the measured values for the vibration mark height spacing along the rolling direction are peak-to-peak values. The actual mold vibration frequency is 2.5 Hz, and the length of the continuous casting slab rolled is 38.4 mm, with 31 peak-to-peak values. The calculated vibration mark height interval frequency is 2.47 Hz, indicating consistency in the vibration mark height interval along the rolling direction.
Because the effective statistical characteristics of different morphologies of the strip steel surface have a great influence on the random vibration analysis results, a reasonable statistical method can be used to restore the surface morphology of the strip steel to the greatest extent.
Establishment of a function for the fluctuation of vibration mark spacing and height
Using MATLAB software to process the generated surface vibration mark parameter table and create a curve expression to produce a vibration height fluctuation graph, as shown in Figure 3.

Vibration mark height fluctuation graph.
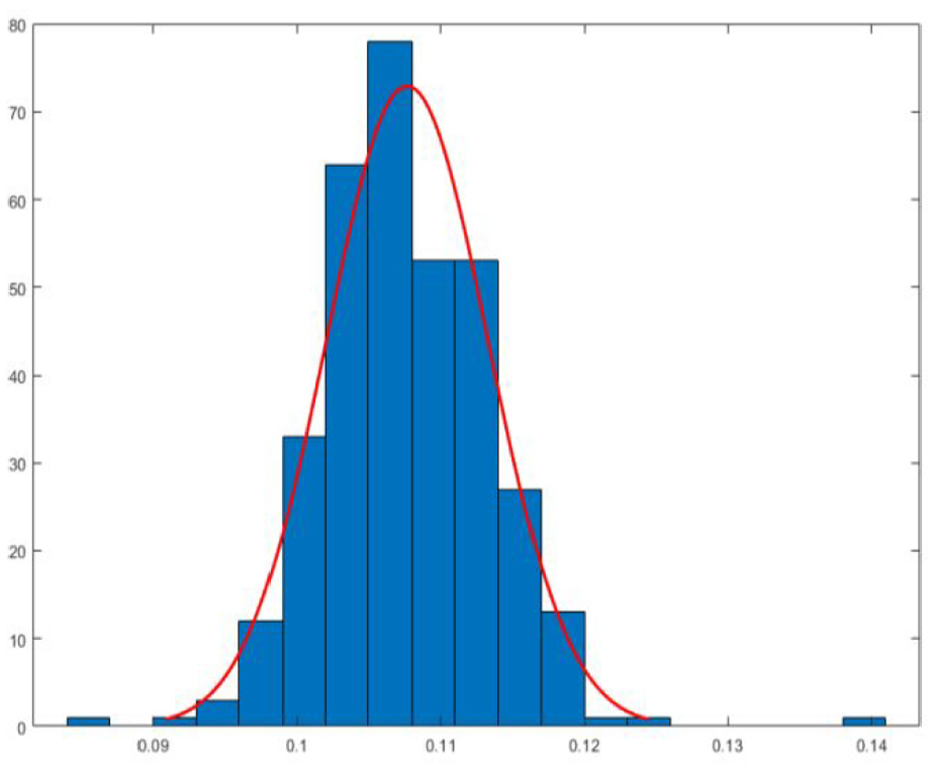
Perform a Gaussian probability density statistic on the vibration mark height fluctuation data to obtain a Gaussian distribution fit graph and Gaussian distribution parameters. The mean value is 0.1077 mm, and the Gaussian distribution function is shown in equation (1):

where µ is 0.1077 and σ is 0.0056.
The generated Gaussian distribution is shown in Figures 4 and 5 displays the sample data distribution of the fitting curve. The strong linear consistency indicates that using this distribution to fit the vibration mark height fluctuation data is feasible.
Gaussian distribution statistical results graph.

Gaussian distribution data consistency check graph.
By employing the state distribution parameters of the Gaussian function, the Gaussian function can be inversely calculated, which allows us to determine the surface vibration mark height values. By integrating the distribution characteristics of the surface vibration mark spacing in both the rolling direction and the width direction of the continuous casting billet, a spatial distribution map of the surface vibration mark heights can be generated, as shown in Figure 6.

Surface vibration mark: (a) XZ plan view and (b) isometric view.
Figures 3 and 6 reveal that the height of strip surface vibration marks, constructed from actual scanning data, exhibits complex random characteristics. Meanwhile, the use of Gaussian distribution effectively captures the random nature of the strip surface topography with improved data consistency. When employing the finite element method to analyze the random vibration of a cold rolling mill under thickness excitation, it is essential to convert the measured height of the strip surface vibration marks into the displacement power spectral density, which serves as the load input condition. The robust statistical results provided by the Gaussian distribution of the strip surface topography offer valuable data support for achieving this analytical objective.
Random vibration analysis process of cold rolling mill
In the past, when scholars carried out dynamic simulation of the whole model of the cold continuous rolling mill, the modal analysis was used to calculate the natural frequency of the whole machine model, and then the harmonic response analysis of the whole machine model was carried out by the time sinusoidal excitation load to calculate the swept frequency vibration of the whole machine model, so as to determine the resonance frequency band of the whole cold continuous rolling mill model. The law of height fluctuation of the surface of the strip steel on the spot is not formed by the superposition of a single sinusoidal excitation load or a plurality of sinusoidal excitation loads, and the height fluctuation shows randomness after rolling by multiple stands. Therefore, this paper proposes a random vibration analysis method for strip height fluctuation excitation cold continuous rolling mill to analyze the complexity of vibration characteristics of cold continuous rolling mill.
Cold continuous rolling mill model
According to the drawings given in the factory, the 3D model of the cold rolling mill was created using SpaceClaim software, as shown in Figure 7.
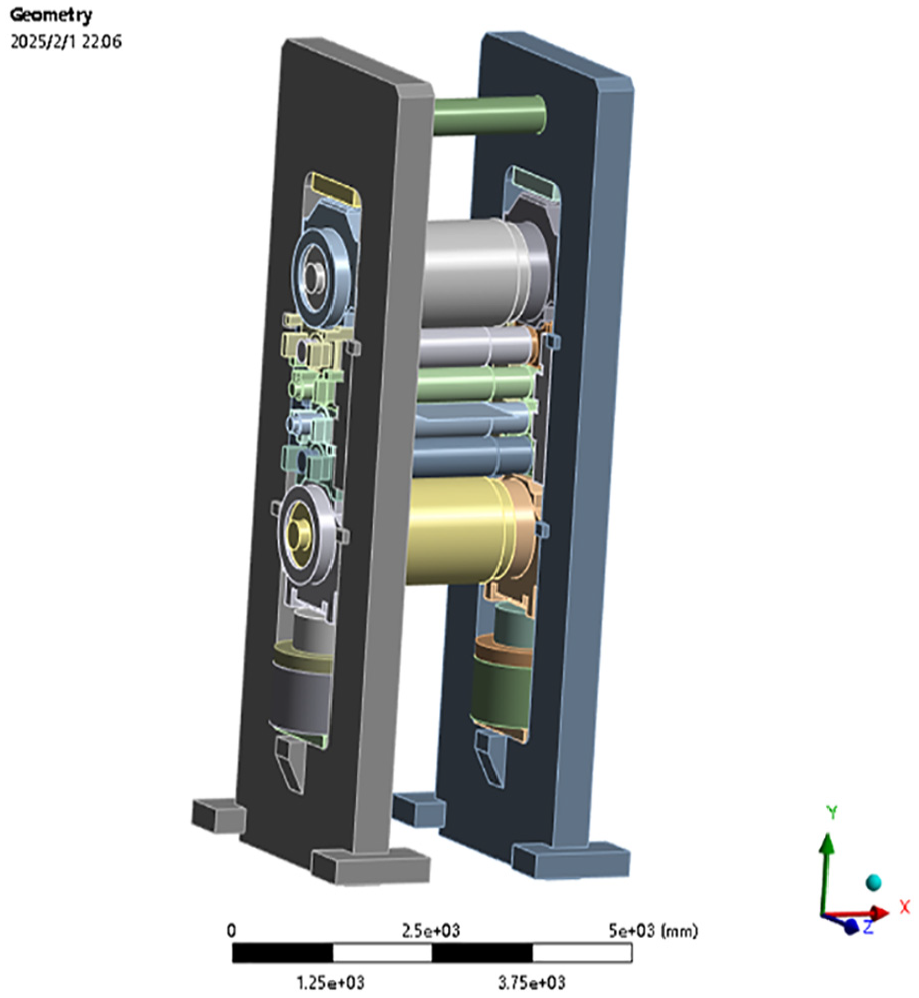
3D structure model of the whole machine.
It was then imported into Ansys Workbench to perform random vibration analysis on the cold continuous rolling mill prior to finite element simulation analysis, including structural simplification, meshing, constraint application, boundary condition settings and more. Considering the influence of meshing on the finite element calculation results, the average mesh quality is 0.93, the number of meshes after division is 98,503, and the number of nodes is 302,826 by using various meshing methods such as automatic tetrahedral mesh, multi-domain mesh, hexahedral mesh, etc.
Modal analysis
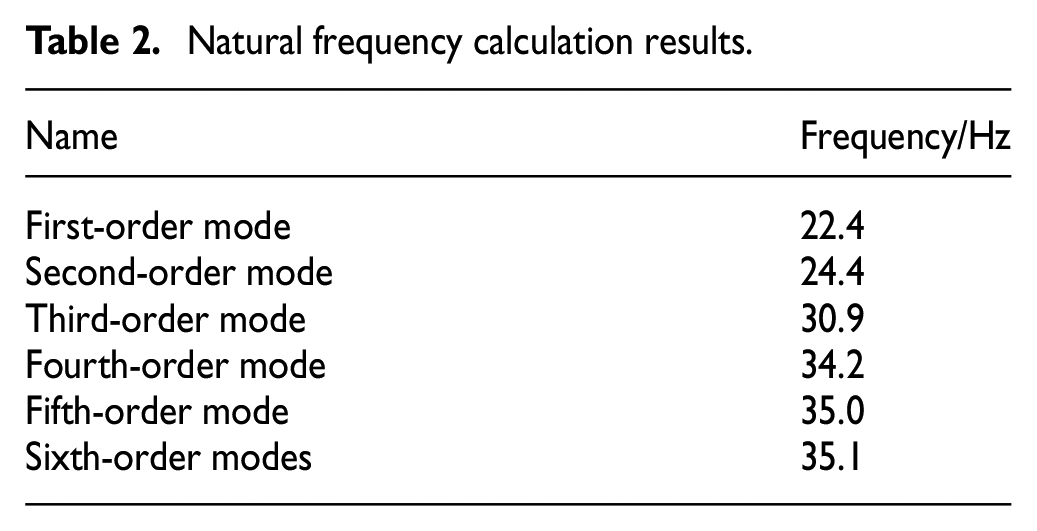
After modal analysis of the whole model of the cold continuous rolling mill, its natural frequencies and mode shapes are obtained, and the first six natural frequencies are shown in Table 2, and the corresponding mode shape results are shown in Figure A1 in Appendix 1. Then, on the basis of modal analysis, the random vibration analysis of the whole model of the cold continuous rolling mill was carried out. In this paper, the Welch method14,15 is used to estimate the power spectral density of the vibration mark height, and the internal algorithm is to sample the finite overlap of the periodic spectrum, and the technique to reduce the variance of the periodic graph is to decompose the time series into multiple segments. The periodic diagram is a non-parametric estimation of the power spectral density of a generalized stationary stochastic process, a Fourier transform of the offset estimation of an autocorrelation sequence, and is not a consistent estimator of the true power spectral density of a generalized stationary process, which is calculated as equation (2):

where xn is signal and N is signal length.
Natural frequency calculation results.
In this paper, the single-sided spectral PSD with a sampling frequency of 1024 Hz and a repetition rate of 50% is used to estimate the power spectral density. A high PSD probability density distribution with a mean value of 0.1077 and a variance of 0.0056 was obtained. The excitation load of the roll gap is set as the displacement excitation of PSD, and the interface is obtained by the slicing method along the axis direction of the upper and lower work rollers of the whole model of the cold continuous rolling mill, which provides convenience for the analysis of the internal velocity and displacement response of the structure, the same color is the area with equal values, the calculated value is the size under the 3σ principle, the confidence level is 99.75%, the left side is the transmission side, the right side is the operation side, Figure 8(a) is the velocity statistical result chart of all structures of the whole machine model, and Figure 8(b) is the displacement statistical result chart of all structures of the whole machine model. Using the software probe tool, the statistical results of the probability density of the upper and lower support rollers were obtained, and the data processing was imported into the MATLAB software for data processing, and the amplitude and frequency results of the upper and lower support rollers were obtained, as shown in Figures 9 and 10.

Calculation results of all structures of the whole model: (a) directional velocity and (b) directional deformation.
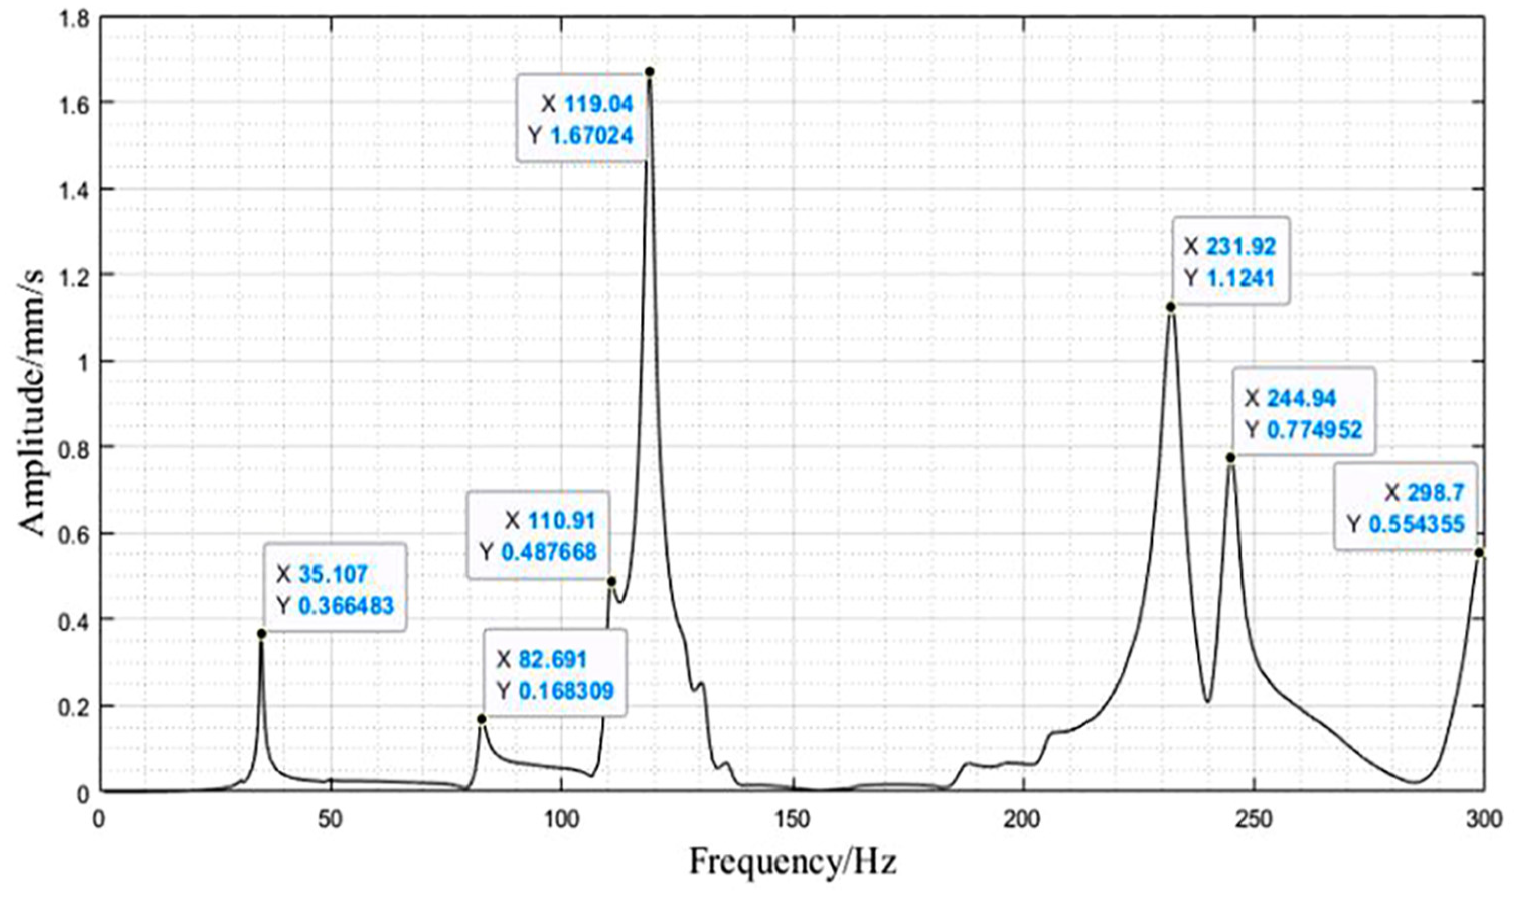
Amplitude-frequency diagram of the upper support roller.

Amplitude-frequency diagram of the lower support roller.
Analysis of kinetic results
From Figures 9 and 10, it can be obtained that when the random vibration characteristics of the cold continuous rolling mill are analyzed, the vibration amplitude and frequency diagrams are obviously different, and the data in the diagram are sorted out to obtain Table 3.
Data table under random vibration characteristic analysis.

As can be seen from Table 3, the random vibration characteristic analysis can better reflect the vibration characteristics of the cold continuous rolling mill, and at the same time, it is found that the vibration amplitude of the lower support roll is larger than that of the upper support roll, and it can be found from Figure 8 that the maximum speed and the maximum displacement do not occur on the important components (work roll, intermediate roll, support roll, archway) in the statistical results, resulting in many results, such as model simplification, structural symmetry, etc.
Conclusion
A high-precision 3D scanner was used to scan the surface of the continuous casting billet, and reverse engineering techniques were used to restore the surface morphology height data and vibration mark height spacing data of the continuous casting billet, and to compare the reliability of the data of the vibration mark height spacing of the test slabs in the direction of rolling, with a measurement accuracy of 1.2%.
The mathematical and statistical method of Gaussian distribution in random function can characterize the distribution law of the vibration mark height, and restore the vibration mark height state of slab after scanning, which can establish a big data model of the surface topography height of continuous casting billet to provide a design idea.
Using the principle of statistics to obtain the statistical characteristics of the slab surface data as input conditions for random vibration simulation of the cold rolling mill model, using the height of the vibration mark power spectral density as the roll seam displacement excitation, the modal and random vibration characteristics of the cold rolling mill were analyzed, and it was found that the amplitude of the vibration of the lower support rolls was larger than that of the upper support rolls.
The slicing method can better display the internal vibration amplitude of the cold continuous rolling mill, and it is found that the vibration amplitude at the roll body is small, while the vibration amplitude at both ends is large, which provides a method for visualizing and studying the internal vibration of the cold continuous rolling mill. Although the 3D structural model of the transmission system is not loaded, from the perspective of this paper, the random vibration displacement amplitude of the transmission side of the lower middle roll is the largest, which provides an idea for analyzing the influence of the transmission system on the vibration characteristics of the cold continuous rolling mill.
Footnotes
Appendix 1
Handling Editor: Jinting Xu
Funding
The author(s) received no financial support for the research, authorship, and/or publication of this article.
Declaration of conflicting interests
The author(s) declared no potential conflicts of interest with respect to the research, authorship, and/or publication of this article.