
Abstract
The multi-channel concentrated water supply system represents a pivotal link in the firefighting water supply chain, and ensuring the efficiency of its water supply is of paramount importance for the smooth progress of firefighting. A mathematical model is established for the steady state and transient conditions of the multi-channel water supply system. The model solution indicates that the number of parallel channels, centrifugal pump operating frequency, valve execution time, and system resistance can affect the output pressure and flow rate of the confluent water supply system. A detailed investigation was performed into the influence laws of different operating parameters on the output characteristics of the multi-channel confluent water supply system, based on the experimental and simulation research platform. Especially under transient conditions, the increase in the operating frequency and valve switching interval will result in a greater value for the main pipe pressure drop/pressure rise. When the load valve opening is below 50%, the influence of the valve switching interval time and channel transported distance on the pressure drop value is reduced. The research results provide a foundation for the smooth switching of multi-channel confluent water supply systems.
Introduction
The maintenance of a continuous and stable water supply is a fundamental prerequisite for the successful extinguishment of fires.1,2 From the existing case studies of classical firefighting operations, it can be seen that the scientific and reasonable organization of fire scene water supply is of paramount importance in ensuring the continuous and stable supply of water to the fire scene, and thus the success of firefighting operations.3–5 As an integral component of the fire scene water supply, the multi-channel confluent water supply (abb. MCCS) system is subject to a number of factors that can affect its performance, including the working characteristics of the system, the personnel’s operating methods, and the system’s compatibility with other equipment and factors. Consequently, it is imperative to investigate the dynamic characteristics of the MCCS system in accordance with the specific circumstances, and to operate the water supply system in a rational and evidence-based manner.
During transient flow events in MCCS systems, a typical working condition that poses a hazard to system stability is water source switching. This is particularly the case in fire sites that lack natural water sources, where frequent water source switching can lead to changes in pipeline pressure and flow. On the one hand, when the maximum and minimum values of the pressure changes exceed the design range, it may result in the rupture of the pipeline,6–8 thus cutting off the water supply to the fire scene. On the other hand, the change of pressure negatively affects the fire pumps and the fire cannons,9,10 which introduces unpredictable difficulties in fighting the fire in the fire scene. A substantial corpus of existing literature addresses the topic of pressure fluctuations, with a particular focus on those instances caused by pumps and valves. Some studies have focused on the transient flow in hydroelectric plants due to pump failures and fast closing of valves.11–13 Li et al. 14 provide an account of the transient properties and formation mechanisms associated with water supply processes, while also offering an overview of the research methods employed to study transient phenomena. Through an investigation into the phenomenon of hydraulic oscillations in parallel-operated pumps, Hu et al. 15 identified a novel hydraulic interaction between pump and turbine. There is also literature explaining the phenomenon of pressure fluctuations generated by the alternating start-up process of parallel pumps.16,17 Furthermore, for the pump-valve system, researchers and scholars have analyzed the causes of pressure fluctuations and put forward several solutions to reduce the transient pressure.18,19 Yang et al. 20 reached the conclusion that check valves can be effective in inhibiting the water hammer phenomenon caused by switching of parallel pumps by studying the closing process of counterflow check valves in experimental circuits for nuclear power plants under counterflow differential pressure. The aforementioned research findings assist in the comprehension of the genesis of pressure fluctuations in pressurized pipe. Research has also been conducted on transients and water hammer in the field of firefighting systems. Such as, Britton and Willey 21 investigated the causes of water hammer and other hydraulic transients, and proposed solutions for different usage scenarios, especially in fire-fighting systems. The proposed solutions include minimizing the pressure difference between the fire pump and the jockey pump, controlling the opening and closing speed of the valves, and using an anti-surge diaphragm or an airbag tank to moderate any possible surges. Malesińska 22 conducted a study on the occurrence of water hammer in pipelines, and the subsequent forces and displacements that are induced by this phenomenon in fire deluge systems. The objective of this study was to ensure the reliable operation of fire deluge systems. Nevertheless, in the domain of fire water supply, there is a paucity of research outcomes pertaining to the fluctuations in pressure and flow rate in MCCS systems.
This paper employs a system hydraulic model analysis and experimental bench research approach to construct a simulation model of an MCCS experimental setup. The system characteristics under different operating parameters are analyzed using experimental and simulation techniques, and the influencing factors of the system output stability under switching conditions and their laws are highlighted.
Materials and methods
Experimental platform and simulation model
The MCCS experimental platform consists of four channels, the main pipe, gas supply device, variable frequency cabinet, and gathering pipeline structure, as well as a DAQ Card system. As shown in Figure 1, the figure depicts four channels through which water is supplied via a centrifugal pump. The water then passes through a series of components including a pressure gauge, check valve, pneumatic regulating valve, channel electric regulating valve, flowmeter, and pressure transmitter before reaching the concentration pipe structure. From there, it flows to the main pipe and returns to the tank. The channel consists of a centrifugal pump, vacuum pressure gauge, pressure gauge, check valve, hand ball valve, pneumatic control valve, electric control valve, pressure transmitter, flowmeter, and related pipelines. The main pipe is composed of the main electric regulating valve, manual ball valve, main pressure transmitter, and main flowmeter.

Schematic of the experimental platform and connections: (1) water tank; (2) hand valve; (3) frequency converter; (4) vacuum meter; (5) centrifugal pump; (6) pressure gauge; (7) check valve; (8) ball valve; (9) pneumatic valve; (10) channel electric control valve; (11) channel flowmeter; (12) channel pressure transducer; (13) air-vent valve; (14) air compressor; (15) main electric control valve; (16) main pressure transducer; (17) main flowmeter; (18) main hand valve; (19) DAQ Card; (20) analysis recorder.
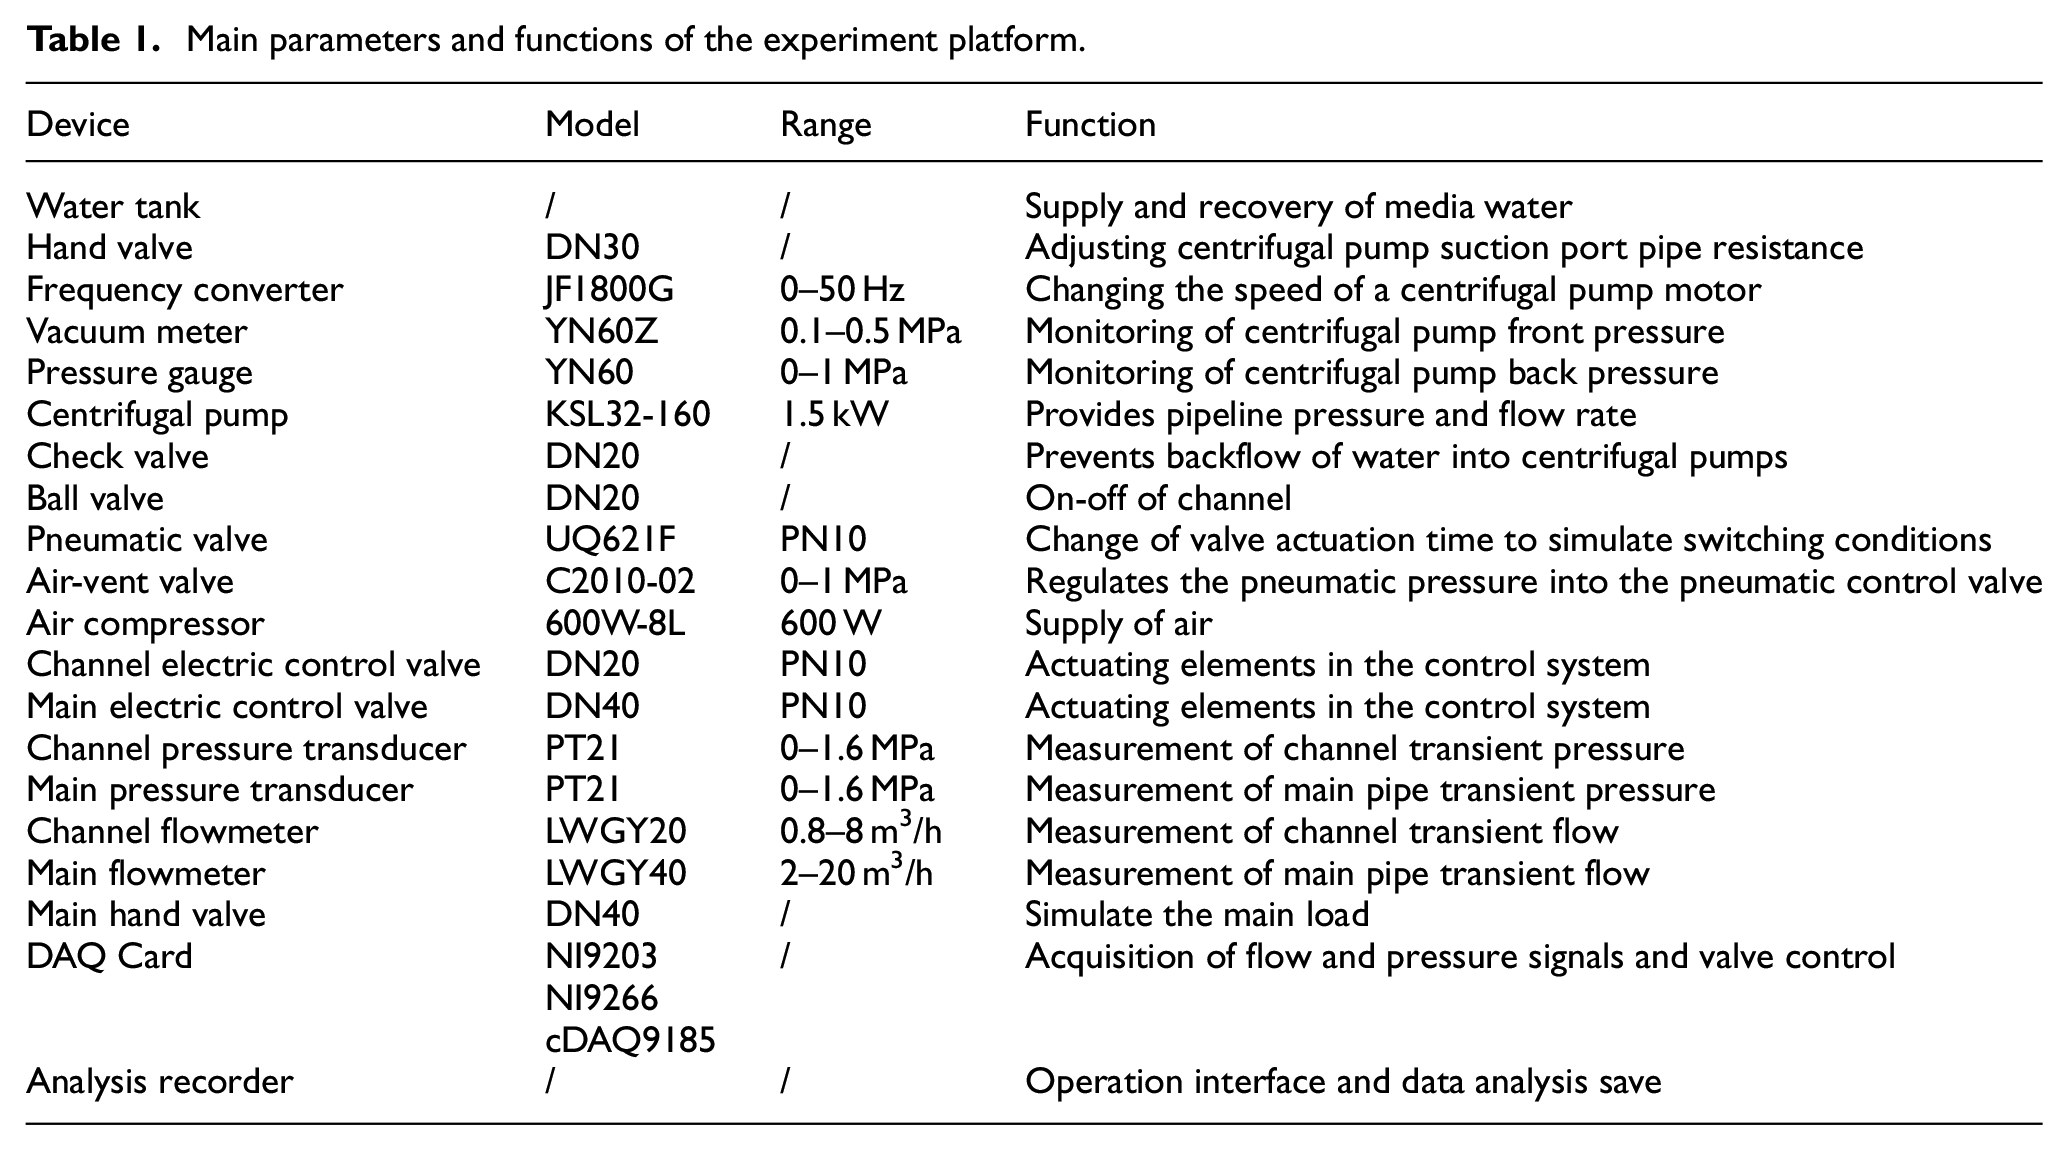
The most common fire belt size is 80 mm, while the main chariot fire pump suction port diameter is 150 mm. The deflation ratio is estimated at 4, with the experimental bench pipeline branch diameter set at 20 mm and the main pipeline diameter set at 40 mm. The experimental pipelines are made of PVC (Polyvinyl Chloride) with a roughness coefficient of 0.0015. The main components of the threaded live connection are designed to be easily replaced. In order to ensure the accuracy of the measurement components, the flowmeter installation position from the nearest valve should be 20 times the length of the pipe diameter. Similarly, for the pressure transmitter, the installation position should be 6 times the pipe diameter. The air supply device comprises an air compressor and a pneumatic regulator, which provide accurate air pressure for the opening and closing of the pneumatic adjustment valve and the determination of execution time. The frequency conversion cabinet comprises four frequency converters and related electrical components, which are used to regulate the rotational speed of the centrifugal pump motor. The pneumatic control valve is capable of simulating the opening and closing of individual channel points and switching conditions. The channel electric control valve is employed to regulate the pressure and flow rate within the respective branch. The main electric control valve is utilized for the regulation of both the main pipe pressure and flow rate following their aggregation. The acquisition and control system employs the American National Instrument, comprising cDAQ-9185 chassis, input module NI9203, and output module NI9266. The main performance parameters and functions are shown in Table 1.
Main parameters and functions of the experiment platform.
In the experiments, the flow rate and pressure of the pipe are measured and collected. The following points require elucidation.
(1) Prior to the commencement of the experiment, all units within the MCCS system must undergo testing to confirm their operational status.
(2) It has been established that when the power frequency of a single branch is operational, the maximum flow rate is 7.5 m3/h. However, when the three branches are operated at synchronous power frequency, the maximum flow rate increases to 18 m3/h, and the maximum pressure at the main road is 0.3 MPa.
(3) The air-vent valve is adjusted to specific values to measure the time taken for the pneumatic valve to open and close at intervals of 1, 5, 10, 20, and 30 s. The electric control valve of the main pipe is adjusted via the DAQ card and LabView System. Specific values are set to determine the valve openings at 25%, 37.5%, 50%, 62.5%, 75%, 87.5%, and 100%. The rotational speed of the centrifugal pump motor is adjusted by the frequency converter, with frequencies set at 29.2, 36.7, 42.5, 48.8, and 50 Hz.
(4) The term ‘transient event’ as employed in this paper denotes the synchronous switching process of the two channels. That is to say, the power frequency of the three channels runs in parallel, and one of the channels switches synchronously with the standby channel.
The simulation model for the MCCS is composed of hydraulic component models provided in the AMESim model library. AMESim (Advanced Modeling and Simulation Environment for Systems Engineering) is a multi-domain simulation platform validated for hydraulic transient analysis. It employs the Method of Characteristics (MOC) to solve hyperbolic partial differential equations governing transient flow. The software’s hydraulic component library includes pre-validated models for pumps, valves, and pipelines, enabling accurate representation of transient phenomena.23–25 These models have been rigorously tested and experimentally verified, as shown in Figure 2. Firstly, select the appropriate components from the hydraulic, liquid resistance, and mechanical libraries based on their intended function within the experimental platform. These components should include the filter, pressure sensor, flow meter, check valve, electromagnetic reversing valve, variable throttle hole, plug, fluid, centrifugal pump, tee, pipe resistance, and motor. The simulation model for the MCCS is constructed by connecting the components based on the actual situation. Subsequently, the appropriate sub-model is selected for each component in the system model. The system model is then compiled, and the parameters of the sub-model are checked and modified according to the parameters of the experimental platform components. Finally, the simulation is conducted, and the system model is evaluated based on the experimental results.
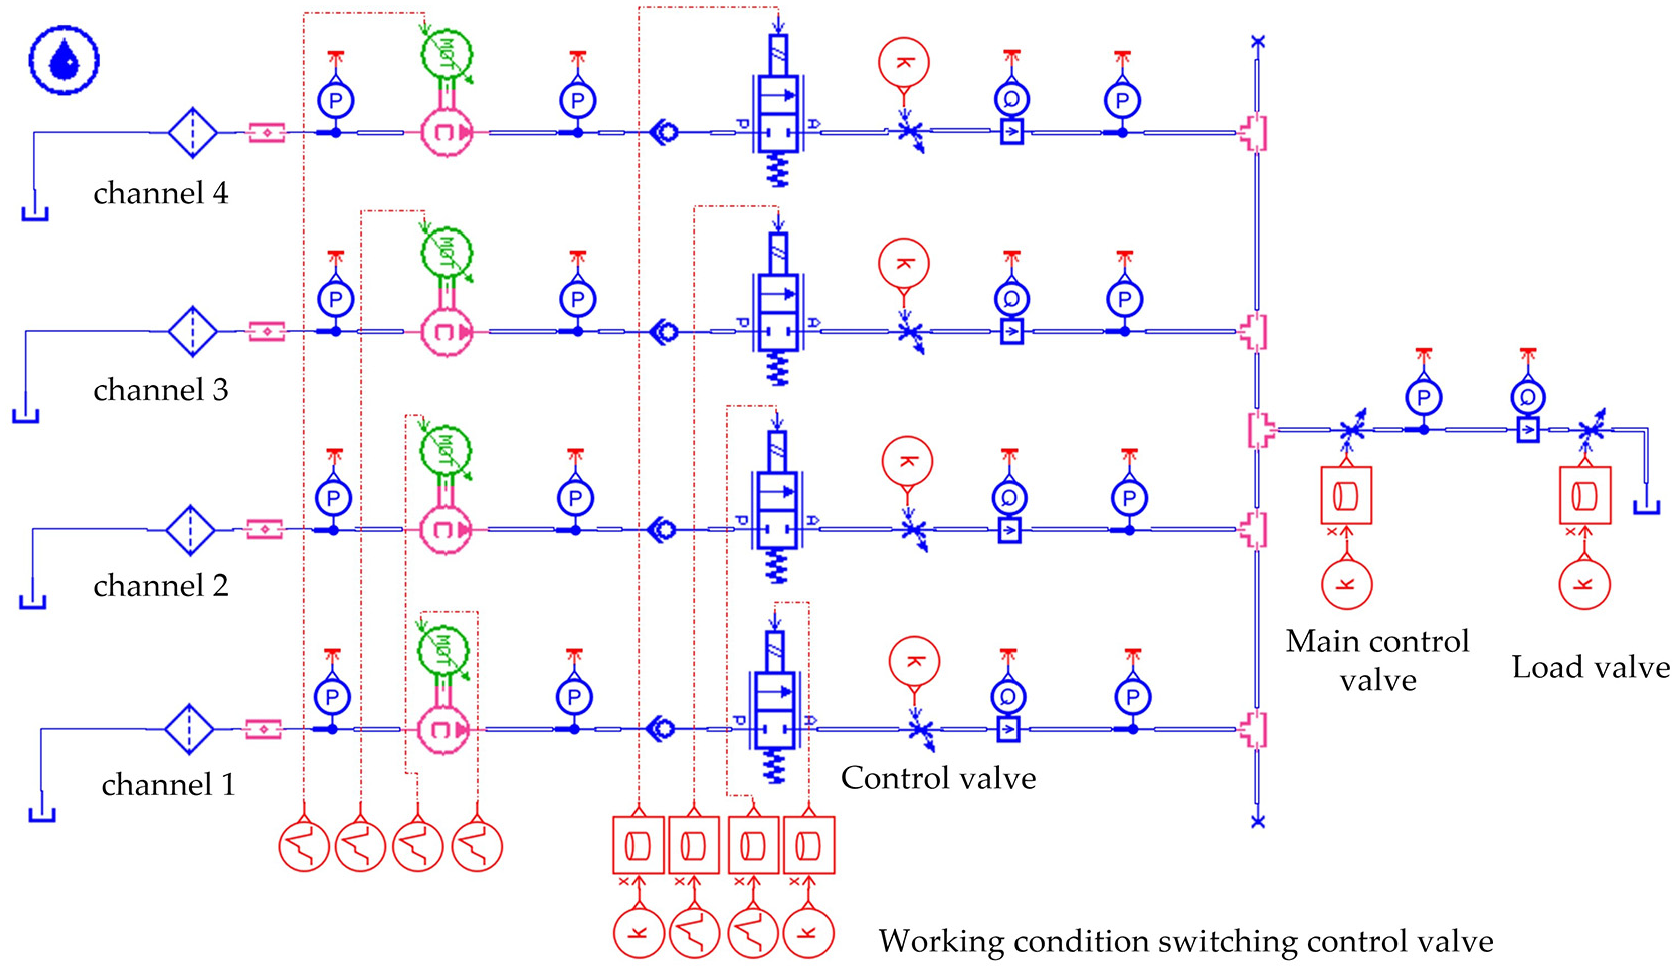
AMESim simulation model of experiment platform.
The validation of the simulation model of the multi-channel fluid supply experimental bench encompasses two aspects of constant flow performance and transient flow performance. Constant flow performance is defined as the characteristics of the pressure and flow rate of the main line when the system is stable. The verification of the model is achieved by actuating centrifugal pumps with varying numbers of branches and applying diverse loads to the primary conduit (the valve at the conduit’s terminal point is employed to simulate the load on the pipeline). Subsequent to the system’s stabilization, the pressure and flow rate of the primary conduit are measured. Transient flow performance verification refers to the characteristics of the main line pressure and flow over time when the system state changes. In this case, the three branches run in parallel, giving the main regulating ball valve an opening of 0%–100% of the control signal, to obtain the main line pressure and flow over time characteristics. The simulation model and the experimental platform are set with the same parameters, and the obtained simulation data are compared with the experimental data. The verification of constant flow and transient flow performance is shown in Figure 3.
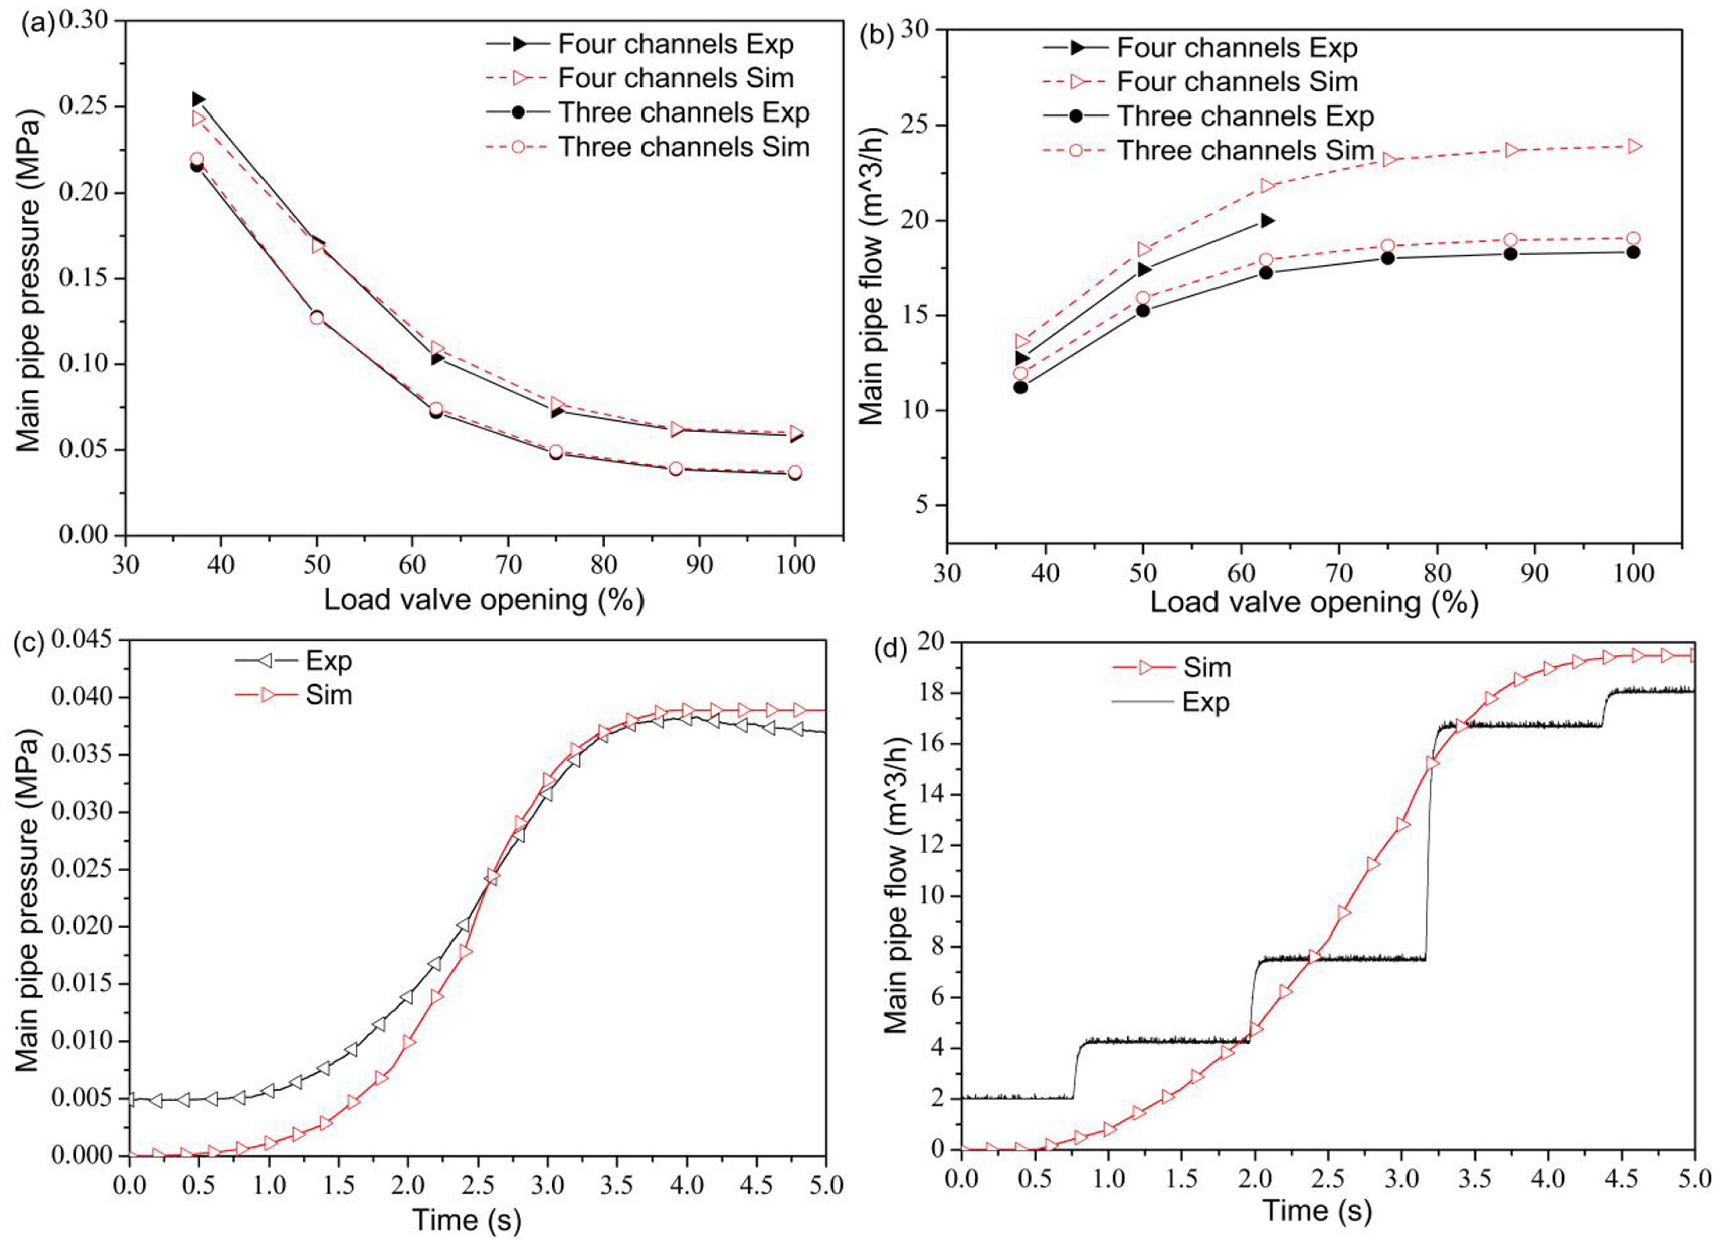
Experiment and simulation flow performance: (a) the pressure change of the constant flow, (b) the flow change of the constant flow, (c) the pressure change of the transient flow, and (d) the flow change of the transient flow.
The findings from the experimental bench and the simulation model, in both constant and transient flow states, demonstrate a similar overall trend. However, both models exhibit certain inaccuracies, and the simulation model can be regarded as a reproduction of the experimental bench. Furthermore, the process of building and verifying the simulation model is described in our previous research. 26
Mathematical model of hydraulics
There are two different hydraulic conditions, steady-state and transient, for multi-channel confluent supply under different conditions. The steady-state condition pertains to the hydraulic conditions of the system’s water flow, such as pressure, flow, and resistance, which remain stable and unchanged under the pipeline flow state. On the other hand, the transient condition refers to a system of water flow state with corresponding changes in a time flow state. The research and discussion of the agglomeration of water supply pressure and flow rule of change require consideration of two important conditions: steady-state and transient state. The steady-state condition is a prerequisite for the transient state analysis. Based on the steady-state condition, the pressure and flow rate of change characteristics can be obtained through transient flow state analysis. A hydrodynamic mathematical model that aligns with these characteristics is proposed.
Steady-state condition
It is assumed that the multi-channel concentrated water supply system is a one-dimensional pipeline. The relationship between pressure drop and flow rate of each pipeline element in the system can be described by a dimensionless damping coefficient. The static equilibrium equations are detailed below.
Total pressure drop equations for each channel:

Where, λz represents the damping coefficient of the channel electric control valve; λi is the damping coefficient of the components in the channel; P11, P22, P33, and P44 respectively represent the pressure of the channel 1, channel 2, channel 3, and channel 4 at the connection with the gathering device, it can be assumed that P11, P22, P33, and P44 are equal under steady-state conditions. As the centrifugal pumps in the parallel channel circuit are of the same model and operate at the industrial frequency, it can be assumed that P1 = P2 = P3 = P4, Q1 = Q2 = Q3 = Q4.
Flow head characteristic equation for centrifugal pumps:

Where, K1 is a constant; K2 and K3 are coefficients that can be determined by the pump’s characteristic curve.
Confluent pipe pressure drop equations:
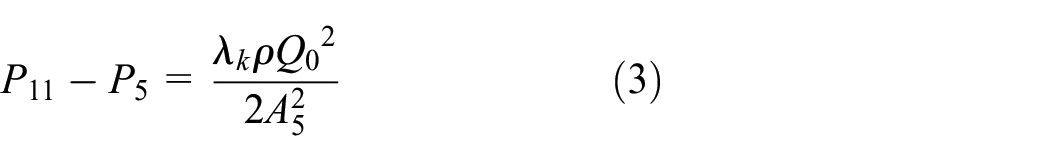
Where, P5 is the pressure at the junction of the main pipe and the confluent pipe; A5 is the cross-sectional area of the confluent pipe; Q0 is the flow rate through the confluent pipe; λk is the damping coefficient of the confluent pipe.
Main electric control valve pipe pressure drop equation:

Where, λv is the damping coefficient of the main electric control valve.
Pressure drop equations for water-using systems:

Where, λd is the damping coefficient of the fire guns or pressurized pumps in the water system; λi is the damping coefficient of the components in the water system; Ad denotes the cross-sectional area of the inlet of the components in the water system.
The equation above allows for real-time monitoring of the pressures (P11, P1, P0) and flow rates (Q1 and Q0) of each channel through sensors. Additionally, the damping characteristics of the motorized control valves of the channel and main pipe can be obtained through experiments. The system operates as a static balance system under steady-state working conditions. When the parameters for gathering and supplying water change, such as a change in channel pressure due to uncertain factors, the pressure of the main pipe after the water is gathered and supplied will also change. This will eventually reach a new static equilibrium. The amount of change in each parameter during the two static equilibrium processes can be calculated using the above formula.
Transient condition
During the operation of the multi-channel water supply system, any changes to a component’s working state or external interference will impact the pressure and flow of the main pipeline, resulting in transient flow. As a result, the pressure drop control equations of the steady-state condition are not applicable. Therefore, in case of dynamic changes in the confluent water supply system, it is necessary to conduct dynamic transient analysis on the multi-channel confluent water supply system. This will establish non-constant flow control equations for pressure and flow of the MCCS, and obtain a solution model for the transient flow and pressure of all system components and pipelines.
The dynamic transient analysis of the concentrated water supply pipe was conducted based on the characteristics of the MCCS. The analysis was carried out according to the unsteady flow of incompressible fluid, and the motion equation and continuity equation were established. The transient flow phenomenon in the system was analyzed using the method of characteristics. This section presents a numerical analysis and derivation of the transient flow system, based on the following assumptions: elastic and linear deformation occurs between the pipeline and water when the concentrated water supply pipeline is full at any time. The liquid water is considered a homogeneous fluid with one-dimensional flow, and the flow friction loss is the same under different states.
Fundamental equation of transient flow
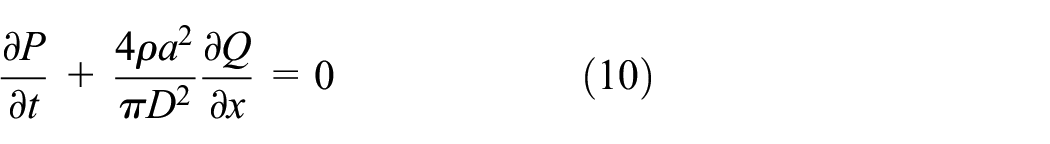
The governing system of equations for transient flow in a pipeline includes the continuity equation and the equation of motion, 27 as shown below.


Where, H is the transient measured pressure pipe head; t is the time vector; V is the average velocity of the transient pipe cross-section; x is the distance vector along the pipe axis direction, with the upstream direction being negative; a is the wave velocity of the transient pressure wave; θ is the angle between center line of pipe and the horizontal plane; f is the friction coefficient of the pipe; D is the diameter of the pipe; g is the acceleration due to gravity.
In practical applications of the MCCS, it is assumed that the pipeline is horizontal and that any pressure changes caused by differences in height are negligible. The continuity equation and the motion equation can be simplified as follows:


This paper focuses on the change of pressure and flow rate in the confluent water supply. To ensure clarity, the flow rate in the above equation has been replaced with Q = VD 2 π/4, and the head has been converted to pressure P = ρgH. The continuity equation and the equation of motion of the multi-channel confluent water supply pipeline are presented.

Method of characteristics
The equations governing the non-constant flow are a first-order set of linear hyperbolic partial differential equations that cannot be solved directly. Currently, most transient pipe flow problems dealing with complex systems are based on the method of characteristics. The main idea of the method is to convert the hyperbolic partial differential equations into two sets of compatible ordinary differential equations along the eigenline, and then use the finite difference method to solve the ordinary differential equations.28,29 The method of characteristics is suitable for analyzing a single pipeline during a specific time period in water supply pipe under transient conditions. This makes it possible to use it for the analysis of MCCS systems.
The control equations (10) and (11) were transformed along their characteristic lines, resulting in two sets of ordinary differential equations: C+ and C−.

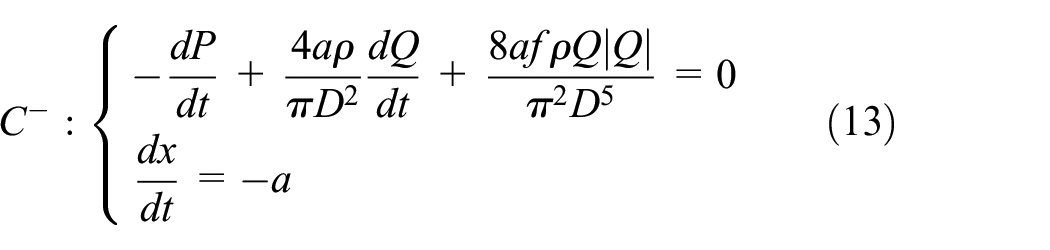
Where, the equation dx/dt = ±a represents the characteristic line.
The system of ordinary differential equations is solved using the finite difference method. In the transient flow process, the first-order format is used to approximate the finite difference equation when the friction term is nonlinear:
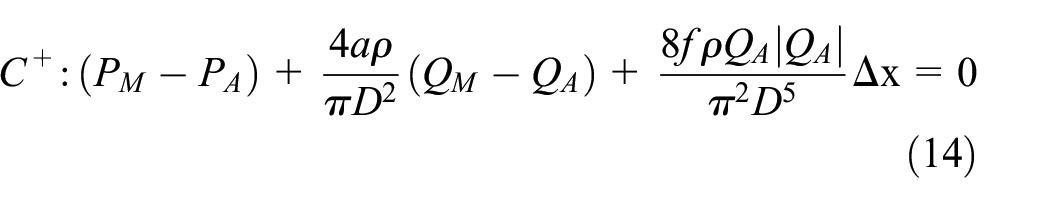

To simplify the solution, the system of finite difference equations at any node of the grid is arranged into the general form of the method of characteristics.


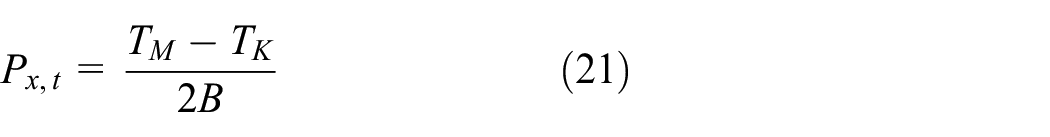
The coefficients TM, TK, and B are defined as follows:


The pressure and flow rate at any grid point at time t can be solved using the general form of the system of equations of the characteristics method.
When solving the numerical model of the MCCS system, the pressure and flow rate of each cross-section of the pressurized pipeline can be obtained by iteratively calculating it through the equations mentioned above. It is important to note that at the boundary of the pipeline, there is only one compatibility equation. Therefore, it needs to be supplemented with the corresponding boundary condition equations for a joint solution. The following section provides a derivation of the boundary condition equations for confluent water supply.
Boundary condition
When modeling transient flows, it is important to treat elements like centrifugal pumps, electric control valves, and aggregate piping structures in the MCCS system as boundary conditions. The specific derivation process is described below.
(a) Centrifugal pump
Assuming normal operation of the centrifugal pump in the MCCS process, regardless of start-stop, accidents, or other conditions, the transient conditions in the water supply switching process are regulated through the channel regulating valve. The pressure P1,t and flow rate Q1, t of the centrifugal pump in channel 1 can be expressed by the quadratic curve.

The equation for line compatibility characteristics along the C− axis at the suction port section of a centrifugal pump is:

By combining the above two equations:
(b) Electric control valve
In multi-channel confluent water supply processes, electric control valves can be either ball valves or butterfly valves. The pressure and flow relationship equations for such valves are usually orifice outflow formulas, which are available at steady state conditions.
Where, Q0 represents the flow passes through the electric regulating ball valve under steady state condition; ΔP0 represents the pressure difference before and after the electric regulating ball valve; CD represents the flow coefficient of the regulating ball valve; SG represents the flow area of the regulating ball valve.
It is assumed that the relationship between pressure and flow remains the same during valve regulation in non-constant flow states as it does during steady-state operation.
Where, Q is the flow rate through the regulating valve under transient conditions; ΔP is the pressure difference before and after of the regulating valve under transient conditions.
The control valve’s dimensionless hydraulic opening is now defined as:

The simultaneous solution of the equations (26)–(28) gives the following result:

Combined with the eigenline compatibility equation along C+, the solution is obtained:

Where:

P 0 is the pressure when the regulating valve is fully open; Q0 is the flow rate through the regulating valve.
(c) Confluent pipe structure
The water supply structure in a multi-channel system consists of a confluent pipe that carries water from channel 1, channel 2, channel 3, and channel 4 to the main pipe 6. Figure 4 shows the six structural parts with two types of boundary conditions. The continuity equation, combined with the corresponding compatibility equation, establishes the following equations:

Schematic diagram of the structure boundary of the collecting pipe.
Assuming negligible local head loss between the two cross sections, the system of type I equations is obtained.

Where, P1,t, Q1,t and P15,t, Q15,t denote the average pressure and instantaneous flow rate for sections 1 and 15, respectively; TM1, TK15, B1, and B15 are correlation coefficients.
The transient flow and pressure at each section are obtained by solving the system of equations (32).


The system of type II equations:
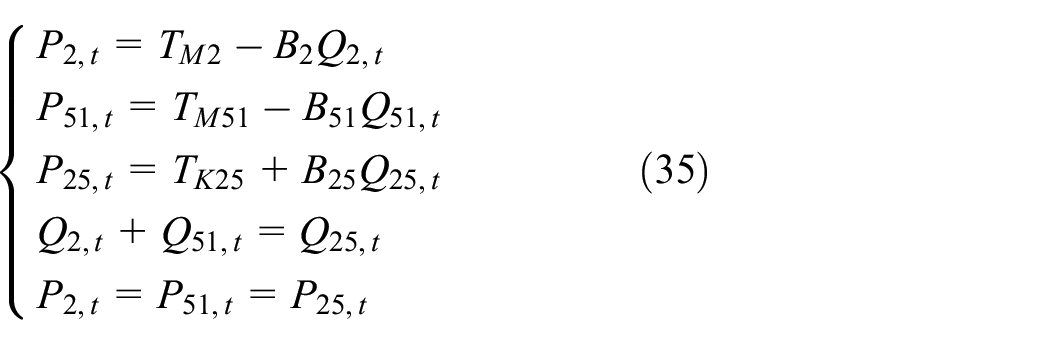
Where, P2,t, Q2,t, P25,t, Q25,t and P51,t, Q51,t denote the average pressure and instantaneous flow rate for sections 2, 25, and 51, respectively; TM2, TM51, TK25, B2, B25, and B51 are the correlation coefficients.
Solve the system of type II equations:


The transient hydrodynamic model of the multi-channel confluent water supply system includes complex boundary conditions, consisting of hydraulic elements and pipelines connected alternately. Establishing a hydraulic model and deriving a calculation method for both steady state and transient conditions of a MCCS system can aid in comprehending the dynamic solution process of said system. Based on the solution steps outlined above, it is evident that the output pressure and flow of the water supply system can be affected by several factors, including the number of centrifugal pumps in parallel (i.e. the number of parallel channels), the operating characteristics of the centrifugal pump, the flow characteristics and execution time of the electric control valves, and changes in system resistance (such as load valve opening and distance of channel water transported). It is important to consider these factors when evaluating the performance of the water supply system.
Results and discussion
Analysis of the influence of working parameters of confluent water supply system under conventional working conditions
A detailed analysis of the MCCS system was conducted using an experimental bench and a simulation model based on a mathematical model. The details are the number of parallel channels, the frequency of the pump motor, and the load valve opening, which are experimental data, and the distance of channel water transported, which is simulation data. The aim was to investigate the influence of the operating parameters of the confluent water supply system on the pressure and flow rate of the system’s main pipe under conventional operating conditions. The conventional operating condition belongs to the steady-state condition.
Number of parallel channels
The number of parallel channels determines the pressure and flow rate of the main pipe in the experimental platform. This section examines the impact of the number of parallel numbers on the pressure and flow rate of the main pipe while keeping other parameters constant. Such as, the centrifugal pumps operate at a frequency of 50 Hz, the distance of the channel water transported is 1 m, and the range of load valve openings is from 37.5% to 100%.
Figure 5 displays the curves for main pipe pressure and flow rate over time as the number of parallel channels is varied in the experimental bench. The simulated load valve opening was 62.5%, and the centrifugal pump operated at industrial frequency. The main line pressure curve includes both the original and smoothed data. Figure 5 shows that the pressure and flow of the main pipe in the MCCS system increase as the number of parallel channels increases. It is important to note that the pressure of the main pipe increases exponentially with the number of parallel channels. The pressure in the main pipe increases by approximately 0.037 MPa for each additional channel. However, while the main flow increases with the number of parallel channels, this increase becomes progressively smaller. Specifically, the flow rate increases by 5.34, 4.06, and 3.12 m3/h when going from one to four channels, respectively. From the perspective of the confluent supply system’s application scenario, the optimal number of parallel channels is not necessarily the highest flow rate of the main pipe. The efficiency of energy conversion must also be taken into account. The research results of the optimization method for parallel pump groups are not the focus of this paper and will not be repeated here.

Main pipe pressure and flow change curve with time when the number of parallel channels increases: (a) pressure and (b) flow.
As the MCCS system operates under load, it is important to consider the changes in pressure and flow rate in the main pipe when the number of parallel channels changes with varying loads. In the experiment, various openings of the main pipe simulation load valve were selected as loads. The pressure and flow of the main pipe corresponding to different numbers of parallel channels under a certain load were tested, as shown in Figures 6 and 7. Analysis of the curves reveals that the number of parallel channels is proportional to the main pipe pressure and flow, regardless of the load valve opening size. The slope of the curves for main pipe pressure is steeper when the load simulation valve opening for the main pipe is low. This means that increasing the number of parallel channels results in a greater increase in pressure compared to when the load simulation valve opening is high (>62.5%). On the other hand, in terms of the main pipe flow, when the main pipe load simulation valve opening is below 62.5%, the pipe resistance increases, resulting in a lower flow rate. This causes the slope of the curve to decrease, resulting in a smaller increase in flow rate with the addition of more paralleling channels.

Influence of the number of parallel channels on main pipe pressure.

Influence of the number of parallel channels on main pipe flow.
Frequency of the pump motor
The operating frequency of a centrifugal pump refers to the motor frequency when the pump is working in parallel with other pumps on the experimental platform. The frequency directly affects the flow rate and pressure of the channel pipe, which in turn affects the pressure and flow of the main pipe. This is used to simulate changes in the centrifugal pump performance of the water power unit in the MCCS system. The experiment adjusts the centrifugal pump variable frequency motor using a frequency converter set to 50, 48.8, 42.5, 36.7, and 29.2 Hz. This section focuses on studying the pressure and flow of the main pipe as the centrifugal pump frequency changes between 29.2 and 50 Hz, while the three channels are connected in parallel and operated at the same frequency 50 Hz. The channel through which water is transported is set at a distance of 1 m.
Figures 8 and 9 show that the main pipe pressure and flow increase with centrifugal pump frequency for seven different load simulation valve openings, while keeping the remaining parameters constant. As the frequency of the centrifugal pump increases, the mechanical energy that can be converted by the pump also increases. This results in an increase in the kinetic energy of the fluid in the channel pipe, which in turn leads to an increase in the pressure and flow of the main pipe after the confluent. Among the seven different load valve openings, the highest pressure corresponds to a load valve opening of 25%, while the highest flow corresponds to 100%. The main pipe pressure for 25% load valve opening is highest at a frequency of 50 Hz, with a value of approximately 0.28 MPa. The maximum flow, on the other hand, is observed at 100% load valve opening and a frequency of 50 Hz, with a value of approximately 18.25 m3/h.

Influence of centrifugal pump frequency on main pipe pressure.

Influence of centrifugal pump frequency on main pipe flow.
Load valve opening
The MCCS experiment platform achieves load changes through the load simulation ball valve located at the end of the main pipe. It is important to note that subjective evaluations have been excluded from this explanation. This section examines the effect of load simulation valve opening on main pipe pressure and flow, assuming that all other parameters remain constant. Such as, the number of parallel channels is three, the distance of the channel water transported is 1 m, and the centrifugal pumps operate within a frequency range of 29.2–50 Hz.
Using a typical three-channel parallel frequency operation as an example, this experiment examines the effects of changing the opening of the main pipe load simulation ball valve from 0% to 100% while keeping all other factors constant. Figure 10 shows the resulting changes in the main pipe pressure and flow rate over time. As the load simulation valve opening increases, the main pipe pressure decreases and the flow rate increases. When the load simulation ball valve is fully closed, the pressure in the main pipe is approximately 0.3 MPa, and the flow is 0 m3/h. When the load simulation ball valve is fully open, the main pipe pressure drops to about 0.04 MPa, and the maximum flow rate is approximately 18.2 m3/h. Changes in the load simulation ball valve opening have a significant impact on the pressure and flow in the main pipe.

Main pipe pressure and flow change curve with time under the load valve opening 0%–100%: (a) pressure and (b) flow.
To investigate the impact of load valve opening on the main pipe pressure and flow, experiments were performed on a test bench. A series of centrifugal pump operating frequencies were simulated, with varying loads, and the results plotted as a curve in Figures 11 and 12. The figure shows that the main pipe pressure is more sensitive to changes in centrifugal pump frequency when the load simulation valve opening is lower. The sensitivity gradually decreases with an increase in the load valve opening. As for the main pipe flow, its sensitivity to centrifugal pump frequency increases with an increase in the load simulation valve opening. Analyzing the rate of change of pressure and flow rate, it can be observed that with an increase in the load valve opening, the rate of change of the main pipe pressure and flow is steep initially and then becomes smooth.
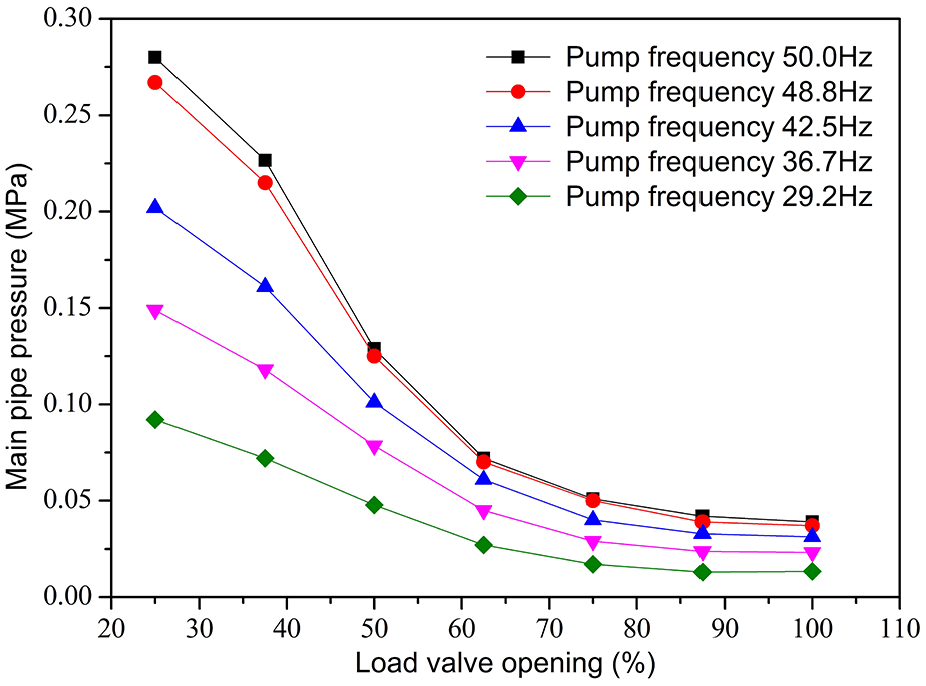
Influence of load valve opening on main pipe pressure.

Influence of load valve opening on main pipe flow.
Distance of channel water transported
The aim of this study is to investigate the impact of the length of water pipes on the output performance of the confluent water supply system in a multi-channel setup. Assuming that all other parameters remain constant, such as the number of parallel channels being three, the centrifugal pumps operating at a frequency of 50 Hz, and the range of load valve openings being from 37.5% to 100%. The present study will examine the effect of the length of water pipes laid in each channel on the pressure and flow rate of the main pipe. To achieve this, experiments will be conducted on a simulation model. The resulting values will be plotted as curves, as illustrated in Figures 13 and 14.

Influence of channel water transported distance on main pipe pressure.

Influence of channel water transported distance on main pipe flow.
Upon analyzing the curves presented in Figures 13 and 14, it is evident that as the length of the channel pipe increases, both the main pipe pressure and flow gradually decrease. The main pipe pressure and flow decrease by one unit for every 2 m unit, with the reduction becoming smaller over time. The reason for this is that the pressure change in the pipe is mainly affected by the resistance loss along the branch pipeline. The average flow along the resistance loss and the cross-section of the pipeline are proportional to the square. Therefore, the decrease in flow rate caused by the resistance loss leads to a decrease in the flow rate along the resistance loss, and so on. It should be noted that, in order to analyze the influence of the channel pipe length on the pressure and flow of the main pipe, this simulation assumes that the length of each channel pipe changes synchronously. This means that the pressure at the connection of each channel with the collector pipe remains constant.
Analysis of the influence of working parameters of confluent water supply system under switching conditions
The switching of water sources in a multi-channel confluent water supply process is a common transient flow event. An irrational switching method can cause not only the channel water hammer phenomenon but also harm to the water system. When considering channel switching conditions, it is important to take into account two working parameters: the switching valve action execution time and the valve switching interval time. Figure 15 displays the curve of pressure change in the main pipe caused by channel switching in the experimental setup. The pressure change is divided into pressure drop and pressure rise. The stability of the confluent water supply is studied in this section by measuring the pressure drop and pressure rise in the main pipe. In this section, the frequency of the pump motor and the valve switching interval time are experimental data. The distance of channel water transported is simulation data.

Schematic diagram of pressure change in main pipe caused by channel switching.
Frequency of the pump motor
The experimental bench’s frequency converter is used to change the operating frequency of the centrifugal pump. Altering either the centrifugal pump operating frequency or the load valve opening can result in a change in the main pipe’s pressure. However, the former changes the energy source of the pressurized pipe, while the latter increases the system’s pipe resistance, leading to greater losses. Note that the frequency of the centrifugal pump in the channel of this section is changed synchronously and by the same amount. In this section, we analyze the impact of varying frequencies on the pressure drop when there are three parallel channels with a channel distance of 1 m, the load valve opening of 85%, and switching valves with action execution times of 1, 5, 10, 20, and 30 s, respectively.
Figure 16 displays the variation curve of the main pipe pressure drop with centrifugal pump frequency under different switching valve action execution times. As shown in the figure, the main pipe pressure drop increases with the increase in centrifugal pump frequency in the case of synchronous switching and the rest of the operating parameters being the same. The law of this increase is independent of the switching time. The different switching times are caused by varying main pipe pressure drop values at the same operating frequency. Following the operating principle of centrifugal pumps, an increase in pump speed results in an increase in flow and pressure for the same pipe resistance. In order to reduce the influence of pressure drop due to pressure change, the change rule of pressure drop is analyzed from another dimension, that is, pressure drop rate, which is defined as follows.

Where, λf is the pressure drop rate, Δp is the pressure difference before and after under transient conditions. pout is the pressure of the pipe.
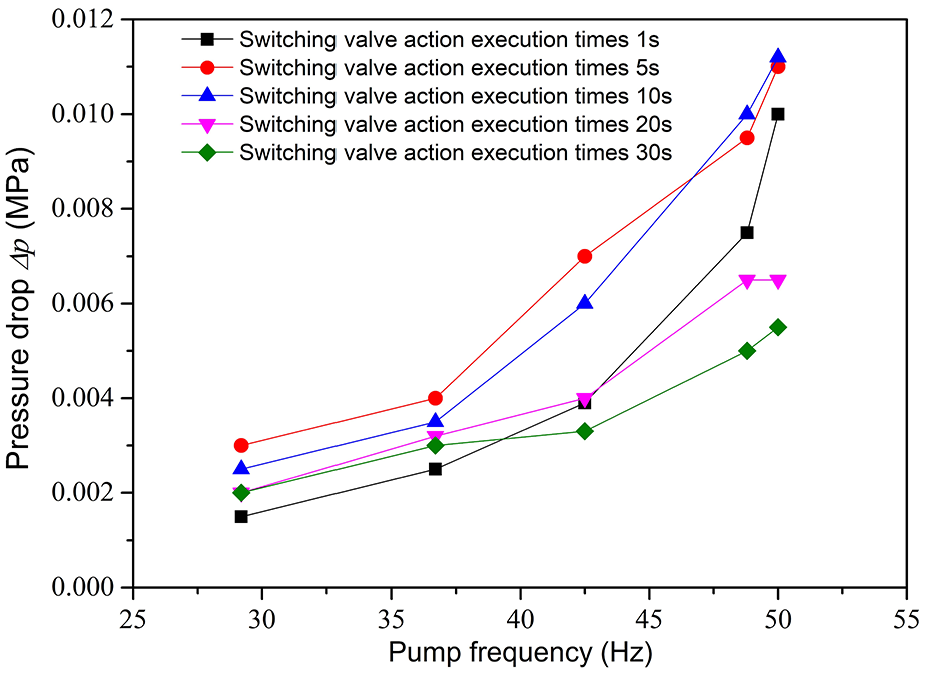
Influence of the pump frequency on main pipe pressure drop.
Table 2 presents the execution time for switching valve action at a pressure drop rate of 10 s, based on the corresponding relationship between centrifugal pump frequency and pressure drop rate. The analysis indicates that as the frequency increases, the pressure drop initially decreases and then increases, with a maximum difference of approximately 10%. This demonstrates that the change in frequency of the centrifugal pump has a linear impact on the pressure drop value of the main pipe, which is different from the rule governing the change in pressure drop value caused by a change in load.
Differential pressure drop rate under different working frequency.

Valve switching interval time
The valve switching interval time refers to the time interval between the two switching channels of the valve when they begin to act. It can be divided into two states: early switching and delayed switching. In this section, ‘early’ and ‘delayed’ refer to the backup channel of the valve’s early and delayed opening. The experiment introduces the load valve opening, which represents the main pipe resistance. In addition, the number of parallel channels is three, the distance of the channel water transported is 1 m, and the centrifugal pumps operate within a frequency range of 29.2–50 Hz. The resulting curves of the main pipe pressure drop and pressure rise under different load valve openings are shown in Figures 17 and 18.

Influence of valve switching intervals on the main pipe pressure drop.

Influence of valve switching intervals on the main pipe pressure rise.
The curve in Figure 17 shows that in delayed switching, the pressure drop in the main pipe increases initially with the increase of the valve interval time, regardless of the load valve opening, and then remains stable. During the same valve switching interval, the main pipe pressure drop value varies depending on the load valve opening. Specifically, in the range of 50%–100% load valve opening, the pressure drop value decreases as the load valve opening increases. However, for load valve openings less than 50%, the changes in main pipe pressure drop value are more complex. Therefore, in the MCCS system, the pressure drop value can be affected by the valve switching interval time. However, it is important to ensure that the pressure drop value does not exceed the limiting value. The interval time should be minimized to reduce its influence on the pressure drop value.
The pressure change in the main pipe during advance switching can be observed in Figure 18. It includes both pressure drop and pressure rise, with the red line dividing the figure. Pressure drop occurs below the red line, while pressure rise occurs above it. When the switching time is 0 s, that is, synchronous switching, it belongs to the pressure drop below the red line. The previous parts in this chapter have been studied with synchronous switching as the premise. The figure shows that as the valve switching time increases, the pressure rise in the main pipe also increases. This relationship is independent of the size of the load valve opening. Additionally, the pressure rise in the main line follows a consistent pattern with the pressure drop within the same switching interval. Therefore, regardless of whether the switching occurs early or is delayed, the pressure drop and rise on the main pipe are the same with respect to the valve switching interval time. In other words, as the switching interval time increases, the pressure change value increases until it reaches a stable state.
Distance of channel water transported
The research object in this section is the simulation model as changing the length of the channel pipe in the experimental bench is difficult. The simulation model is configured with a three-channel road frequency parallel operation and a switching valve execution action time of 30 s. Synchronous switching is employed to obtain the law of change in the pressure drop value of the main pipe as a function of the channel pipe length and the degree of valve opening under different loads, as shown in Figure 19. The figure shows that when the remaining operating parameters are unchanged, the main pipe pressure drop value gradually decreases with an increase in the length of the channel pipe. When considering the opening of another variable load valve, if the load valve opening is above 50%, the main pipe pressure drop increases with the increase of the load valve opening in the same length of the channel pipe. Conversely, if the load valve opening is below the dividing line, the main pipe pressure drop value is less sensitive to the length of the channel pipe. The channel pipe length is the along-track loss. An increase in channel pipe length results in lower energy from the water source. This is equivalent to a reduction in the operating frequency of the centrifugal pump. The effect on the main pipe pressure drop value is consistent.

Influence of channel water transported distance on main pipe pressure drop.
Conclusions
This paper investigates the flow characteristics of the MCCS system based on experiments and simulations. Firstly, the paper describes the establishment of a hydraulic model for the MCCS system under steady state and transient conditions. It also includes the deduction of numerical solution methods for the pressure and flow of the system, as well as an analysis of the factors that affect the numerical solution. Then, based on the experiments and simulations, this study investigates the influences of the factors on the output characteristics of the MCCS system under conventional working conditions and switching conditions, respectively.
Under conventional working conditions (steady state):
As the number of parallel channels increases, the flow and pressure of the main pipe also increase, but the rate of increase gradually decreases.
The pressure of the main pipe is negatively correlated with the pipe valve opening and water delivery distance and positively correlated with the centrifugal pump operating frequency.
The flow of the main pipe is negatively correlated with the transported distance of the channel water and positively correlated with the opening of the load valve and the working frequency.
Under switching conditions (transient conditions):
The main pipe pressure drop value shows an increasing trend with an increase in the operating frequency of the centrifugal pump.
As the switching valve action execution time increases, the pressure drop value of the main pipe also increases before gradually decreasing to a stable level. The highest point is reached at a switching time of 10 s.
The relationship between the valve switching interval time and the main pipe pressure drop value and the pressure rise value is such that they first gradually increase to maintain stability. The difference lies in the same interval time when the pressure drop value is greater than the pressure value.
From a multi-dimensional analysis, during the 30 s execution time of the switching valve action, the pressure drop value on the main pipe is primarily influenced by the number of parallel branches and the operating frequency of the centrifugal pump, rather than the valve action time. Furthermore, if the load valve opening is less than 50%, the pressure drop value on the main pipe is weakly influenced by the valve switching interval time and the distance of channel water.
In conclusion, for steady-state systems, the inverse relationship between pressure and load valve opening applies universally to MCCS designs. For transient conditions, minimizing valve switching intervals (<10 s) and maintaining load valve openings >50% can mitigate pressure fluctuations in most MCCS configurations.
The research presented in this paper is predicated upon the assumption that the power source of each channel is identical. However, the actual fire-fighting and rescue operations involve disparate models of water supply trucks, which consequently impact the efficacy of the multi-channel pooled water supply system in terms of water supply. Consequently, it is essential to investigate the flow characteristics of the parallel channel pressure (centrifugal pumps with varying operational frequencies, power, channel distances, etc.) within the context of the water supply system. This represents the subsequent stage of the research program.