
Abstract
Based on theoretical, empirical and semi-empirical models, extensive literature covers various approaches to characterize the mechanical properties of polymer composites filled with different reinforcements. However, those published models show discrepancy with results obtained from experiments. The above situation has been modified by using a nonlinear polynomial regression technique in these models. This paper reports how cardinal polynomial regression models are used, which is very important for anybody who thinks about a clear curvilinear relationship among the variables. As an application, its inclusion includes the polynomial regression model that defines the relationship in terms of desired properties with drilling depth after firstly being elaborately manipulated to imitate mechanical properties between a continuous and dispersed phase. Evaluation of several statistical performance metrics-basically through measures such as SSE, MSE, RMSE, R2 and adjusted R2-have been computed to judge the enhanced plane model. Model coefficients are determined using the least squares method. The modified models were then used to predict mechanical properties of Low Density Poly Ethylene (LDPE) filled with copper (Cu) powder. These results showed an excellent correlation with the experimental results published earlier, thus validating the modified models’ reliability and accuracy.
Introduction
Production of polymeric composites is highly modified by the use of different Fillers, as this addition results in improved Mechanical, electrical and thermal properties. Metal filled polymers are light in weight and are cheaper in cost. They are used for electromagnetic shielding, as drug delivery agents, as thermal and sound insulators, in piezoelectric sensors and actuators, which convert mechanical energy into electrical signals and vice versa etc. Thus, effect of metal filler in polymers play an important role scientifically and practically too. The size and distribution of filler particles play a key role in the mechanical properties of polymers.
When combined with a metal, polymers exhibit enhanced mechanical properties and semiconductor-like electrical characteristics. 1 The mechanical, Thermal and Electrical properties of Composites of Low-Density Polyethylene (LDPE) and Linear Low-Density Polyethylene (LLDPE) using Cu were presented by Luyt et al. 2 and observed that except Young’s Modulus, other mechanical properties for both the composites display poor properties in comparison neat polymers. On addition of filler content at 82 vol. % (polymer): 12 vol. % (filler), a significant reduction in stress at break is seen for LLDPE and a slight decrease is seen for LDPE. Talking about Young’s modulus, as the crystallinity of LLDPE is more so the polymer and its composites show somewhat elevated Young’s modulus details as compared to LDPE and its composites, resulting less flexible of LDPE. The mechanical properties of LDPE reinforced with 10 µm sized Nickel (Ni) particles were observed by Tripathi and Dey 3 and found that at room temperature, the Young’s Modulus varies directly with filler concentration and at 25 vol. % loading it rises to 364.55 MPa. In LDPE/Ni composites, a filler concentration under 10 vol. % can lower tensile strength, whereas a concentration above 10 vol. % improves it. There is an exponential decrease in elongation at break with Ni loading. The Mechanical properties of High-density Poly Ethylene (HDPE) loaded with Ni powder were discussed by Krupa et al. 4 and observed that at 20 vol. % of Ni concentration there is noticeable growth in the Young’s modulus from 606 to 1057 MPa and becomes stable afterwards. Regarding stress at break, it decreases at low loadings (<10 vol. %) but at higher (>10 vol. %) concentration the stress at break increases. Ibrahim and Samy 5 prepared and presented the mechanical properties of HDPE and Poly Propylene (PP) with different Metal fillers. There is increase in strength of pure HDPE from 24 to 75 N/mm2 when 35 vol. % powdered Cu is added but for Aluminium (Al) powder on increasing its content to 20% the ultimate strength increased but it starts decreasing afterwards and reaches 41 N/mm2 at 35%. It was also observed that the fracture strain also shows a decline from 85% to 57% at 35% of Al powder. Hence applicable for High compression strength materials. For PP/Cu Composites the ultimate strength is enhanced from 73 to 90 N/mm2 as the Cu concentration increases from 0% to 10%. And for PP/Al composites, the ultimate strength only slightly increase from 73 to 76 N/mm2 till Al content reaches 10%. The fracture strain declines from 90% for pure PP to 82% for PP/Al (80:20). Thus, the mechanical behaviour of HDPE and PP composites using Cu and Al improves but in a very limited window of metal concentrations. The impact of LDPE particle size on LDPE/Cu composites was studied by Tang et al. 6 and observed that on reducing the size of LDPE in LDPE/Cu composites, the elongation at break value increases but tensile strength and modulus of elasticity is lowered. The effect of iron (Fe) and Al on mechanical properties of Maleate Polyethylene (MAPE) polymers was studied by Ramezani Kakroodi et al. 7 and observed an increase to 98% in the tensile strength at 50 vol. % of Fe filled composites and for same content 50% of Al filled MAPE composites there is relatively less 86% increases in tensile strength. At 50% of iron loading, the Young’s modulus was enhanced by 800%. The density a well as stiffness also improves with metal addition. But, on a lower note the impact strength along with elongation at break were lowered on addition of both the metal fillers.
Tavman 8 inquired into the thermal conductivity and mechanical properties of Al powder-loaded HDPE composites with filler content ranging from 0% to 50% by volume. The findings revealed that higher Al content resulted in decreased tensile strength and elongation at break, due to the presence of structural discontinuities. At 50% Al filler, the tensile strength was 25% of neat HDPE. Elongation at break declined more quickly than predicted by the Nielson model up to 20% Al, remaining nearly constant between 20% and 45%. The modulus of elasticity increased up to 12% Al content, with results aligning well with Einstein’s equation for low filler volumes. Głogowska et al. 9 analysed the mechanical properties of PP with different metal powder fillers like Al, Zinc (Zn), Tin (Sn), Fe, Cu with a variation in filler content ranging from 2.5 to 15 wt. %. Initially at 2.5% of Sn and 5% of Al, an increase of 10.74% and 8.26% in Young’s Modulus was observed, respectively and thereafter becomes stable. Similar initial behaviour was seen with Zn and Fe, but afterwards it decreases. The ensile strength enhances by 4.88% at 2.5% Sn and decreases afterwards. But for Al filler in all contents there is a decrease nearly 11.58% in the composite’s ultimate tensile strength. The breaking at stress is higher for all metals and becomes stable at a particular content. Olga et al. 10 used 65 μm sized Al powder in the content of 1, 2, 5, 10 or 20 wt. % with HDPE. At initial stage below 5 wt. % there is increase in tensile strength by only 1 MPa. Further increasing in filler content to 20 wt. % decreases the tensile strength by 12% as compared to pure HDPE with a reduced value 21.3 MPa. The tensile modulus reduces by 50–100 MPa for up to 5 wt. % and 10 wt. % of Al reinforcement. For higher content loadings tensile modulus increases. The elongation at break value decreases abruptly by 50% even at low Al loading 1 wt. %. Further increment of filler content results in deterioration of the elongation at break. A new composite with solid lubricating layered coating was developed by Difallah et al. 11 using 2, 6, 10 and 12 wt. % of Cu concentrations in LLDPE. The incorporation of Cu powder yields improved Young’s Modulus in compression to unfiled LLDPE with 855 MPa at 20 wt. %. The firmness also increases directly with increase in loading. The yield stress boosted to 24.8 MPa with 20 wt. % of Cu loading whereas that for pure LLDPE 18.5 MPa. Quite lower elongation is observed for Cu-filled LLDPE composites which decreases from 529% to 179.8% with Cu mass variation from 0 wt. % to 10 wt. %. The failure strain behaviour varies inversely with the addition of Cu content. Gibson et al. 12 conducted fire experiments up to 30 min on vinyl ester, glass–polyester and phenolic laminates using a cone calorimeter at heat fluxes between 25 and 100 kW/m2. The residual mechanical properties were investigated at room temperature after cooling. Tensile along with flexural properties were linked to the depth of char. The laminate had two layers: undamaged material and residual char. Tensile strength depended on the thickness of the undamaged layer, while flexural stiffness was proportional to the cube of its thickness, and flexural strength was associated to the square of the undamaged thickness. Jacob et al. 13 investigated the strain rate effects on the shear, tensile, flexural and compressive properties of fibre-reinforced polymer composites. For glass/polyester composites, changes in strain rate results an increase in UTS by 55% with. In unidirectional glass fibre/epoxy composites, dynamic strength was found to be thrice the static value, and the dynamic modulus was 50% higher. At higher strain rates (∼1000/s), tensile tests showed a significant increase in maximum strain and stress compared to quasi-static tests. Additionally, glass/polyamide composites exhibited a linear variation between tensile strength and the log of strain rate. Bedi et al. 14 conducted comparative analysis between polyester resins and epoxy, highlighting that epoxy polymer concrete exhibits significantly better durability and mechanical properties. The incorporation of glass fibres upgrades the post-peak performance of polymer concrete. Moreover, the toughness and strength of polymer concrete enhances with fibre reinforcement. It has also been observed that incorporating 15% fly ash (micro filter) can enhance compressive strength by up to 30%. Overall, polymer concrete shows significantly superior mechanical properties along with durability compared to standard Portland cement concrete. Uygunoglu et al. 15 observed that increasing waste material content led to greater internal friction between particles, resulting in lower slump flow and higher viscosity values for polymer composite blends (PCBs) compared to control mixtures. Except for 66%, almost all levels of waste material replacement, enhanced the Compressive strength of composites within 7 days of curing. The highest strength increase was encountered with the composites with 50% waste material across several curing ages. However, at the 100% waste material replacement, compressive strength was even lower than that of the control mixtures. Water absorption capacity peaked at 46% for composites with 66% waste content. Bolcu and Marinel 16 concluded that the mechanical properties of Dammar-loaded composite materials, incorporating two types of flax fabric with three different hybrid resins, show distinct trends. In hybrid resins, increasing the volume of Dammar leads to a decrease in modulus of elasticity and tensile strength, while elongation at break increases. Similarly, the composite materials with higher Dammar content outcomes in a reduction in modulus of elasticity, elongation at break and breaking strength. Numerous investigations have been conducted for enlightening the mechanical properties of polymer composites filled with fillers except metal particles.17–26 Okubo et al. 27 concluded that the reinforcement of bamboo fibre (BF) in polymer matrix exhibits superior mechanical properties. Salemane and Luyt 28 described the influence of the presence and the amount of Maleic Anhydride grafted Polypropylene (MAPP) as well as wood powder’s content and size, on the thermal and mechanical properties of polymer composites made of PP and wood powder. Krupa and Luyt 29 investigated some mechanical and thermal properties of LLDPE/wax blends. Krupa and Luyt 30 analysed the static mechanical properties such as the yield point, Young’s modulus and ultimate properties of crosslinked and uncross linked LLDPE/wax blends and their dependence on the amount of Dicumyl Peroxide (DCP) as the wax content and crosslinking agent. Luyt and Hato 31 investigated the thermal and mechanical properties under the presence of minor amounts of wax in LLDPE/LDPE blends. Fu et al. 32 conducted an in-depth review discussing the impact of particle loading, particle size and particle/matrix interface adhesion on the stiffness, toughness and strength of particulate polymer composites. Herrera-Franco and Valadez-Gonzalez 33 measured the mechanical behaviour of continuous henequen fibre reinforced HDPE composites.
PC containing vegetables polyfibres like Doum fibres, which have many applications. They still lack fibre matrix compatibility. The evaluations on the thermal and mechanical properties of LDPE composite materials reinforced with alkaline-treated Doum fibre was done. The treatment promoted adhesion between fibre and polymer. The fibres were compounded into various loadings and extruded as continuous strands of low-density polyethylene. Significant improvements were found in mechanical properties: Young’s modulus increased by 145% at 30 wt. % fibre loading, 135% flexural modulus at 20 wt. % and 97% torsional modulus at 0.1 Hz. However, thermal properties tend to decrease slightly with the increase of fibre content. 34 Kenaf an industrial crop being found in Malaysia and the whole world is fast becoming a very interesting plant for applications in the automobile and construction materials. It has long fibres from the bast, which can effectively reinforce polymer matrices and enhance the mechanical properties of polymers. Kenaf/epoxy composites are found to have better overall mechanical properties than other polymeric matrices. Kenaf fibre has potential in flexural and tensile applications as a substitute for synthetic fibres like glass. Although kenaf fibre is higher in impact strength, it is considered as very suitable for hybrid natural fibre composites for structural and non-structural elements in industries including construction, housing and transport. 35 The effects of parameters as fibre loading, fibre length, fibre architecture and chemical treatments, as well as hybridization with natural or synthetic fibres, fillers or additives, on the mechanical properties of polymer composites have been reviewed along with some important mechanical properties of sisal fibre. The investigation also discusses the influence of mechanical properties of composites related to water absorption and chemical concentration, time of exposure, filler weight percentage and fibre loading in hybrid configurations. 36 An attempt has been made to find out the effects of incorporating 10% Styrene – Rubber with (SBR) various grainsizes on dynamic properties of polymer concrete. It is observed that with the addition of 0.6–2 mm SBR, there was a reduction in the amplitude of the transfer function by 76% and the damping ratio was increased by 431.5% larger grain size of 2.5–6 mm took a higher relaxation time and gave more transfer function amplitude with lesser damping. The results indicate that SBR can enhance the dynamic properties of polymer concrete, with optimal performance at certain grain sizes. 37 The review on various biopolymer composites has been centred at recent advances in mechanical properties. Firstly, the strange mechanical characterization techniques such as fatigue test, nanoindentation and non-destructive testing of biopolymer composites have been reviewed. Secondly, various popular processing techniques for fabrication of bio composites were dealt with. Moreover, in conclusion, some of the challenges related to processing and mechanical performance of biopolymer composites have been mentioned. 38 The properties of sugar palm fibre (SPF)-reinforced polyester (PET) epoxy composites containing magnesium hydroxide (Mg(OH)2) as a flame retardant were investigated. The composite with 35% SPF revealed the lowest burning rate and highest tensile strength at 9.69 MPa. Increasing the content of SPF to 50% the tensile strength because of weak bonding between the fibres and the matrix. The SEM analysis shows uniform distribution of analysis shows uniform distribution of fibres but weak adhesion that affects both flammability and strength. These composites could be useful for automotive, building and aerospace applications. 39 The effects of various loadings of different fillers, compatibilizers (maleic anhydride and dibutyl maleate) and different processing methods on LDPE/TPS (Thermoplastic Sago Starch) Composites. Various results were exposed. Compatibility significantly improved melt flow, mechanical properties and dispersion of starch in the matrix, especially the LDPE/TPS composite. Thermal stability, phase morphology, biodegradability and reduced water absorption were also achieved, showing improvements in the performance of the modified composites. 40 Synthetic fibres offer advantages such as high strength-to-weight ratio, durability and low moisture absorption, but they have some drawbacks. To address these, hybrid composites combining synthetic and natural fibres have been developed, offering the benefits of both types. These hybrid composites are suitable for aerospace, marine and industrial structural applications. The composites were made using fibres like Abaca, Hemp, Kevlar and Glass, with three different configurations. Experimental results for the Glass/Hemp composite were compared with simulation results, showing good agreement. 41 The application of natural fibre hybrid composite materials in dealing with waste management and restrictions of synthetic fibres was studied and their dynamic mechanical properties, loss modulus, storage modulus, damping factor, glass transition temperature, etc., were discussed. The communication entails various types of hybrid composites, which include thermostable, thermoplastic, biopolymer, nanocomposite and bio nanocomposite. It is concluded that most applications of lignocellulosic fibre are for reinforcement, and such hybrid composites generally perform better than any of those fibres alone as a result of synergistic actions from more than one reinforcing fibre. 42 The effect of thermal treatments on 3D printed Polylactic Acid (PLA) specimens with different print orientations (−45/45 and 0/90) and layer thicknesses (0.1 and 0.2 mm) was studied. Specimens were treated with NaCl powder or Calcium Sulphate (gypsum) at different temperatures. Heat treatment improved structural properties, with the gypsum-treated specimens showing the greatest increase in tensile strength (up to 71.66 MPa) and micro-hardness (185 MPa). It shows an increase in PLA mechanical performance coupled with lessened anisotropy present in 3D printing in thermal processing. 43 A novel hybrid natural fibre reinforced composite produced from banana fibres treated with NaOH, simultaneously mixed with sugarcane bagasse powder was used with an epoxy matrix. Composites with three distinct reinforced ratios: 10%, 15% and 20%, were evaluated for tensile, compressive, flexural, impact and hardness strength, based on the standards of ASTM. Results showed that chemically treated fibres had greater strength; the maximum tensile strength was 73.48 MPa and other strengths were also improved, but treated specimens had higher water absorption. Such composites can be used in industries such as automobile, aerospace, construction, sports and household goods. 44 Another study examines the effect of Bast-Supported Acrylic Polymer (BSAP) on the physical and mechanical properties of pure aluminium. The addition of 0%–10% BSAP increased the hardness and compressive strength of the material; the best result was obtained with 7.5% BSAP, 239.66 HV hardness and 308.32 MPa compressive strength. These composites of natural fibres have prospects for enhancing materials in many engineering applications. 45
The polynomial regression model is one of the key statistical methods employed across various fields, to examine the relationship between multiple variables is regression analysis (RA) that are causally related for making predictions about the output. The target of RA is to obtain an expression to predict the target dependent variable on the input independent variable which is filler content here, using the available data. 46 Recent research has extensively explored the use of machine learning to anticipate key characteristics of Engineered Cementitious Composites (ECCs), such as Tensile Strength (TS), Compressive Strength (CS) and Tensile Strain (TSt). Perfect predictions of these properties help minimizing the material waste, speed up project timelines and to reduce construction costs. Methods including Artificial Neural Networks (ANNs) and RA have been succeeded to forecast material performance.47–52 Ostertagová 53 developed a RS to identify relationships between two or more variables. Polynomial regression, a type of multiple linear regression, uses least-squares analysis to generate an ‘ideal’ curve out of the data points. The model predicts parameters by keeping the sum of squared errors minimum. To estimate these parameters accurately, it assumes that errors are uncorrelated, have constant variance and a mean of zero.
Multiple regression analysis (MRA) is a sort of RA that examines the relationships between a single dependent variable and two or more independent variables. When making predictions, Chopra et al. 54 concluded that MRA is straightforward and fast, but its accuracy falls when more independent variables are included. Polynomial Regression Analysis (PRA) and MRA both the traditional statistical methods, were utilized to analyse factors affecting the TS of glass and basalt Fibre-Reinforced Polymers (FRPs) exposed to alkaline environments and predict the TS MR downfall. A comparison between PRA and MRA was provided by Kim and Oh. 55 Both the PRA and MRA are strategies for predicting functions that make use of statistical methods; nevertheless, both have limitations in terms of the scalability of the model due to the fact that they are dependent on experimental data. One of the most common applications of the polynomial regression method is in predicting the tensile strength reduction of materials prone to different environments. The polynomial regression method was also utilized to estimate the strength of Distributed Denial of Service (DDoS) attacks by analysing the deviation from the normal network profile. The polynomial regression method was utilized by Gupta et al. 56 to estimate the strength of a DDoS. Accurately identifying the incidence of DDoS assaults in the first place is one of the biggest obstacles to effective defence against them. When traffic deviates from the normal profile by more than a certain amount, anomaly-based DDoS detection systems generate a profile of the traffic, typically observed in the network and detect abnormalities. Normally, this range of deviation is not used. They used polynomial regression-based approach that makes use of this extent of divergence from the detection threshold to evaluate the power of a DDoS attack.57,58 Despite its limitations of providing unmatched results at lower volume fractions, modifications have been proposed in this paper to enhance the outcomes of the polynomial regression method, making it more valuable tool for various applications. Shukla 59 found that the polynomial regression model performed significantly better on data sets compared to Stevens’ asymptotic regression model. Additionally, a linear model showing the relationship between the coefficient of variation and plot size demonstrated strong results and is highly recommended for use in uniformity trial experiments.
Sumpter and Noid 60 used statistical regression techniques and computational neural networks for efficiently predicting the top most results for thermal properties of eleven different polymers but the mechanical properties did not go well. They used PLS: Linear partial least squares regression (LPSR), FNN: Feedforward neural networks trained with backpropagation, RR: Ridge Regression (linear technique), LWR: Locally Weighted Regression (a nonlinear regression technique) PPLS: Polynomial Partial Least Squares Regression, KR: Kernel Regression techniques to find results with minimum average error. The dispersion quality factor that is, width for a number of composites was determined by Mills et al. 61 with the investigation of factors like; filler type, concentration of filler, vinyl acetate content and fillers coated with isosteric acid. The authors constructed two multiple regression models in order to inspect the dependence of elongation at break and tensile strength on dispersion quality. A positive interdependence was observed between predicted regression model data and the measured data as both interpret that the elongation at break and tensile strength reduces as dispersion quality is decreased. Al-Haik et al. 62 developed an ANN to predict stress relaxation in carbon-fibre reinforced epoxy composites. Trained on 9000 experimental data points, the model used a scaled conjugate gradient method and an optimal brain surgeon algorithm to optimize its structure. The final ANN configuration accurately predicted stress relaxation across various stress and temperature conditions for 88 elements under process. Roy et al. 63 tackled the challenge of predicting and optimizing properties of polymer especially for high molecular weight polymers like engineering plastics which was itself a complex and nonlinear problem. Experimentally investigating the effects of modifying monomers is difficult due to the numerous potential variations. To address this, they used neural networks, leveraging a polymer properties database. They explored different types of networks, extending from backpropagation to unsupervised self-associating maps, selecting those that best predicted specific polymer properties. Their approach demonstrated how these networks could predict and optimize polymer properties without error. Neural networks have been applied to model the mechanical behaviour of fibre-reinforced composites, showing promising results. However, further research is needed to refine their structure and assess performance with limited or noisy data. In contrast, polynomial networks, known for their effectiveness as classifiers and universal approximators, offer advantages over neural networks due to their lower computational demands and independence from user-defined parameters. Al-Assaf and El Kadi 64 examined unidirectional glass fibre/epoxy composite to predict the fatigue behaviour of laminae under different loading conditions using both feedforward and recurrent neural networks, as well as polynomial classifiers. The research utilized experimental data across different fibre orientation angles and stress ratios. Despite using a small dataset for training, the predictions from both methods were comparable to existing fatigue life-prediction techniques. However, Polynomial classifiers were identified as effective in modelling the relationship between input parameters and fatigue life more accurately than neural networks. Plant-based fibres, like hemp, are used as reinforcements in composites for their strong mechanical properties and environmental benefits. A simulation method was developed Behzad and Sain 65 to predict the temperature profile and curing behaviour of hemp fibre/thermoset composites during the modelling process. Using a Multiphysics finite element package, the simulation modelled both one-dimensional and three-dimensional scenarios. The results were validated with experiments, showing that the simulation provided accurate and stable predictions, including for complex three-dimensional automotive parts. Fazilat et al. employed ANNs and Adaptive Neuro-Fuzzy Inference System (ANFIS) to predict the mechanical properties of glass fibre-reinforced polymers. 66 The study focused on a composite material made of short glass fibres, maleated ethylene-propylene rubber (EPR-g-MA) and toughened polyamide 6 (PA6). A variety of mechanical properties, such as impact strength, yield strength and modulus, were forecasted under different processing conditions. The predictions closely matched experimental data, showing minimal errors, a low Root Mean Squared Error (RMSE) values and a high R2 values, indicating strong model performance. The duplex coatings on the promptness of steels were quantified through ANFIS. The process levels duplex with nitrocarburizing and followed by deposition of chromium through thermo-reactive treatments (TRT) at the temperatures of 550°C, 625°C and 700°C with each treatment taking 1–30 h time periods resulting in coatings of chromium carbonitride reaching up to a thickness of 9.5 μm. ANFIS models are constructed using data from experiments on 84 specimens, based on input parameters like chemical composition, nitride time, ferro-chromium particles size, bath temperature and time of coating. The results show that the ANFIS model can forecast efficiently the thickness of the duplex coating. 67 A prediction model for ferrite fraction during continuous cooling in micro alloyed steels had been accomplished by using artificial neural network. Several variables are there to act as input parameters including cooling rate, initial size of austenite grain and chemical composition. It has been worked out with a training of multi-layer feed forward back propagation network using experimental data, wherein the capability of prediction model was confirmed with good matching between predicted ferrite fraction and measured values. 68 Fuzzy logic was utilized to estimate the total specific pore volume of geopolymers produced from fly ash and rice husk bark ash. The model was created using experimental data from 120 specimens and took into account characteristics such as ash mixture composition, curing temperature and curing duration. The results indicated a high potential for properly forecasting pore volume. 68 A fuzzy logic model was used to forecast the thickness of chromium carbonitride coating on 1.2210 steel, taking into account variables such as nitriding time and salt bath conditions. The model, founded on 105 experimental data points, accurately predicts coating thickness. 69 Fracture toughness of electroslag remelted functionally graded steel fusions was developed using Vickers microhardness and FRAT. Moreover, it was observed that the experimental results were consistent with the predicted findings of the model developed. 70 Moghri et al. 71 developed a methodology for optimizing the tensile strength and tensile modulus of injection-moulded PA-6/clay nanocomposites. This method integrates the response surface approach with a genetic algorithm. Tensile tests were conducted, and analysis of variance was used to create predictive models for the material properties. These models were then optimized using a genetic algorithm in MATLAB. The results showed strong consent between the predicted process parameters and experimental data, demonstrating the effectiveness of this method in optimizing the tensile properties of PA-6/clay nanocomposites. Bhoopal et al. 72 used ANNs to anticipate the mechanical properties of Cu powder-loaded LDPE composites based on filler concentration. A three-layer feedforward ANN with a backpropagation algorithm was employed, utilizing various training functions like Levenberg-Marquardt and resilient backpropagation. The model predicted properties such as stress at break, elongation at break and Young’s modulus. The ANN predictions showed outstanding agreement with experimental results and compared with other favourably models, demonstrating the method’s accuracy in forecasting the mechanical behaviour of these composites. Moving towards hybrid polymers. Faramarz Ashenai Ghasemi conducted a study to forecast the impact strength and young’s modulus of nanocomposites made from titanium dioxide (TiO2), LLDPE and PP. Using Box–Behnken response surface methodology, significant factors from TiO2 nanoparticles, LLDPE and SEBS (a compatibilizer) were identified. Differential Scanning Calorimetry (DSC) was utilized to analyse the thermal behaviour of the nanocomposites. The study found that LLDPE had the bulk significant impact on impact strength and Young’s modulus, followed by TiO2 and SEBS. The optimal composition for maximum properties was determined to be 60 wt. % LLDPE, 2.6 wt. % TiO2 and 2.3 wt. % SEBS. 73 Mohamed et al. 74 research focused on adjusting injection moulding parameters in order to improve the mechanical properties of HDPE filled with 10% flax fibre. The study examined the impact of injection temperature (170°C, 195°C and 220°C), injection speed (8, 50 and 125 mm/s) and screw speed (75, 185 and 250 rpm) on ultimate tensile strength (UTS) and toughness. The results revealed that these parameters, along with their interactions, significantly affected both UTS and toughness. Non-linear optimization techniques were used to enhance these properties. Wang et al. 75 investigated BF reinforced PP composites using needle punching and compression moulding. The study assessed how different BF mass fractions affected mechanical properties, thermal conductivity and gas permeability. Results showed that growing BF content drops breaking strength but increased gas permeability and thermal conductivity, with optimal thermal conductivity achieved at 70% BF. Tensile and flexural strength initially increased and then decreased with more BF. RA demonstrated a linear correlation between shear strength and thermal conductivity, indicating that the prediction model could be useful for producing composites in the automotive industry and also the non-woven fabrics. Savran et al. 76 explored the use of artichoke stem particles and wollastonite as fillers to upgrade the mechanical properties of PP composites. Both non-hybrid and hybrid composites were created using a high-speed thermo-kinetic mixer. Tensile tests showed that raw PP had the highest tensile strength, PP with wollastonite (PP-W) had the highest elastic modulus while PP with both fillers (PP-W-AS) had the lowest ultimate strain. Multiple-nonlinear regression analysis was used to assess the impact of filler ratios on mechanical properties, with polynomial, rational and trigonometric models providing a great fit to experimental data, achieving R2 values between 0.95 and 1. The models were also checked for realism through boundedness control. Singh et al. 77 used ANN to predict the mechanical properties of loose multi-phase material systems, particularly Cu powder-filled LLDPE. The ANN, inspired by biological neural networks, utilized Feed Forward Back Propagation (FFBP) with three training functions (TRAINGDA, TRAINGDM and TRAINGDX). The prediction, based on input parameters such as elongation, stress, Young’s modulus, filler volume fraction and various constants, ran for 200 epochs using a Tangent Sigmoid Function (TANSIG)-PURELIN threshold function. Due to the complex structure of the material, accurately predicting its mechanical properties is challenging, but the ANN approach was employed for this purpose. Tang et al. 78 focused to mature an ANN method to predict the elastic modulus of Continuous SiC fibre-reinforced SiC ceramic matrix (SiC/SiC) mini-composites. A micromechanical model based on composites’ microstructure and incorporating pores was used alongside Finite Element Analysis (FEA) to identify key factors influencing tensile elastic modulus. The ANN, specifically a backpropagation (BP) neural network, was then designed to model the relationship between the structural parameters and elastic modulus. FEA confirmed the neural network’s accuracy, with a prediction error of less than 0.7% using just one hidden layer and 2300 data samples. This ANN model effectively supports the evaluation of SiC/SiC mini-composites during design, reducing design and manufacturing time. Hossain et al. 79 focused on the mixture design and strength of ECCs with polyethylene fibre, using data from existing literature. ANN models were constructed in MATLAB, using a dataset of 339 experimental results utilizing 12 input variables, to predict Compressive strength, tensile stress and tensile stiffness. The models achieved high accuracy, validated by various metrics. This study emphasizes the potential of enhancing predictive models to support green (low-carbon) development in civil engineering, promoting more efficient and sustainable construction practices while reducing the industry’s carbon footprint.
Significant research has been conducted over the past decade on predicting the mechanical, electrical and thermal properties of various mono and hybrid polymers with different fillers using simulation methods, including some that have been addressed in this study. However, there is a notable gap in research specifically focused on predicting the mechanical behaviour of LDPE/metal composites using a Nonlinear Polynomial Regression approach. More specifically, the objective of this study is to address this gap by predicting the mechanical properties of LDPE/Cu composites using regression method. A polynomial regression model was thus developed to relate strains to drilling depth, incorporating volume fraction and mechanical properties of both phases. Performance was evaluated using statistical measures (SSE, MSE, RMSE, R2, adjusted R2), and model coefficients were calculated via least squares. The modified models successfully predicted mechanical properties (elongation at break, stress at break and Young’s modulus) of LDPE composites with Cu powder, matching experimental data from Luyt et al.2 and the different existing theoretical models.
Historical experimental context
LDPE, the matrix material is procured from Sasol Polymers, South Africa. The properties of LDPE were MFI-7.0 g/10 min, 106°C melting point, 96,000 g/mol molecular weight and 0.918 g/cm3 density. Copper powder of less than 38 µm particle size, density of 8.96 g/cm3 and melting point of 1083°C was obtained from Merck Chemicals. The composites were formed by mixing the polymer with copper powder using a Brabender Plastograph at 160°C for a duration of 10 min. The volume of copper varied from 0% to 18% for mechanical properties. The weight loss was determined by thermogravimetric analysis (TGA) from 25°C to 600°C. Tensile tests were performed using a Hounsfield H5KS tensile tester.2
Mathematical modelling
RA is a statistical method approach that attempts to determine the strength and character of the relationship between a dependent variable and one or more independent variables. This model is hypothesized, and parameter estimates are utilized to create an estimated regression equation. Several trials are then run to see if the model is adequate. Model acceptance is a critical step in the modelling process that assesses the dependability of models before they are used in decision making. In RA, the primary goal is often not to understand the precise relationship between variables since this can be complex but rather to determine the extent of the association that the dependent variable and the independent variables provide.
When only one independent variable, typically the most significant one, is used to examine its effect on a dependent variable, it is quoted as simple regression. This can be either linear or nonlinear. In this context of mechanical properties of composites, we will focus solely on the simple regression model, as we will use only one independent variable volume fraction, which is the most influential factor. Typically, the relationship observed is nonlinear. Multiple Regression technique involves analysing the effect of two or more independent variables on a dependent variable using RA.
Linear regression
The algorithm in simple linear regression only works when the link between the data is linear that is,
Therefore, linear regression cannot generate an optimal best-fit line for non-linear data. To address this limitation, polynomial regression is introduced, which captures the non-linear relationship between the explanatory versus response variables.
Polynomial regression
Non-linear polynomial regression is a RA technique that models non-linear relationships by incorporating polynomial terms (such as squared or cubed terms) of the independent variables.
The polynomial regression model of kth order is:

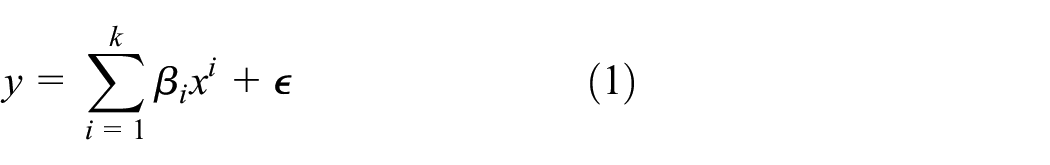
Here,
The analysis involved testing five key formulas to evaluate model performance. These included the sum of square errors (SSE), mean square error (MSE), RMSE for assessing the accuracy of the predictions. Additionally, the coefficient of determination (R2) and the adjusted R-squared (
Sum square of errors (SSE)
It is a statistical measure used to evaluate the accuracy of a model by calculating the total squared difference between observed and predicted values.

Here
Mean square error (MSE)
MSE represents the average of the squared errors, calculated by dividing the total squared errors by the degrees of freedom (


Here,
Root mean square error (RMSE)
RMSE is the square root of the Mean Squared Error (MSE), but it does not serve as an unbiased estimator of the standard deviation of the random error term.

A low RMSE indicates close alignment of the model’s predictions and actual values and signifies a strong fit. In contrast, a high RMSE reflects considerable deviation from the actual data, suggesting a weaker fit.
Coefficient of determination/R-squared (R2)
The R2 of multiple regressions is alike simple regression. It quantifies the percentage change in the dependent variable Y in response to a change in the independent variable X. So, it is an important measure of how well data is fitted threw RA.
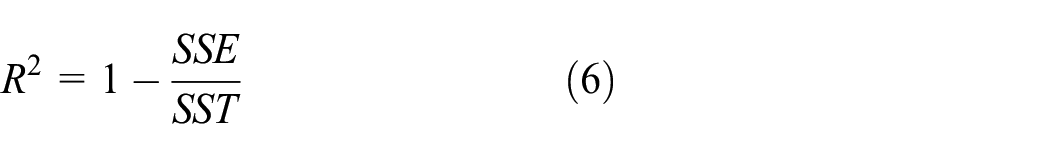

Here, SST – sum of squares total,
Adjusted R-squared (
)

Here, we have already calculated R2, n is number of observations, m is order of polynomial equation. The
Assessment of existing and modified theoretical models
In the past two decades, a wide range of theoretical models have been developed to estimate the mechanical properties, such as elongation at break, stress at break and Young’s modulus, for both two-phase and multiphase composites. Here, we have applied this technique to predict better relationship between mechanical properties of composite material and volume fraction of filler particle (Cu powder).
Elongation at break
We considered two mathematical models for calculating elongation at break of the powder filled polymer composites with equations (9) and (10),


Here


Where
Tensile stress at break
Two most commonly used mathematical relations for tensile stress at break for two-phase composites which are based on the first power law and two-third power law,


Here,


These mathematical model equations described the non-adhesive type structure. Here, the parameter


Young’s modulus
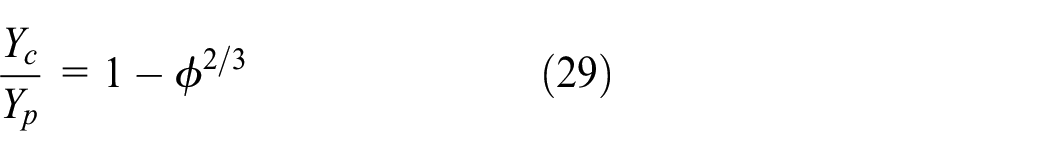
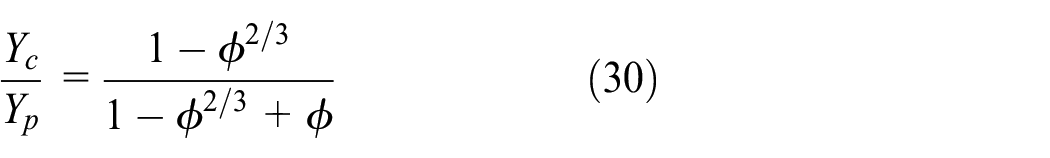
Various empirical and theoretical models have been introduced to predict the Young’s modulus of polymer composites with embedded fillers. Assessment of many of these models are given by Einstein; equation (25), Guth; equation (26), Thomas; equation (27), Quemada; equation (28) and others; equations (29) and (30). For low amounts of non-interactive spherical loaded polymer composites, the Einstein’s model is applicable when there is perfect adhesion between the phases. This model manifests the importance of the volume occupied by the filler, not the weight in addition it also and also presumes more rigidness of filler as compared to the matrix. This model concludes the filler size independence on the reinforcing action.80,84,85

Due to rigid spherical filler, there is an increase in modulus and for such case the modified form of the Einstein’s model is valid.80,85,86 These models also sound good for the interactions between particles at higher filler concentrations.

An empirical relation in regard to data generated by a system for mono-disperse spherical particles is represented by the Thomas’s model. 80

The Quemada’s model uses a variable coefficient associated with the geometric characteristic’s (

The Young’s modulus for two-phase systems is predicted by employing these models and are controlled by the volume fraction of filler particles. Equation (30) is the modified form of the equation (29).
In equations (25)–(30),
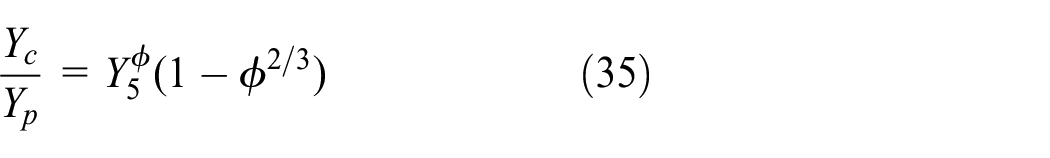
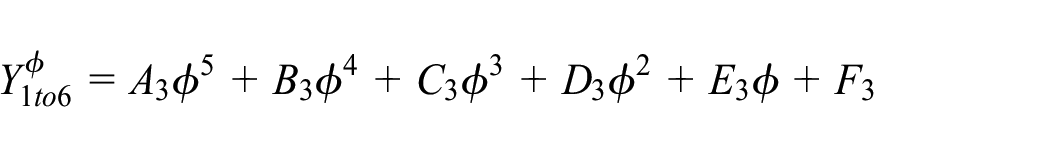
The above stated models provided satisfactory results at initial filler content but on growing the Filler content, these did not provide satisfactory results. Therefore, in order to predict the mechanical properties of composite materials accurately, some adjustments are must require in the existing theoretical models using regression technique. These adjustments may involve modifying the altering the fractional volume of the components which results in accurate prediction of Young’s modulus of the constituent phases. After doing much statistical experiments we got the right modified equations for calculating the Young’s Modulus for two phase system which are as follows;


Results and discussions
Polynomial regression models are essentially a specialized configuration of multiple linear regression which provide a best curve fitting using flexible and effective approach. The most experimental data conducted on LDPE reinforced with Cu particles was collected.2 Ordinary least squares method is the modified widely used method for RA, which calculate estimated parameters to minimize the sum of squared errors to draw the ‘ideal fit’ line through all available data points. When fitting a regression model, certain pre-assumptions are necessary. A primary assumption is that the errors are independent random variables with a zero mean and constant variance, which is essential for reliable parameter estimation. For hypothesis testing and interval estimation, normally distribution of errors is also assumed. Several advanced statistical tests are introduced to determine if these assumptions are valid for a particular regression equation. On applying polynomial regression mathematical modelling with the theoretical framework, the optimal results for all three mechanical properties stress at break, elongation at break and Young’s modulus of the LDPE filled with Cu powder are reflected in the graphs.
Elongation at break
By analysing the results of this study, the modified equations (11) and (12) were employed for predicting elongation at break of Cu powder loaded LDPE composites. The modification is adjusted by using a correction factor
Value of constant parameters for modified Elongation at break models.

The elongation at break was calculating Using
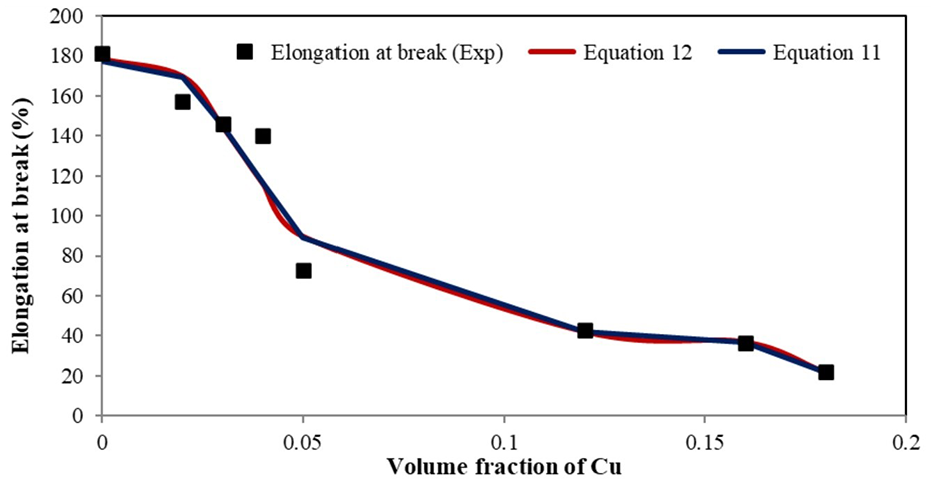
Comparison of experimental values of elongation at break for LDPE/Cu composites with modified equations.
Tensile stress at break
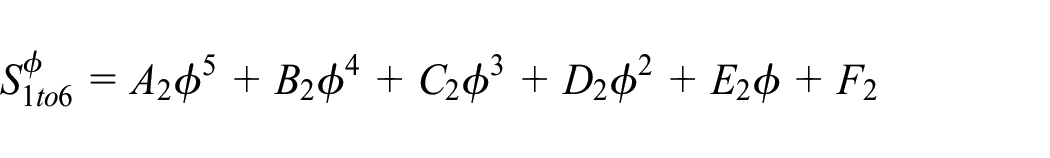
The results of commonly used Six models (equations (13)–(18)) for calculating Tensile strength did not provide good agreement when compared to Experimental data for Cu filled LDPE composites even at a single content. So, some modifications are must require which are done in terms of correction factors
Value of constant parameters for modified stress at break models.

Considering all the above-mentioned corrections and coefficients given in Table 2, we predicted the tensile stress at break, with a variation in the filler content from 0 vol. % to 18 vol. %. The observed tensile stress at break for the modified models initially decreases with the increase in filler content from 0 vol. % to 3 vol. %. At 4 vol. % of Cu content, a slight increase is observed, but then it continues to decrease slightly. The untreated LDPE possess maximum tensile stress at break using equations (19)–(24) with only very slight difference in values and is very close to untreated experimental value as compared to the treated values at all the fibre contents considered. The least value of elongation at break is observed at 3 vol. % for all the mentioned modified equations, which is in coordination with the experimental data. Finally at the highest concentration 18 vol. %, we observed very close values of elongation at break, but we got the highest value using equation (23). Thus, all the six developed statistical modified equations provide very close and best results at all the filler contents in coordination with the existing experimental data. Alternatively, the equation (19) provides the most precise results. The graphical depiction of the modified models in comparison to experimental values and the traditional models are shown with help of Figure 2. Thus, the comparison demonstrates that the model predictions align closely with the test results.

Comparison of experimental values of stress at break for LDPE/Cu composites with modified equations.
Young’s modulus
Many empirical and theoretical models (equations (25)–(30)) have been exposed to predict the Young’s modulus of polymer composites with dispersed fillers. The Models were in close correlation with experimental data at the initial concentration, but at higher filler contents these models failed to match with the experimental data, so statistically modified equations are used to calculate the Young’s modulus. The modification is done in terms of correction factors
Value of constant parameters for modified Young’s modulus models.

Various statistical performance results.

Considering all the above-mentioned corrections and coefficients given in Tables 3 and 4, the Young’s Modulus was predicted with the filler content ranging from 0 vol. % to 18 vol. %. The observed Young’s Modulus with the modified models increase as the filler content increases. The untreated LDPE possess minimum Young’s Modulus value using equations (31)–(36), which is very close to untreated experimental value, as compared to the treated values for all the fibre contents considered. There exists a direct relation between the external filler and the polymer. Upon keen observation, we found that the behaviour of Young’s modulus remains approximately linear up to 5 vol. % in both the experimental data2 and our modified models, indicating good tie up between them. The highest values of Young’s Modulus observed at 18 vol. % fraction using all the equations (equations (31)–(36)) is very much identical to the highest experimental value at this content. Figure 3 provides a graphical comparison of the modified models against the experimental values and the basic models. It is clear that all six of the developed statistical modified equations consistently produce results that are highly accurate and closely match the existing experimental data across all filler contents. However, to be more precise, equations (32), (33) and (35) yield the most accurate results. The comparison demonstrates that the model predictions closely match the test results.
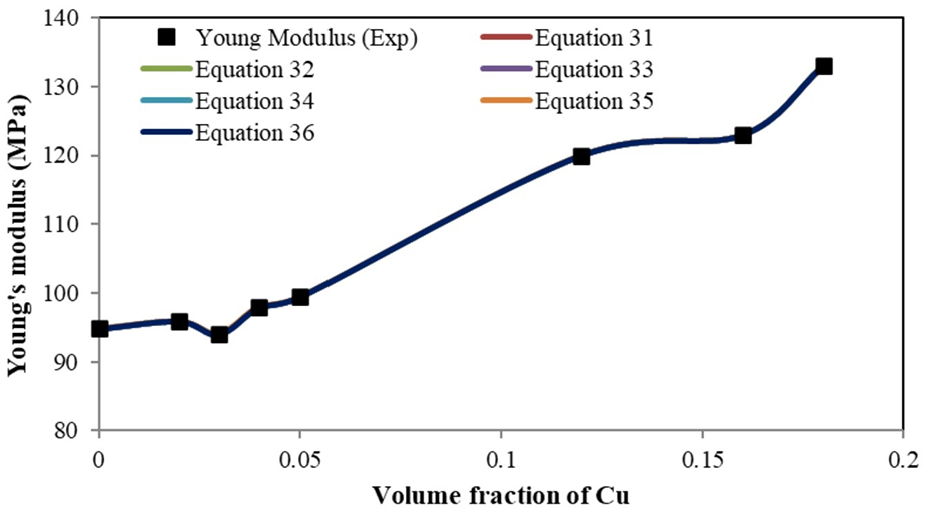
Comparison of experimental values of Young’s modulus for LDPE/Cu composites with modified equations.
Conclusion
This study used polynomial regression modelling and theoretical models to predict the mechanical properties (elongation at break, tensile stress at break and Young’s modulus) of Cu-filled LDPE composites. The modified models, incorporating correction factors, effectively predicted nonlinear trends and showed strong agreement with experimental data, especially at higher filler contents. The main achievements are:
Elongation at Break: Modified equations (11) and (12), using correction terms, provided accurate predictions for filler contents from 0% to 18%. The second model, being less complex, yielded the most precise results, particularly at higher filler concentrations.
Tensile Stress at Break: Traditional models (equations (13)–(18)) failed to match experimental data. Modified fifth-order polynomial equations (19)–(24), incorporating correction factors, provided accurate predictions for tensile stress across the 0–18 vol. % range, with equation (19) offering the closest agreement with experiments.
Young’s Modulus: Empirical and theoretical models (equations (25)–(30)) initially worked but failed at higher filler contents. Modified fifth-order polynomial equations (31)–(36) showed excellent correlation with experimental data, especially at higher filler concentrations. Equations (32), (33) and (35) provided the best results.
Overall, the polynomial regression approach demonstrated strong predictive capabilities for composite systems, offering reliable tools for future research and engineering applications.
Footnotes
Appendix
Handling Editor: Chenhui Liang
Declaration of conflicting interests
The author(s) declared no potential conflicts of interest with respect to the research, authorship, and/or publication of this article.
Funding
The author(s) received no financial support for the research, authorship, and/or publication of this article.