
Abstract
In order to realize fast and accurate prediction of the stall limit of compressor, a study on predicting the stall limit of compressor at low rotating speed is conducted with throughflow calculation and maximum static pressure rise coefficient. The calculated stall limit of 30%–60% design speed for four axial compressors is compared with the experimental results. The results show that the blade loading increases significantly from the shroud to the hub at the near stall condition of the compressors with low inlet hub-tip ratio. If the maximum static pressure rise coefficient calculated with the spanwise averaged parameters from the throughflow analysis is used to determine the stall limit. The stall limit predicted by the throughflow calculation has a large deviation with the experimental result. The maximum deviation of near stall total pressure ratio and near stall mass flow reach 15% and 30% respectively. In this paper the spanwise variation of the static pressure rise coefficient is taken into account to define the stall limit prediction method. At a particular spanwise position, the maximum effective static pressure rise coefficient is calculated with the parameters at the blade section determined by the throughflow streamline. Taking the maximum static pressure rise coefficient at the low spanwise position with high blade loading as the stall criterion, the stall limit of the compressors can be predicted well with throughflow calculation compared to the experimental results. The maximum deviation of near stall total pressure ratio and near stall mass flow is respectively lower than 2% and 3%.
Keywords
Introduction
In order to avoid surge in starting up process of gas turbines, compressors need to have enough stable operating range at low rotating speed. Therefore, it is necessary to improve the reliability and accuracy of the stall limit prediction method at low rotating speed.
With the development of Computational Fluid Dynamics (CFD) and high performance computing technology, CFD is widely used in three-dimensional flow simulation and aerodynamic optimization of compressor. However, as there are strong vortex and flow separation in the compressors at the near stall condition,1–4 it is difficult to simulate the complex flow and predict the stall limit accurately using CFD especially at low-speed conditions. Moreover, CFD calculation of the stall limit of multistage axial compressor needs large computing resources and long computing time. In order to predict the stall limit of compressor quickly and accurately, the researchers have put forward some prediction methods of stall limit based on theoretical stability model. These methods include reducing the dimensionality of flow, 5 simplifying the real flow to inviscid flow,6–8 simplifying the compressor to actuator disk,9–11 or modeling the blade action with body force.12–16 Based on these simplified models, the instability boundary can be obtained by analyzing the response of compressor to small perturbation. The researchers have also put forward some empirical correlations for predicting the stall limit by theoretical analysis and experimental investigation. Leiblein and Roudenbush 17 proposed that diffusion factor could be used as the stall criterion of compressor blade. Anugier and Farokhi 18 considered equivalent relative velocity ratio as the stall criterion. Equivalent relative velocity ratio was related to blade camber, stagger angle, solidity, etc. By analyzing the experimental results of numerous low speed and high speed compressors, Koch 19 concluded that the correlation of stalling static pressure coefficient versus normalized diffusion length is consistent with that of two-dimensional diffuser. The effect of stagger angle and flow coefficient on the stalling static pressure coefficient was considered in the correlation. The effect of Reynolds number, blade tip clearance, and blade row axial spacing on the stalling static pressure coefficient was also analyzed in the correlation. Koch used the pitchline parameters from one-dimensional performance calculation to determine the stalling pressure rise. Jin 20 and Huang 21 used the empirical correlation of stalling static pressure coefficient in conjunction with throughflow calculation to predict the stall limit of compressor, and also the pitchline parameters were used to calculate the stalling static pressure coefficient.
Throughflow calculation plays an important role in the design process of compressor. The performance of multi-operating conditions and numerous flow parameters can be obtained from throughflow calculation quickly. Combined with empirical stall criteria, throughflow calculation can predict the stall limit of compressor in a short time. This paper presents an investigation on predicting the stall limit of compressor at low rotating speed with throughflow calculation. The correlation of maximum static pressure rise coefficient proposed by Koch was adopted as the stall criterion. The blade loading along the spanwise direction was analyzed, and the stall limit prediction method based on identifying the first stall section was developed to predict the stall limit. The developed prediction method results were compared with experimental data and CFD results.
Calculation method
Stall prediction method based on maximum static pressure rise coefficient
The maximum static pressure rise coefficient proposed by Koch 19 was adopted as the stall criterion in this paper. The blade passage of compressor was considered to be analogous to two-dimensional diffuser. The effect of multiple factors on the maximum pressure rise coefficient of compressor was taken into account. These factors included the length-width ratio of cascade passage, vector triangles, Reynolds number, blade tip clearance, blade row axial spacing, etc.
The correlation of maximum static pressure rise coefficient versus normalized diffusion length is shown in Figure 1. The normalized diffusion length refers to the ratio of diffusion length to exit passage width. The black data markers in this figure represent the test data of various compressor configurations. The blue curve represents the correlation of maximum static pressure rise coefficient for two-dimensional diffuser at 9% blockage. Based on this blue curve, the stage maximum static pressure rise coefficient at specific ratio of diffusion length to exit passage width can be obtained. In addition, the effect of Reynolds number, blade tip clearance, and blade row axial spacing on the maximum static pressure rise coefficient need to be considered, and the maximum static pressure rise coefficient is corrected. By comparing the actual stage static pressure rise coefficient to the maximum possible pressure rise coefficient, whether the stall limit of the compressor is reached can be identified.

Correlation of maximum pressure rise coefficient versus normalized diffusion length. 19
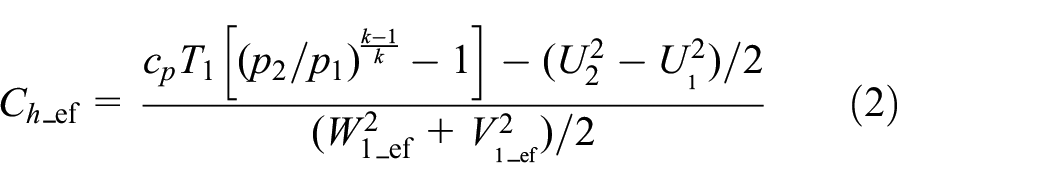
For compressors, the normalized diffusion length refers to the ratio of diffusion length to exit width of cascade passage. The normalized diffusion length is determined using equation (1), among which L represents the length of meanline, t represents the trailing edge pitch, and β2 represents the outlet metal angle. The stage maximum effective static pressure rise coefficient Ch_ef is determined using equation (2), among which cp represents specific heat at constant pressure, k represents specific heat ratio, T1 represents stage inlet static temperature. And p1 and p2 represent stage inlet and outlet pressure respectively, U1 and U2 represent rotor inlet and outlet tangential speed respectively, W1_ef and V1_ef represent rotor effective dynamic head and stator effective dynamic head respectively. W1_ef and V1_ef are determined using equations (3) and (4), among which Wmin and Vmin represent the minimum possible inlet flow velocity of rotor and stator respectively, and W1 and V1 represent the inlet flow velocity of rotor and stator respectively.


Throughflow calculation method
The streamline curvature numerical approach is used for the throughflow calculation. Meanwhile, the deviation model, loss model, and radial mixing model were included. The deviation model takes into account the minimum loss deviation and the effect of various actual flow phenomena on the deviation. The effecting factors due to actual flow included the actual incidence, the meridional velocity ratio, the three-dimensional flow phenomena, and the inlet Mach number. The loss model takes into account the minimum profile loss, the profile loss due to actual incidence, the shock loss, and the loss due to three-dimensional flow phenomena.
Inlet total pressure, inlet total temperature, inlet flow direction, and massflow are given as the boundary conditions for throughflow calculation. The stall point is approached by gradually decreasing the massflow.
CFD numerical method
The NUMECA FINE/Turbo solver is used for the steady numerical simulation. The governing equations solved are the Reynolds averaged Navier-Stokes equations. The Spalart-Allmaras model is used for the turbulence model, because it has the advantages of fast calculation speed, good convergence, and high prediction accuracy as shown in section “Validation of the calculation method” below. The cell centered control volume method is used for the space discretization. The inviscid fluxes are calculated with central scheme and Jameson type dissipation. The viscous fluxes are determined in a central way. The four-stage Runge-Kutta scheme is used for the time discretization. A single passage for per blade row is simulated with matching periodic boundary. As shown in Figure 2, the blade passage is meshed in O4H topology and the blade tip clearance is meshed in butterfly topology. The grid density is increased toward the solid walls to keep y+<3.

Grid of blade passage and tip clearance.
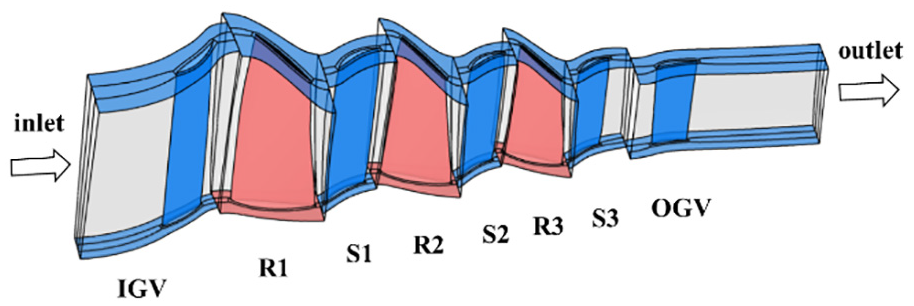
Figure 3 shows the computational domain of a three-stage axial compressor researched in this paper. The pink surfaces represent the rotating solid walls and the blue surfaces represent the stationary solid walls. The adiabatic and no-slip boundary conditions are applied at the solid wall boundaries. Total temperature, total pressure, and flow direction are given as the inlet boundary conditions. Static pressure at specific radius is given at the outlet, and the radial equilibrium equation is used to get the out static pressure distribution. The stall point is approached by gradually increasing the back pressure. The last converged solution before stall is considered as the near stall point.
Computational domain of a three-stage axial compressor.
Validation of the calculation method
The calculated and experimental results of a seven-stage axial compressor near stall at 60% design speed are shown below to validate the throughflow and CFD method. The normalized static pressure distributions long the casing wall surface obtained by throughflow calculation, CFD, and experiment are compared in Figure 4. The normalized static pressure refers to the ratio of static pressure to inlet total pressure. It can be seen that both the throughflow and CFD calculated static pressure distributions long the casing wall surface have a good agreement with the experimental result.

Static pressure long the casing wall surface near stall at 60% design speed.
The spanwise distributions of total pressure and total temperature obtained by throughflow calculation, CFD, and experiment are shown in Figures 5 and 6. The spanwise distributions of total pressure and total temperature are extracted from the inlet of the stator of stage 3 to stage 6 (S3–S6) and the outlet of outlet guide vane (OGV). Compared to the experimental data at the same spanwise location, the maximum relative deviation of total pressure was 2.7% for throughflow calculation and 1.4% for CFD, and the maximum relative deviation of total temperature was 1.5% for throughflow calculation and 1.6% for CFD. The deviation between the calculated results and the experimental results is small.

Spanwise distribution of total pressure near stall at 60% design speed.
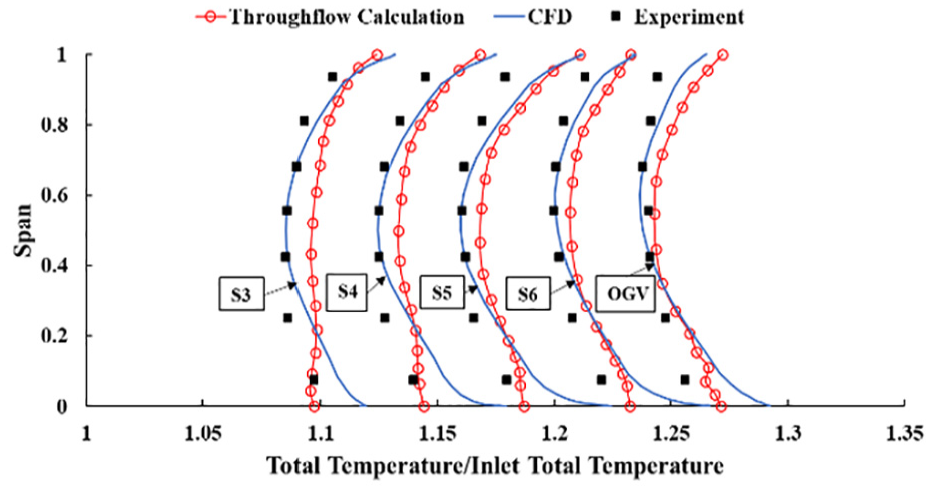
Spanwise distribution of total temperature near stall at 60% design speed.
Investigated compressors and experimental configuration
Four axial compressors are investigated in this paper, which are referred as compressor 1 to compressor 4. Compressor 1 is a three-stage transonic axial compressor, which includes inlet guide vane (IGV), rotor and stator for per stage and outlet guide vane (OGV). The inlet hub-tip ratio of compressor 1 is 0.50 and the averaged stage loading coefficient at design point is 0.31. Compressor 2 is a seven-stage axial compressor, which includes IGV, rotor and stator for per stage and OGV. The first three stages of compressor 2 is a transonic compressor, and the last four stages of compressor 2 is subsonic compressor. The inlet hub-tip ratio of compressor 2 is 0.50 and the averaged stage loading coefficient at design point is 0.31. Air bleed is conducted at the casing between stage 5 and stage 6. Compressor 3 is an eight-stage subsonic axial compressor, which includes IGV, rotor and stator for per stage and OGV. The inlet hub-tip ratio of compressor 3 is 0.82 and the averaged stage loading coefficient at design point is 0.28. Air bleed is conducted at the casing between stage 2 and stage 3, and between stage 6 and the stage 7. Compressor 4 is a three-stage transonic axial compressor, which includes IGV, rotor and stator for per stage and OGV. The inlet hub-tip ratio of compressor 4 is 0.50 and the averaged stage loading coefficient at design point is 0.36. The definition of loading coefficients is the ratio of specific work to square of speed at the pitchline.
The experimental tests have been conducted for the four compressors (compressor 1 to compressor 4) by the authors. The driving system is composed of the motor, the speed-increasing gearbox, and the torque converter. The inlet mass flow of compressor is measured by a flow tube. At the inlet and outlet of the compressor, the total pressure and total temperature values are measured by the probes with multiple measure points in the radial direction. Along the casing, the static pressure values are measured by the wall probes near the leading edge and the trailing edge of the stators. Besides, there are airfoil sensors at the leading edge of several stators to measure the radial distributions of total pressure and total temperature.
Analysis of the results
Stall prediction based on spanwise averaged pressure rise coefficient
In Koch, 19 the pitchline parameters from one-dimensional performance calculation were used to determine the static pressure rise coefficient. In this paper, the performance of compressor is obtained by throughflow calculation. Referring to Koch, 19 the spanwise averaged parameters are used to determine the static pressure rise coefficient firstly. The effectiveness of this approach on predicting the stall limit of compressor is analyzed. The maximum stage static pressure rise coefficients based on the throughflow spanwise averaged parameters at the near stall mass flow of experiment are shown in Figure 7. The maximum stage static pressure rise coefficient refers to the maximum value among the static pressure rise coefficients of all the stages. There are four markers in each figure, which represent the maximum stage static pressure rise coefficients of 30%, 40%, 50%, and 60% design speed respectively. The test data of various compressor configurations and the correlation curve of maximum static pressure rise coefficient for two-dimensional diffuser in Koch 19 are also shown. For compressor 1, compressor 2, and compressor 4, the maximum stage static pressure rise coefficients from throughflow calculation at the near stall mass flow of experiment are significantly lower than the correlation curve of two-dimensional diffuser. If the correlation of maximum static pressure rise coefficient for two-dimensional diffuser is considered as the stall criterion, the near stall pressure ratio from throughflow calculation will be significantly higher than the experimental result, and the predicted near stall mass flow will be significantly lower. The maximum deviation of near stall total pressure ratio will be 15%, and the maximum deviation of near stall mass flow will be 30%. As can be seen from Figure 7, for the compressor represented by black data marker with diffusion length: exit passage width equal to 2.07, the maximum static pressure rise is also significantly lower than the two-dimensional diffuser correlation curve. In Koch, 19 the reason was considered to be that the pitchline approach could not work well for the compressor with low hub-tip ratio and radial unbalanced loading. For compressor 3, the maximum stage pressure rise coefficients from throughflow calculation at the near stall mass flow of experiment are relatively close to the correlation curve of two-dimensional diffuser. If the correlation of maximum pressure rise coefficient for two-dimensional diffuser is considered as the stall criterion, the maximum deviation of near stall total pressure ratio will be 8%, and the maximum deviation of near stall mass flow will be 20%.
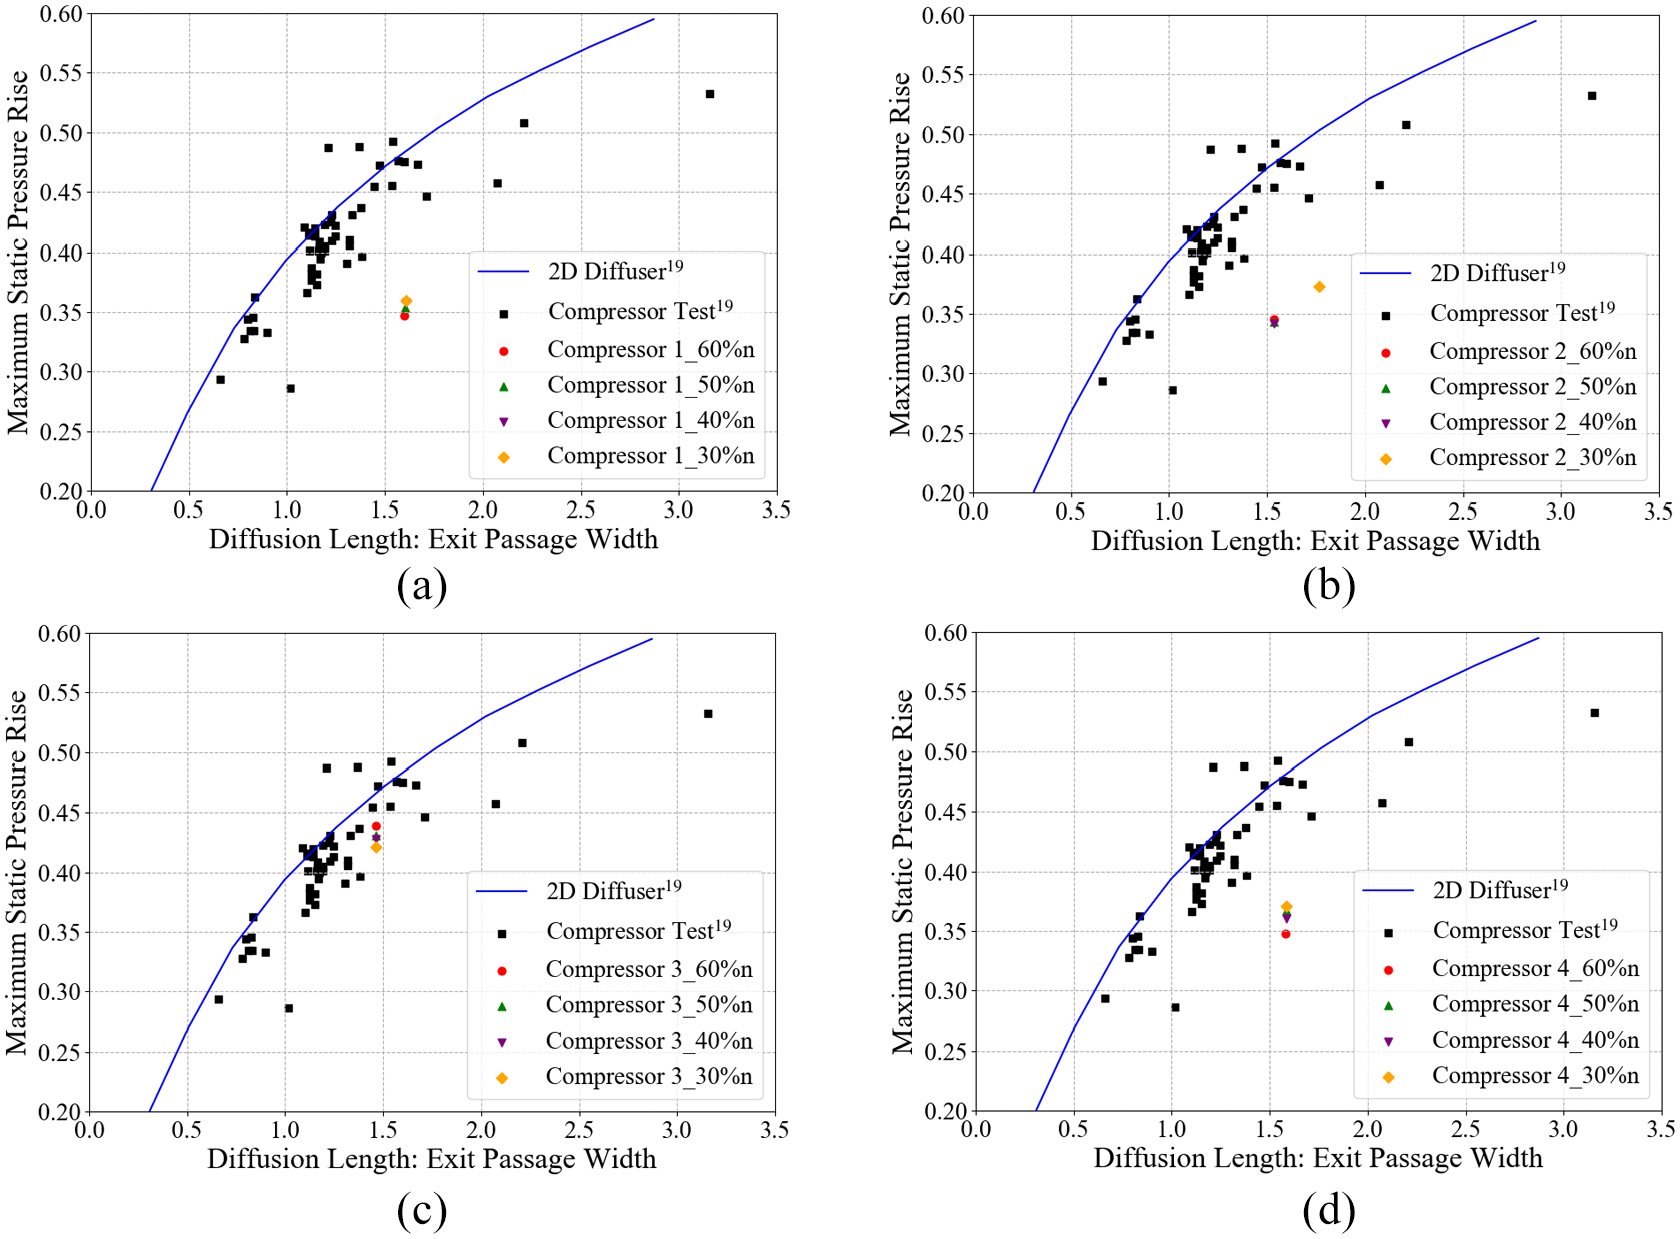
Maximum stage pressure rise coefficients at the near stall mass flow of experiment: (a) compressor 1, (b) compressor 2, (c) compressor 3, and (d) compressor 4.
Analysis of loading distribution and flow field
The correlation curve of two-dimensional diffuser in Figure 7 is considered to limit the maximum possible static pressure rise of per compressor stage at specific diffusion length: passage exit width. The ratio of stage static pressure rise coefficient to the maximum possible value on the correlation curve of two-dimensional diffuser is defined as stall factor in this paper. The stall factor of per compressor stage at the near stall mass flow of experiment and at 60% design speed is shown in Figure 8. The value of stage stall factor is calculated with the parameters from throughflow calculation. At the near stall mass flow of experiment for compressor 1–4, the spanwise averaged stall factor is less than 1.0 for all the stages, but the stall factor at low spanwise position is larger than the spanwise averaged value. For compressor 1 to compressor 3, the stall factor at low spanwise position of stage 3 has reached 1.0. For compressor 4, the stall factor at low spanwise position of stage 2 has reached 1.0. This means the stage static pressure rise has reached the maximum value at the low spanwise position, although the spanwise averaged value is lower. It can also be seen that the stage stall factor at low spanwise position is significantly larger than the spanwise averaged value for compressor 1, compressor 2, and compressor 4. But the stage stall factor at low spanwise position is close to the spanwise averaged value for compressor 3.
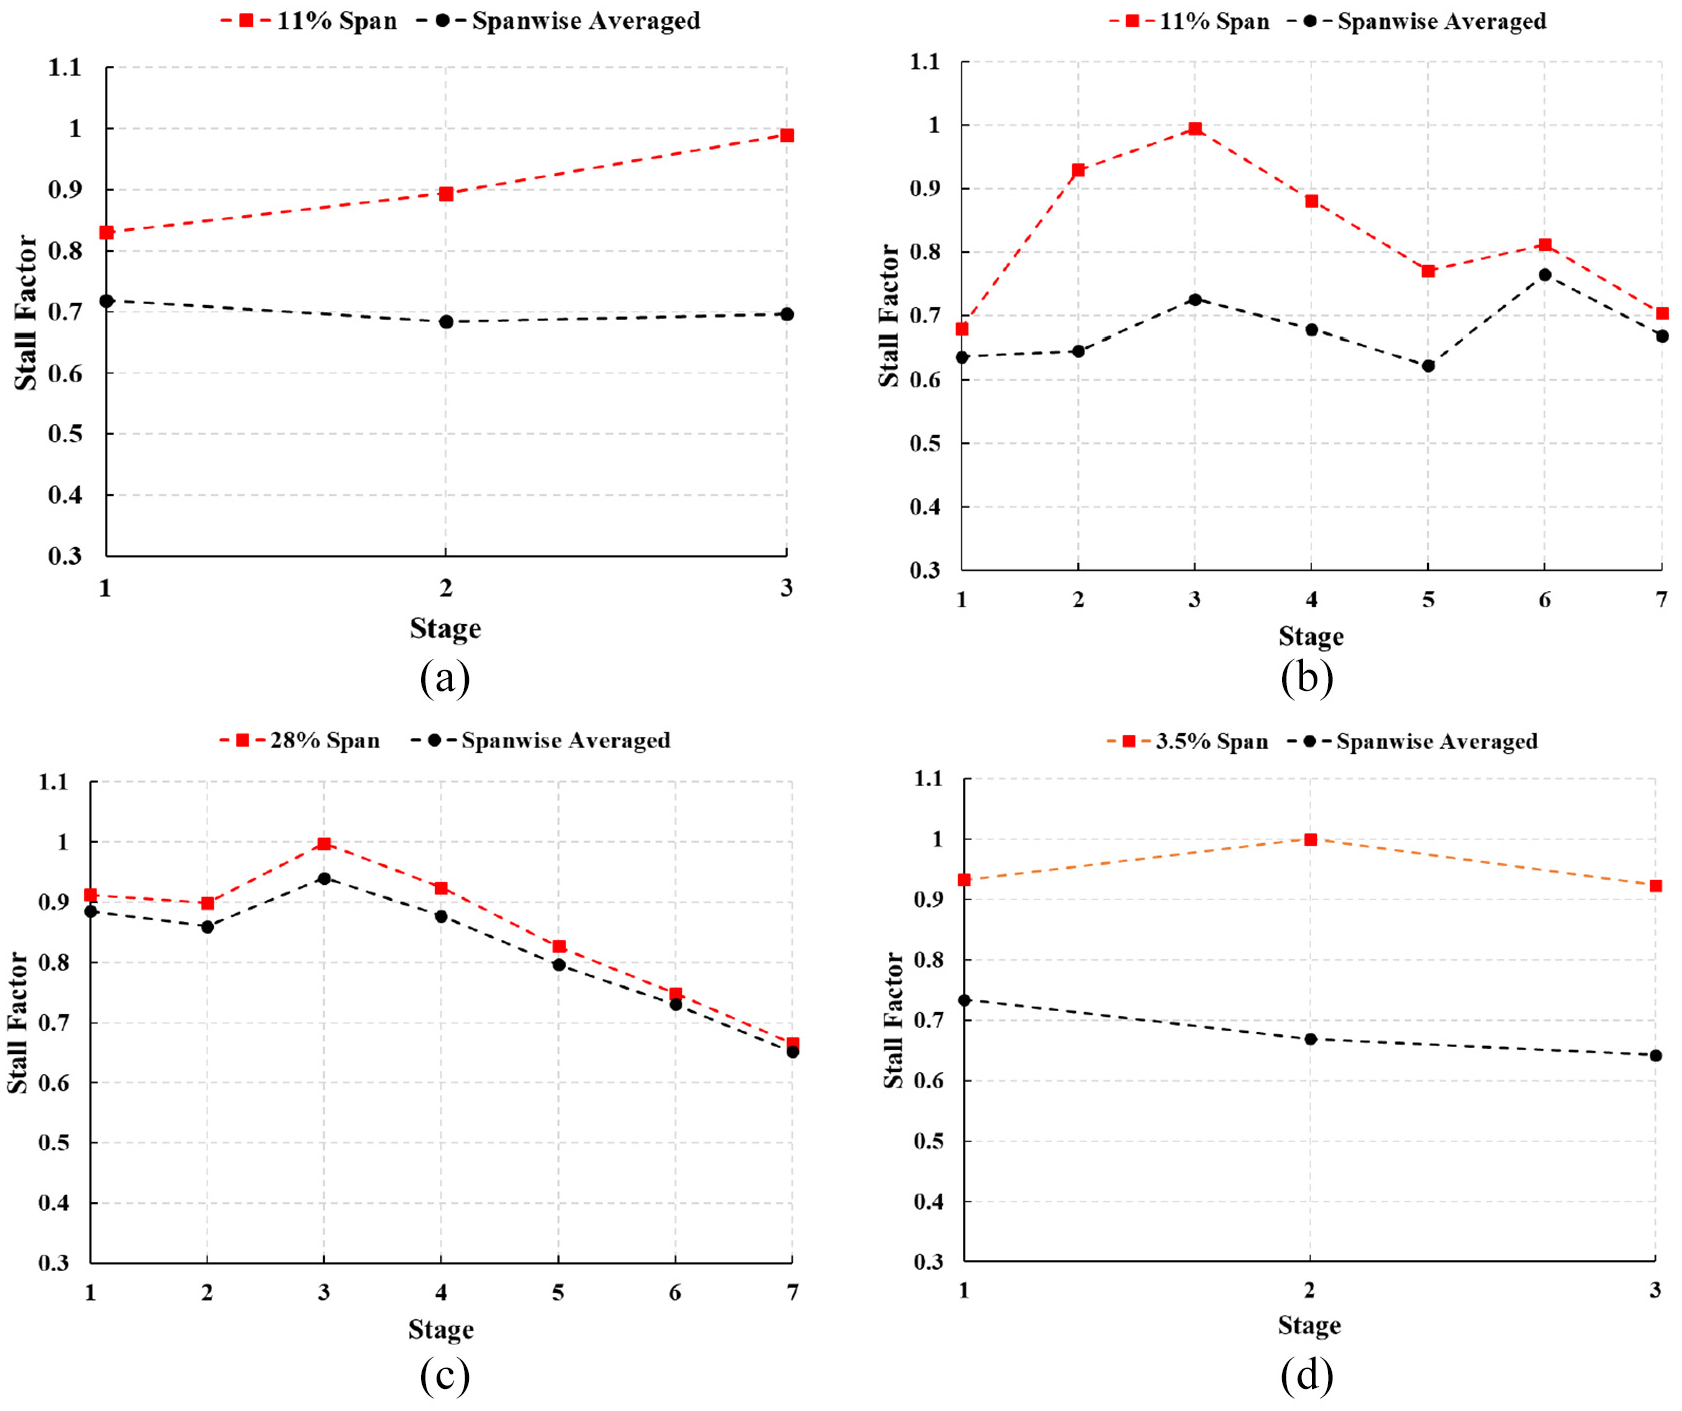
Stage stall factor at the near stall mass flow of experiment and 60% design speed: (a) compressor 1, (b) compressor 2, (c) compressor 3, and (d) compressor 4.
The spanwise distributions of stage stall factor from throughflow calculation at the near stall mass flow of experiment are shown in Figure 9. At a particular spanwise position, the normalized diffusion length, maximum effective static pressure rise coefficient, and the effective dynamic head are calculated with the parameters at the blade section determined by the throughflow streamline. The inlet and outlet parameters are extracted from the intersection points of the throughflow streamline and the leading edge line or the trailing edge line. The specific correlations are indicated in equations (2)–(4). The stage that has the largest stall factor at the low spanwise position as shown in Figure 8 is selected. As can be seen from Figure 9, for compressor 1, compressor 2, and compressor 4, the stall factor has a great change along the spanwise direction. The stall factor at the low spanwise position is significantly higher than that at the high spanwise position. The spanwise averaged stall factor is about 0.7, but the stall factor at the low spanwise position has reached or even exceed 1.0. It indicates that although the spanwise averaged static pressure rise coefficient is much lower than the limit value, the static pressure rise coefficient has reached the limit value at the low spanwise position and the stall limit is reached. Thus, at the near stall mass flow of experiment, the maximum static pressure rise coefficients calculated with the spanwise averaged parameters are significantly lower than the value at the stall limit determined by the correlation curve of two-dimensional diffuser, as shown in Figure 7(a) to (c). For compressor 3, the spanwise distribution of stall factor is more uniform, and thus the spanwise averaged stall factor is more closer to the stall factor at low spanwise position. At the near stall mass flow of experiment, the stall factor at the low spanwise position has reached or even exceed 1.0, while the spanwise averaged stall factor is 0.94. Thus, the maximum static pressure rise coefficient calculated with the spanwise averaged parameters is closer to the value at the stall limit determined by the correlation curve of two-dimensional diffuser, as shown in Figure 7(d).

Spanwise distributions of stall factor at the near stall mass flow of experiment and at 60% design speed: (a) stage 3 of compressor 1, (b) stage 3 of compressor 2, (c) stage 3 of compressor 3, and (d) stage 2 of compressor 4.
The spanwise distributions of diffusion factor of rotor and stator from throughflow calculation at the near stall mass flow of experiment are shown in Figure 10. The rotor and stator belong to the stage that has the largest stall factor at the low spanwise position as shown in Figure 8. Similar to the spanwise distributions of stall factor in Figure 9, the diffusion factor has a great change along the spanwise direction for compressor 1, compressor 2, and compressor 4. While the diffusion factor has a smaller change along the spanwise direction for compressor 3. The diffusion factor at the low spanwise position is high for all the compressors with the value exceeding 0.6. It indicates the loading at the low spanwise position is high, which is consistent with the high stall factor at the low spanwise position as shown in Figure 9. The circumferential speed is low and the flow turning is high at the low spanwise position. These factors leads to the high loading and high static pressure rise coefficient at the low spanwise position. Besides, the high loading at the low spanwise position causes large losses, which reduces the dynamic head and also contributes to improve the static pressure rise coefficient. The inlet hub-tip ratio of compressor 1, compressor 2, and compressor 4 is 0.50, while the inlet hub-tip ratio of compressor 3 is 0.82. Compared to compressor 3, the hub-tip ratio of the front stages for compressor 1, compressor 2, and compressor 4 is lower, and thus the circumferential speed has a larger change in the spanwise position, which contributes to the larger change of blade loading in the spanwise direction.
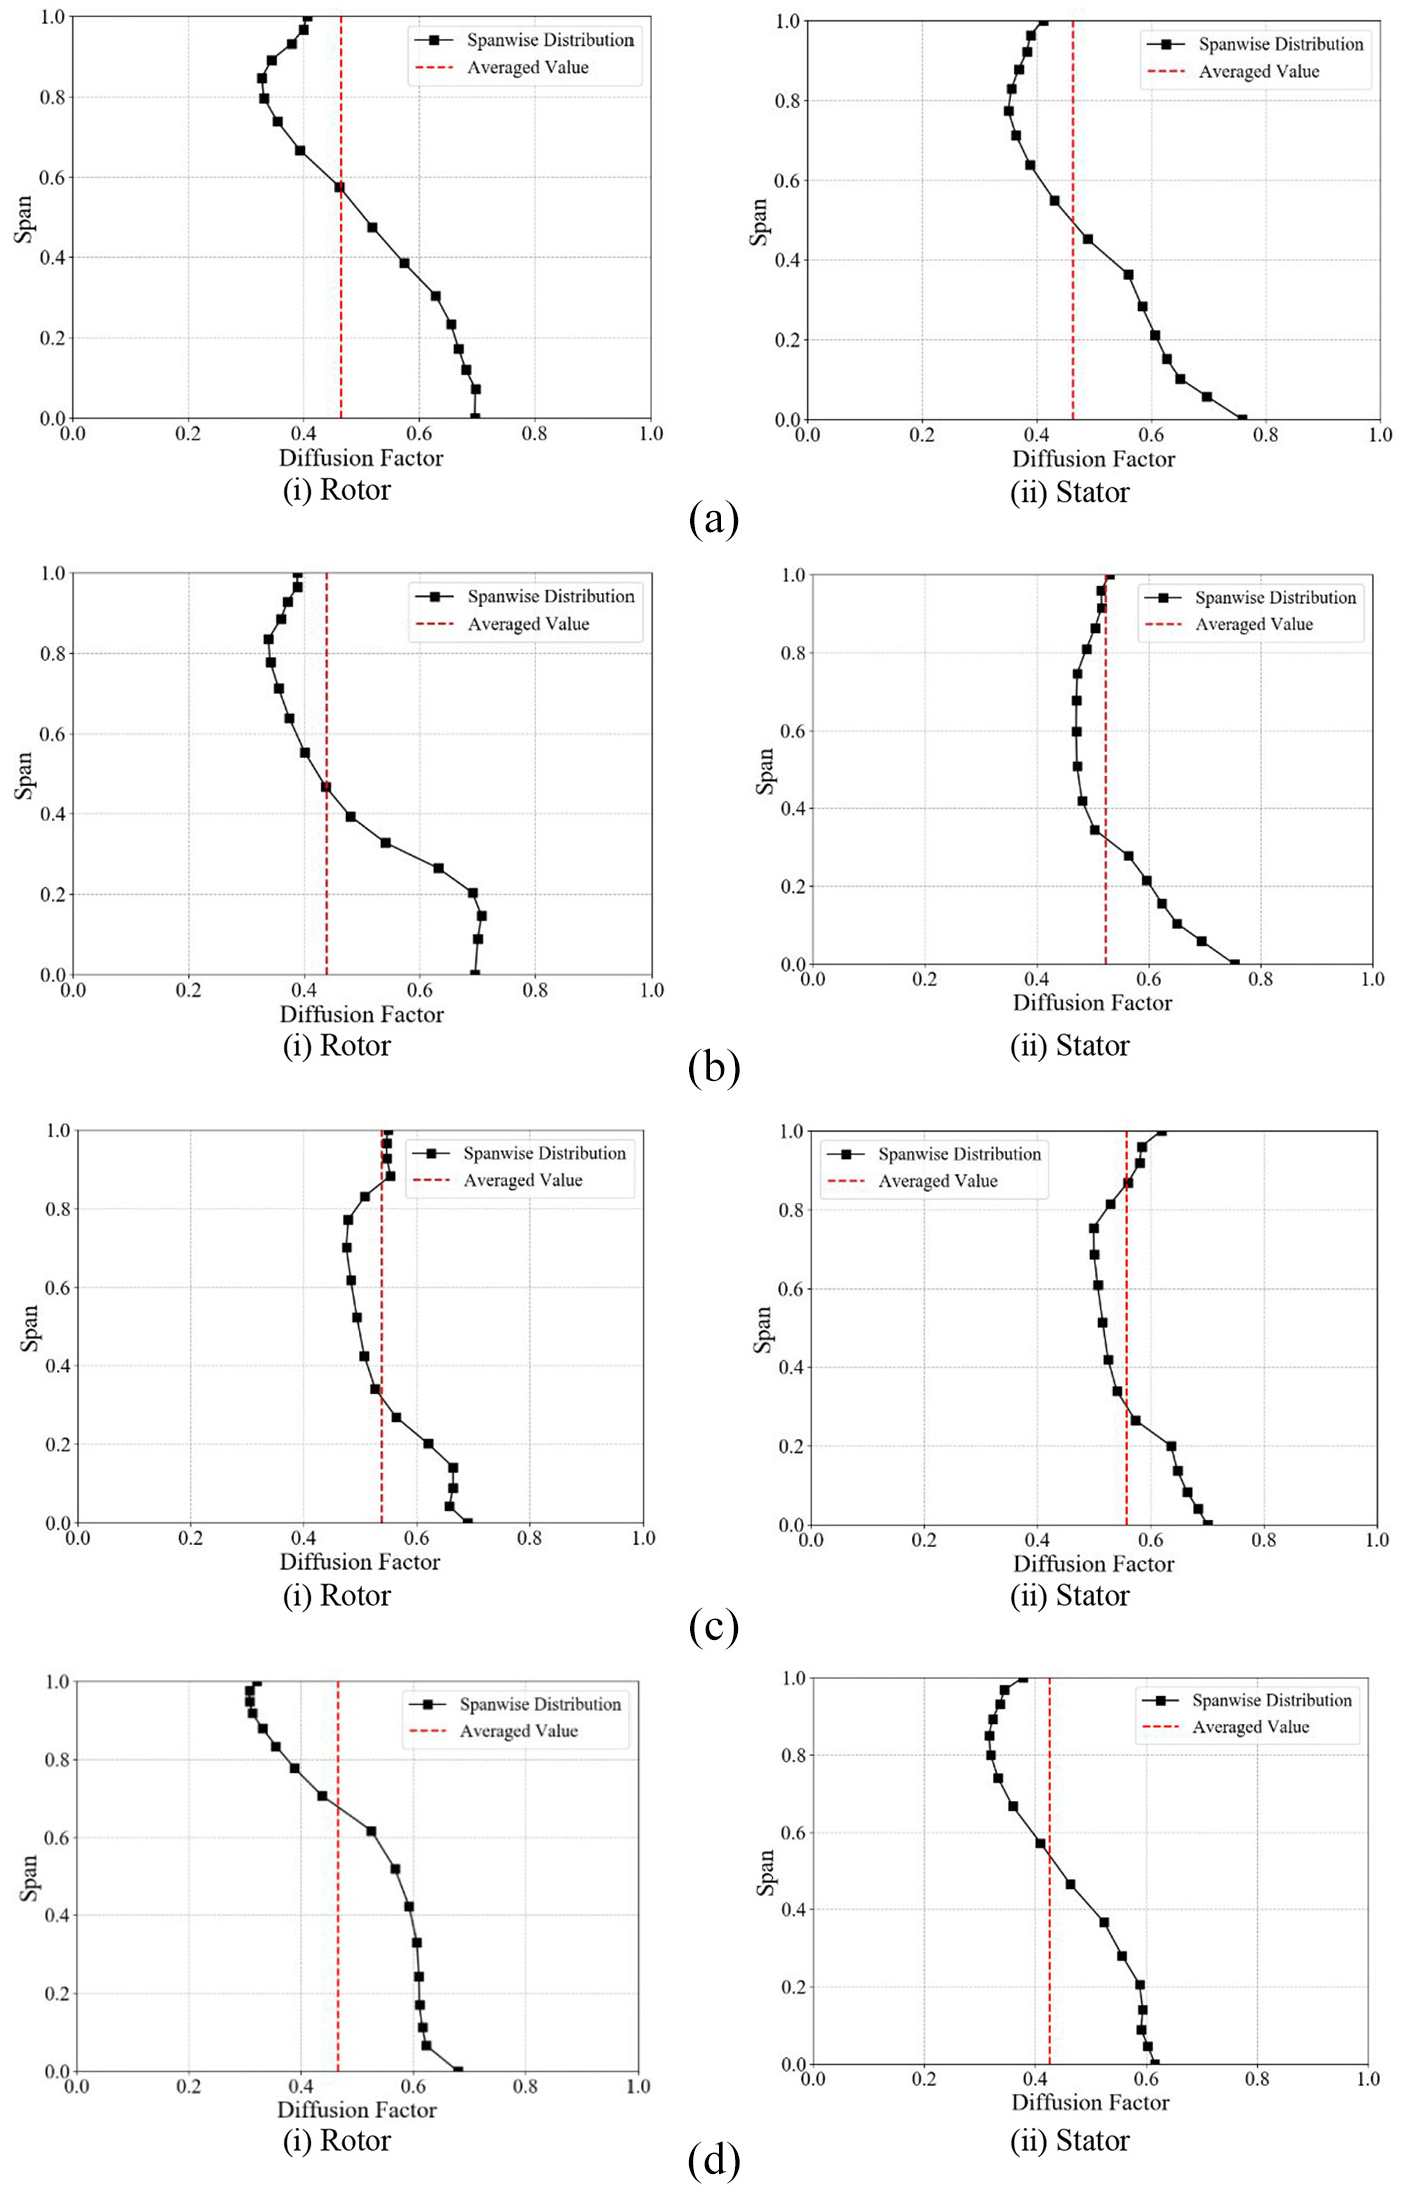
Spanwise distributions of diffusion factor at the near stall mass flow of experiment and at 60% design speed: (a) stage 3 of compressor 1, (b) stage 3 of compressor 2, (c) stage 3 of compressor 3, and (d) stage 2 of compressor 4.
As above, two kinds of compressor are investigated in this paper. Compressor 1, compressor 2, and compressor 4 all have low inlet hub-tip ratio of 0.5, and the spanwise distributions of blade loading are similar for the first stall stage, which increase significantly from the shroud to the hub. In contrast, compressor 3 has high inlet hub-tip ratio of 0.82, and the blade loading is relatively uniform along the spanwise direction. From these two kinds of compressor, compressor 2 and compressor 3 are selected respectively and the CFD calculated results are compared. The low speed regions of negative axial velocity at the near stall condition of 60% design speed from CFD simulation are shown in Figure 11. In addition, the relative Mach number contours at 10%, 50%, and 90% span are shown in Figure 12. These show the flow separation regions that are responsible for the stall of the compressors. As can be seen, there is large area of flow separation at the low spanwise position of stage 2 and stage 3 for compressor 2, while there is large area of flow separation at the low spanwise position of rotor 3 and at the high spanwise position of stator 3 for compressor 3. The reverse flow regions are caused by the boundary layer separation on the blade suction surfaces and the endwall surfaces. For both compressor 2 and compressor 3, the boundary layer separation at the low spanwise position is related to the high loading. The stage that has large area of separation at the low spanwise position is consistent with that has high stall factor in Figure 8. For compressor 3, because the loading is more uniform along the spanwise direction and the loading near the casing is high, the boundary layer separation also occurs at the high spanwise position of stator 3. Figure 13 shows the static pressure contours at different spanwise positions. It can be seen that the static pressure rise at different spanwise positions of each blade row has little difference. The difference of static pressure rise coefficient along spanwise direction (as indicated in Figure 9) is mainly due to the dynamic head.

Flow separation regions at the near stall condition of 60% design speed: (a) compressor 2 and (b) compressor 3.

Relative Mach number contours at the near stall condition of 60% design speed: (a) compressor 2 and (b) compressor 3.

Static pressure contours at the near stall condition of 60% design speed: (a) compressor 2 and (b) compressor 3.
Stall prediction based on pressure rise coefficient at the first stall section
As can be seen from the above analysis, for the compressors with low inlet hub-tip ratio, because the blade loading has a great change along the spanwise direction, the stall limit predicted by the spanwise averaged maximum static pressure rise coefficient from throughflow calculation has a large deviation with the experimental result. Whereas for the compressors with high inlet hub-tip ratio, because the blade loading has a smaller change along the spanwise direction, the stall limit predicted by the spanwise averaged maximum pressure rise coefficient from throughflow calculation has smaller deviation with the experimental result. In Koch, 19 the maximum static pressure rise coefficient and one-dimensional calculation were combined to predict the stall boundary, which can determine the first stall stage, but can not consider the spanwise variation of blade loading. In this paper, stall limit prediction with maximum static pressure rise coefficient and throughflow calculation is investigated, and thus the appropriate spanwise position that can be called as “first stall section” should be selected to predict the stall limit. The first stall section should be at the spanwise position with high static pressure rise coefficient and blade loading.
As shown in Figures 8 and 9, based on the distributions of stall factor from throughflow calculation at the near stall mass flow of experiment, the spanwise position at which the maximum stage stall factor exactly reaches 1.0 can be identified. This spanwise position is namely the first stall section. For 30%–60% design speed, the analysis shows that the first stall sections of compressor 1–4 are all at the low spanwise positions. For compressor 1 and 2, the first stall sections are at 7%–11% span. For compressor 3, the first stall sections are at 21%–28% span. For compressor 4, the first stall sections are at 2%–4% span. Based on these results, the 10%, 10%, 25%, and 3% spanwise position is respectively selected as the first stall section of compressor 1–4 at low rotating speeds. If the stage static pressure rise coefficient at the first stall section reaches the maximum value on the correlation curve of two-dimensional diffuser, the stall limit of the compressor is considered to be reached.
Figure 14 compares the stall limit of 30%–60% design speed obtained by throughflow calculation, CFD calculation, and experiment. For throughflow calculation, the stall limit is predicted based on the stage static pressure rise coefficient at the first stall section. For compressor 1–4, the maximum deviation between the near stall mass flow from throughflow calculation and that from experiment is respectively 3%, 2%, 3%, and 3%, and the maximum deviation of near stall total pressure ratio is respectively 1%, 2%, 2%, and 2%. These results show that the prediction method of stall limit based on the static pressure rise coefficient at the first stall section is effective. The deviation between the stall limit from CFD calculation and that from experiment is larger, and the CFD calculation needs much longer time.

Comparison of stall limit obtained by throughflow calculation, CFD, and experiment: (a) compressor 1, (b) compressor 2, (c) compressor 3, and (d) compressor 4.
Conclusions
This paper presents an investigation on predicting the stall limit of compressor at low rotating speed with throughflow calculation and maximum static pressure rise coefficient. The stall limit from throughflow calculation is compared with that from CFD calculation and experiment. The conclusions are summarized as follows:
(1) For the compressors with low inlet hub-tip ratio, the blade loading has a great change along the spanwise direction. The blade loading increases significantly from the high spanwise position toward the low spanwise position. As a result, the stall limit predicted by the throughflow calculation with spanwise averaged static pressure rise coefficient has a large deviation with the experimental result. The maximum deviation of near stall total pressure ratio and near stall mass flow reach 15% and 30% respectively. For the compressor with high inlet hub-tip ratio, the blade loading is relatively uniform along the spanwise direction. Thus, the stall limit predicted by the throughflow calculation with spanwise averaged static pressure rise coefficient has a smaller deviation with the experimental result. The maximum deviation of near stall total pressure ratio and near stall mass flow is respectively 8% and 20%.
(2) In this paper the spanwise variation of the static pressure rise coefficient is taken into account to define the stall limit prediction method. At a particular spanwise position, the maximum effective static pressure rise coefficient is calculated with the parameters at the blade section determined by the throughflow streamline. The analysis of the throughflow, CFD, and experimental results shows that the first stall section that can be used to predict the stall limit accurately is located at the low spanwise position with high blade loading and strong flow separation. Taking the maximum stage static pressure rise coefficient at the selected first stall section as the stall criterion, the stall limit of the compressors can be predicted accurately with throughflow calculation. For the four compressors investigated in this paper, the maximum deviation between the near stall mass flow from throughflow calculation and that from experiment is lower than 3%, and the maximum deviation of near stall total pressure ratio is lower than 2%.
Footnotes
Handling Editor: Sharmili Pandian
Declaration of conflicting interests
The author(s) declared no potential conflicts of interest with respect to the research, authorship, and/or publication of this article.
Funding
The author(s) disclosed receipt of the following financial support for the research, authorship, and/or publication of this article: The authors gratefully acknowledgment the support they received from the National Science and Technology Major Project (J2019-II-0005-0025, J2019-II-0017-0038).