
Abstract
To address the demand for accurate fatigue life prediction of the drilling mast for rotary drilling rig in engineering, an improved hybrid Aquila-African Vulture Optimization Algorithm (IAOAVOA) is proposed to optimize the BP neural network method for predicting the fatigue life of drill masts. Firstly, the exploration stage of the Aquila Optimizer (AO) and the development stage of the African Vulture Optimization Algorithm (AVOA) are combined, and the improved Tent chaotic mapping strategy and the multi-point Levy improvement strategy are introduced. The BP neural network is optimized to obtain the IAOAVOA-BP prediction model. Finally, the life prediction of the drill mast of a rotary drill rig is accomplished based on the dataset established by ANSYS and compared with other life prediction models. The research results show that the established IAOAVOA-BP rotary drilling rig mast life prediction model has high accuracy compared to the test sample point set. Compared with AVOABP and AOBP, the MAE value, RMSE value, and MAPE value have decreased by 53.57%, 56.52%, 53.89%, 39.71%, 99.9%, and 100%, respectively. The average relative error of IAOAVOABP is only 0.92%. The minimum life of the drill mast occurs near the large disk with a minimum number of cycles of 26,683.
Introduction
With the modernization of China, the foundation project has been vigorously developed, and the rotary drilling rig plays an irreplaceable role. 1 The drilling mast is a critical structure that bears loads of compression, bending, and torque, which is essential for ensuring the efficient and productive operation of rotary drilling rig work. The drilling mast not only has to meet the requirements of strength, stiffness, and stability but also undergoes the action of changing loads during the working process, which generates dynamic stresses inside the structure, making fatigue damage one of the main reasons for the damage of the drilling mast.
Therefore, it is of practical significance to conduct research on the fatigue life of drilling mast, predict its life, and formulate corresponding measures.
Scholars at home and abroad have carried out a large number of studies on drilling masts. Shi et al. 2 developed a mast retractable rotary drilling rig, and finite element analysis and reliability verification of the mast. Li 3 analyzed the static, modal, and harmonic response of the drilling mast of a rotary drilling rig in the lifting condition and drilling condition, determined the maximum stress, maximum deformation, and dynamic characteristics of the drilling mast, and verified the reasonableness of the structural design of the drilling mast. Gong et al. 4 got the displacement and the stress diagram using SOLIDWORKS modeling and ANSYS simulation analysis for the drilling mast in the drilling and lifting working conditions of the force. Xu et al. 5 conducted mechanical and simulation analysis of the drilling mast under typical working conditions by combined with the characteristics of a rotary drilling rig using cylinder pressurization work and identified its weak areas, providing a basis for further optimization. Liu 6 carried out a simulation analysis for the drilling mast using windlass pressurization, derived the stress diagram of typical working conditions, and finally carried out an optimization analysis. Zhao et al. 7 analyzed the drilling and lifting conditions respectively, and combined them with the reliability investigation, taking the drilling mast pressurized with oil cylinders as the object.
However, there are relatively few fatigue studies for the drilling mast of rotary drilling rigs. Huang et al. 8 established a mathematical model of drill bit into rock and applied it to the dynamic response analysis of the mast according to the working load of the drill bit, obtaining the fatigue life of the dangerous parts by using Miner’s linear fatigue damage theory. Zhang 9 investigated the vibration fatigue life of the mast structure based on the power spectral density theory and fatigue life theory. Lin et al. 10 obtained the load transfer characteristics and Von Mises stress distribution of the mast under three ultimate working conditions through simulation analysis, and analyzed the simulation results. Through a dynamic stress test, they also obtained the one-dimensional stress spectra and equivalent stress values of the mast and evaluated its fatigue strength. Li 11 analyzed the stresses in the ultimate working state of each typical working condition, and then conducted a fatigue life study on the weld seams at the base of the main windlass of the rotary drilling rig, as well as the weld seams at the intersection of the mast, the slide rail and the inner bulkhead based on the linear fatigue cumulative damage theory and using the nominal stress method.
Regarding the fatigue design of engineering structural components, some scholars conduct the life calculation based on the classical mechanical theory and the linear damage criterion of Miner 12 but they failed to take into account the effect of load interactions in terms of load level independence, load sequence independence, and crack tip plasticity, etc. 13 The cumulative fatigue damage saturation model proposed by He et al. 14 and the improved Miner’s damage accumulation algorithm proposed by Liu 15 could overcome the inherent defects of the damage accumulation law. Zhou et al. 16 proposed a new cumulative damage model by combining the damage curve method and the Corten-Dolan model, and designed a separate test to verify it. Some scholars have studied fatigue based on probabilistic statistics. Shimizu et al., 17 to solve the statistical problem of fatigue life distribution of materials with very small samples, fused the three-parameter Weibull distribution and the lognormal distribution to fit the P-S-N curve of the material. Jiang et al. 18 and Sadik and Kurnia 19 investigated the auxiliary role of Bayes’ technique for fatigue life estimation in the case of small samples and proposed a linear regression analysis technique for fatigue life curves under the condition of lognormal distribution. Some scholars have investigated fatigue life prediction based on information technology, including fuzzy theory, 20 artificial neural networks, 21 expert systems, 22 genetic algorithms, 23 and other intelligent algorithms. Among them, the BP neural network is widely used because it can solve complex nonlinear mapping problems due to its excellent adaptive learning ability and parameter adjustment mechanism. Through backpropagation, it continuously adjusts and optimizes weights and biases to fit complex nonlinear relationships.24–27 However, the traditional BP neural network has slow convergence and is prone to fall into the local optimal solution when predicting the life span. 28
Through extensive reading of literature, we have found that rotary drilling rigs are difficult and have poor accuracy in predicting their lifespan, with no efficient and accurate applicable methods. Furthermore, no scholar has applied neural network technology to the field of rotary drilling rigs. In response to the above issues, this article develops the IAOAVOA-BP prediction model, which solves the convergence and algorithm deficiencies in existing methods. It not only improves the prediction accuracy, but also promotes the development of rotary drilling rig life prediction technology, providing a more scientific basis for equipment maintenance, upkeep, and replacement.
In this paper, an improved hybrid Aquila 29 -African Vulture 30 optimization algorithm is introduced to optimize the BP neural network to solve the convergence and algorithmic insufficiency problems encountered in the life prediction of the drilling mast for rotary drilling rig. The IAOAOVA combines the exploration phase of AO and the exploitation phase of AVOA to retain the valuable search capability of each. Then, employs the improved Tent chaotic mapping strategy for the population initialization and the multi-point Levy flight strategy, to improve the algorithm’s global optimization-seeking capability. The improved IAOAOVA algorithm optimizes the weights and thresholds of the BP neural network to obtain the IAOAVOA-BP prediction model. A case study of a specific rotary drilling rig is presented, where the finite element software is used to establish the dataset, and the fatigue life prediction of the drilling mast for rotary drilling rig is completed using the IAOAVOA-BP model.
In this study, neural network technology is innovatively combined with rotary drilling rigs. In order to meet the demand for fatigue life prediction of rotary drilling rig mast in engineering applications, an innovative solution is proposed. Specifically, an improved IAOAVOA optimized BP network prediction model combining the Hybrid Eagle Optimization Algorithm (AO) and African Vulture Optimization Algorithm (AVOA) has been proposed. In addition, comparisons were made with four traditional algorithms: PSOBP, AVOABP, AOBP, and BP. The results indicate that the model not only effectively overcomes the limitations of traditional algorithms in terms of prediction accuracy, slow convergence speed, and susceptibility to falling into local optima, but also fills the gap in the application of neural network technology in rotary drilling rigs.
Rotary drilling rig working principle and working condition classification
The rotary drilling rig is primarily composed of chassis, drilling tools, drilling rods, drilling mast, power head, support mechanism, main windlasses, auxiliary windlasses, and hydraulic control system, etc. During the operation of a rotary drilling rig, the drill bit attached to the front end of the drilling rod is brought close to the ground by applying appropriate vertical thrust to the drilling rod, and then the drill bit drills the soil downward through the pressurized force provided by the hydraulic or windlass system and the torque provided by the power head. When the dirt fills up inside the drill bit, the main windlass lifts the drill rod, the drill bit leaves the hole. The rotary drilling rig slews the drilling mast engine to a certain angle, opens the bottom door of the drill bit, pours out the dirt, then closes the bottom door of the drill bit, and so on in a reciprocal operation.
In order to determine the dangerous working conditions and predict the fatigue life of the drilling mast, based on the actual construction method and force characteristics of the rotary drilling rig analysis, this study condenses the working process of the rotary drilling rig into seven typical working conditions, as shown in Table 1.
Rotary drilling rig working condition collection.

Fatigue theory
Load spectrum
The life of lifting equipment can be effectively evaluated by means of load spectra. According to ISO:4301-3:2021, the corresponding load spectrum is obtained by the combination of the load spectrum coefficients calculated in equation (1) and the available load life data. The load spectrum coefficient formula is:
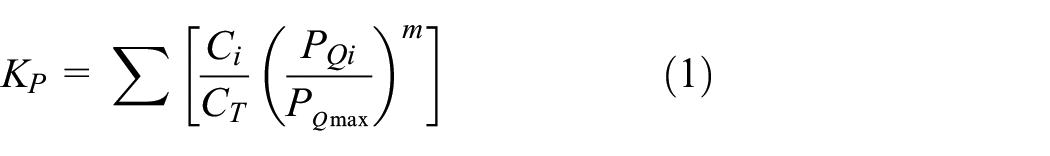
Where
S-N curve
The S-N curve can be used to characterize the fatigue strength of a material with the relationship between stress and the number of cycles:

Where
Linear fatigue damage theory
Combining the load spectrum and the S-N curve, the remaining fatigue life of the drilling mast is predicted using Miner’s linear fatigue damage theory with the formula:

Where
Establishment of prediction model
BP, as a feed-forward neuronal network, can be trained with lifetime data and learn the complex relationship between inputs and outputs to predict device lifetime. However, during training, BP neural networks are very sensitive to the initial selection of weights and thresholds (also known as biases). Due to the random initialization of weights and thresholds, the BP neural network may fall into local optimal solutions instead of global optimal solutions, leading to an increase in training time. Therefore, in order to overcome the problems of poor prediction accuracy and slow convergence caused by the sensitivity of BP neural networks to weights and thresholds, this paper introduces an improved algorithm with high-speed iteration and global optimization search (IAOAVOA) for optimizing the weights and thresholds in BP neural networks.
AO has a strong global exploration capability but an unstable local development phase, while AVOA has a good development capability but an insufficient exploration phase. Based on the characteristics of the two algorithms, IAOAVOA combines the exploration phase of AO and the exploitation phase of AVOA, which makes up for the shortcomings of the single algorithm and improves the ability of the algorithm to solve the global optimum. To address the problem of slow convergence speed and susceptibility to local optima in fusion algorithms: the improved Tent chaotic mapping strategy is introduced to complete the initialization of the population, and a small search is conducted near the optimal position by introducing a multi-point Levy flight strategy, which effectively expands the search range of the algorithm, improves the ability of the individual vulture to search for the global optimum and increases the convergence speed.
Aquila Optimizer Algorithm (AO)
Aquila Optimizer (AO) is proposed by Abualigah and other scholars in 2021, its design concept originated from the flexible and changeable natural behaviors displayed by Aquila when catching prey in nature. This algorithm constructs a mathematical model by simulating the process of Aquila rapidly adjusting its hunting strategy when confronted with different prey. 31 The prey hunting process of the Aquila is mainly divided into three phases, that is, initialization, exploration phase, and exploitation phase. The exploration phase is further divided into an expanding search phase and a narrowing search phase, while the exploitation phase is divided into an expanding exploitation phase and a narrowing exploitation phase. The flow chart is shown in Figure 1.

Flowchart of Aquila optimization algorithm.
Initialization stage
Firstly, the AO algorithm searches randomly for individual locations within the search range and determines the initial values of N individuals.

Where
Exploration stage
Expanded exploration
Aquila soars high in the sky and expands its search range by raising its altitude in order to obtain the location of its prey and determine the optimal hunting range. The mathematical expression is:
Where

Narrow exploration
Aquila determines the range of its prey and hovers over it, is ready to attack. The mathematical expression is:

Where
Exploitation stage
Expand exploitation
When the area where the prey is located is pinpointed, the Aquila adjusts its flight attitude and speed in preparation for a vertical descent for an initial attack. The mathematical expression for this behavior is:

Where
Narrow exploitation
As the Aquila gradually approaches the prey, the Aquila performs a vertical descent and attacks based on the prey’s random motion behavior, the mathematical expression for which is:
Where
The AO algorithm has strong global optimization ability, but its convergence accuracy is relatively low, and it is not stable enough in the local development stage, making it easy to fall into local optimal solutions, which may result in the algorithm being unable to find the global optimal solution during the search process.
African Vulture Optimization Algorithm (AVOA)
African Vultures Optimization Algorithm (AVOA) is a new meta-heuristic algorithm proposed by Abdollahzadeh et al. in 2021. 32 The algorithm mainly performs problem optimization by simulating the foraging and sailing behaviors of African vultures, which is characterized by strong optimization ability and fast convergence speed. The flowchart is shown in Figure 2.
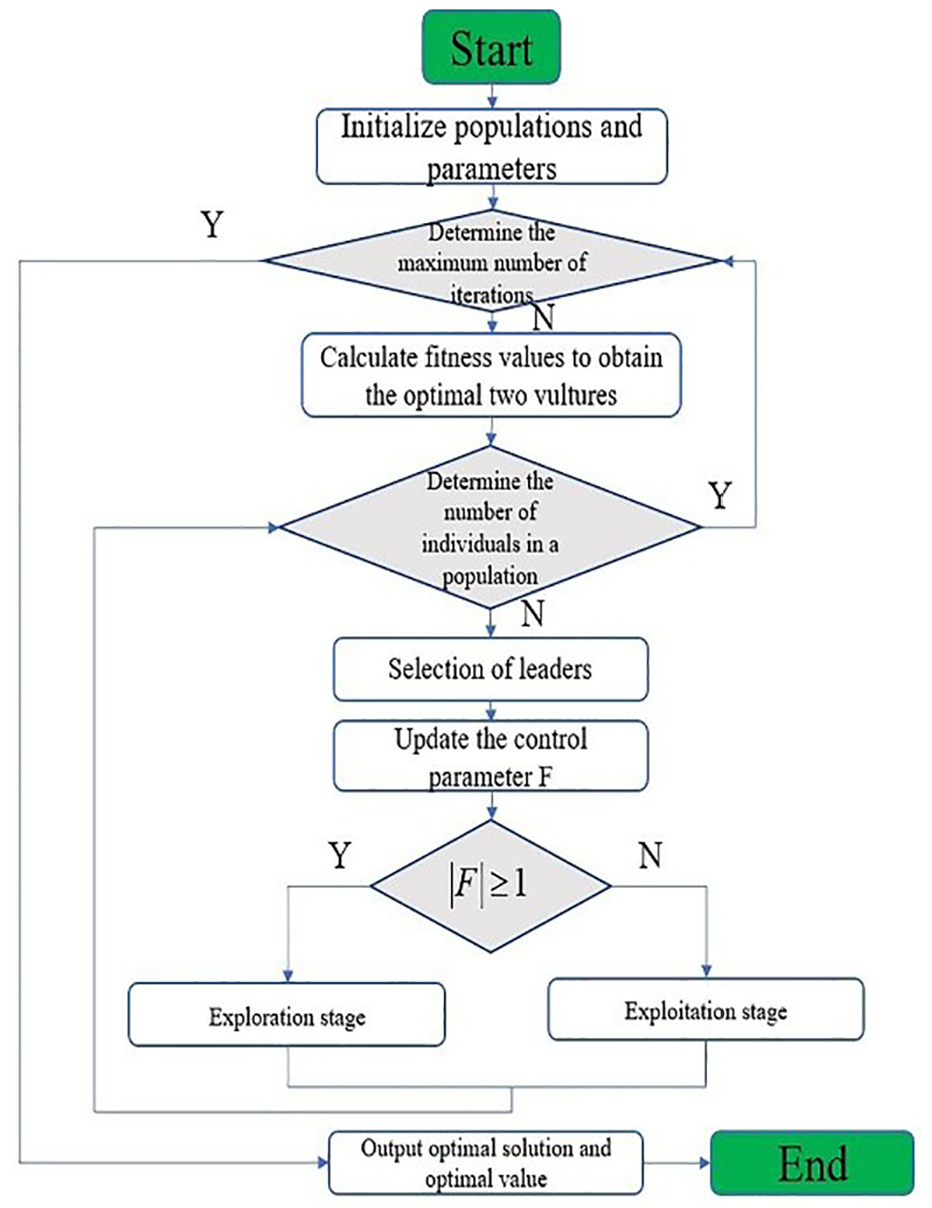
Flowchart of the African vulture optimization algorithm.
Vulture population subgroups

Vultures in the population are divided into three categories: optimal vultures, sub-optimal vultures, and common vultures.
Satiation rate of vultures
The AVOA algorithm transforms exploration and exploitation based on the satiation rate of vultures with the mathematical expression:


Where
Exploration stages of vultures
When


Where
Vulture exploitation stage
When


Although the AVOA algorithm has certain development capabilities, its exploration mechanism is relatively insufficient, resulting in low search efficiency of the algorithm in the global search stage. In addition, like other swarm intelligence algorithms, AVOA algorithm is also prone to getting stuck in local optima during the optimization process, and its convergence speed is slow, which limits the effectiveness of the algorithm in solving complex optimization problems.
AOAVOA algorithm
AO has strong global exploration capabilities, but the local development stage is unstable, while AVOA has good development capabilities but insufficient exploration stage. Based on the characteristics of the two algorithms, AOAOVA combines the exploration stage of AO and the mining stage of AVOA, making up for the shortcomings of a single algorithm and improving the algorithm’s ability to solve global optima.
However, the fused algorithm has shortcomings in performance before and after mining. The irregular and uneven distribution of the population in the early stage leads to an increase in convergence time and a tendency to fall into local optima and fail to converge in the later stage. This article will be improved on these two aspects.
Improved Tent chaos mapping
In the exploration stage of the Aquila (AO) population, the use of random generation to initialize the population often results in the irregular and uneven Aquila population distribution, while chaotic mapping by a deterministic system is widely employed to generate the characteristics of the nonlinear random order, with the commonly used Tent and Logistic chaotic mappings being popular choices for population initialization.
As shown in Figure 3(a), it can be seen that the Tent chaotic mapping exhibits better uniformity in chaotic sequence generation, but it does have the problem of falling into small and unstable periodic points during the iteration process, resulting in chaotic sequences showing periodic behaviors, which affects the stochastic and uniformity of chaotic sequences. Logistic chaotic mapping as a typical nonlinear dynamical system, often serves as a paradigm for illustrating how complex chaotic phenomena arise from very simple nonlinear dynamical equations. As shown in Figure 3(b), the Logistic chaotic mapping takes values with a concentrated distribution between [0, 0.1] and [0.9, 1.0], resulting in an inhomogeneous chaotic sequence.

Histogram of three chaotic sequences. The Tent chaotic mapping (a), The Logistic chaotic mapping (b) and (c)The improved Tent chaotic mapping.
Tent and Logistic chaotic mapping exhibit uneven performance and poor chaotic effects. Therefore, the improved Tent chaotic sequence is chosen, which is the addition of random variables to the traditional Tent chaotic mapping
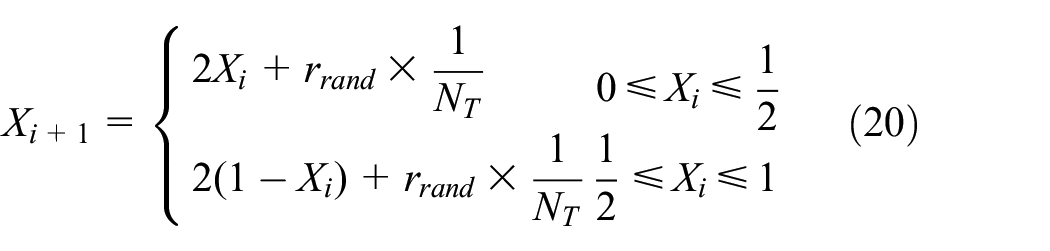
After the Bernoulli 33 transformation, expression (20) reads:

Where
Due to the imbalanced distribution of the initial Aquila population, this paper employs an enhanced Tent chaotic sequence method for population initialization. This approach aims to generate a set of points in the search space that are more evenly dispersed, consequently improving the algorithm’s search efficiency and the quality of the ultimate solution. The detailed implementation steps are outlined below:
Initializing chaos variables
Firstly, an initial chaotic variable
Applying improved Tent chaos mapping for iteration
A chaotic sequence
Preserving chaotic sequences
When the number of iterations
Mapping chaotic sequences to the search space of individual Aquila
Each element of the chaotic sequence

The mapping equations are as follows:

Initialize populations using mapped sequences
Initialization of the population is accomplished by using each element in the mapped sequence
Multi-point Levy flight strategy
In the local later stage of exploitation, population aggregation can lead to the algorithm’s inability to jump out of the local optimum. To improve the algorithm’s ability to achieve global optimality and escape local optima, a multi-point Lévy flight strategy is introduced. The specific steps are as follows:
Introduction of flight steps (Levy(d))
Adjusting the effect of the optimal or suboptimal vulture position on the current vulture position allows the vultures to make occasional long jumps during the search, thus increasing the diversity of the search and helping to discover the global optimal solution.
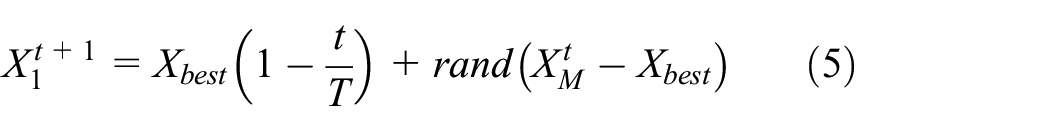
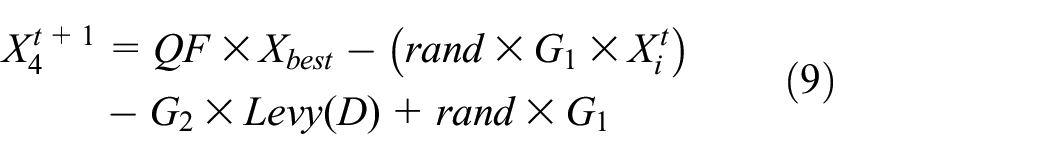
Location update based on optimal and suboptimal vultures
The balance between local and global search in the search process is achieved by considering the distance between the current vulture (
The updated expression for the optimal and suboptimal vulture positions is:

Where
BP prediction model based on IAOAVOA optimization
Although BP neural networks may exhibit good performance on training data, they may perform poorly on unsuspected test data, indicating poor generalization. 34 Inappropriate initial values of weights and thresholds may lead to inefficiency of the gradient descent algorithm during training in finding the optimal solution, and may even result in stagnation of training, that is, the problem of vanishing or exploding gradients. The improved IAOAVOA algorithm aims to improve the prediction accuracy and convergence efficiency of the neural network by optimizing the weights and thresholds of the BP, thus improving its overall performance. The IAOAVOABP prediction process is shown in Figure 4.
(1) Data processing, divide the data into the training set and test set according to 8:2, and normalize the data so that the data is between [0, 1], to avoid poor model accuracy due to large numerical deviation.
(2) Establish the BP neural network structure with four input nodes and one output node, and set parameters such as learning rate and iteration number.
(3) Adopt the improved Tent chaotic mapping to initialize the population, and the multi-point Levy flight strategy to optimize the AOAVOA, and get the IAOAVOA model.
(4) Use the obtained optimization model to update the positions of the optimal, suboptimal, and other vultures, and after updating the vulture positions, recalculate their fitness values and compare them with the previously saved best fitness values. If the fitness value of one of the updated vultures is better than the previous best value, the optimal and sub-optimal positions are updated. The global optimal solution is selected after reaching the desired accuracy or maximum number of iterations.
(5) Establish a finite element model, select four key design parameters as inputs, and create a dataset with the fatigue life of the drilling mast as the output target.
(6) Update the weights and thresholds of the BP neural network to form the IAOAVOABP prediction model, and end the training after the BP neural network algorithm reaches the maximum number of iterations or preset convergence accuracy.
(7) Evaluate the test data using the trained IAOAVOABP prediction model to verify its prediction performance and complete the prediction of rotary drilling rig drilling mast life.

IAOAVOA-BP fatigue life prediction process.
Example analysis
Parameters of the model
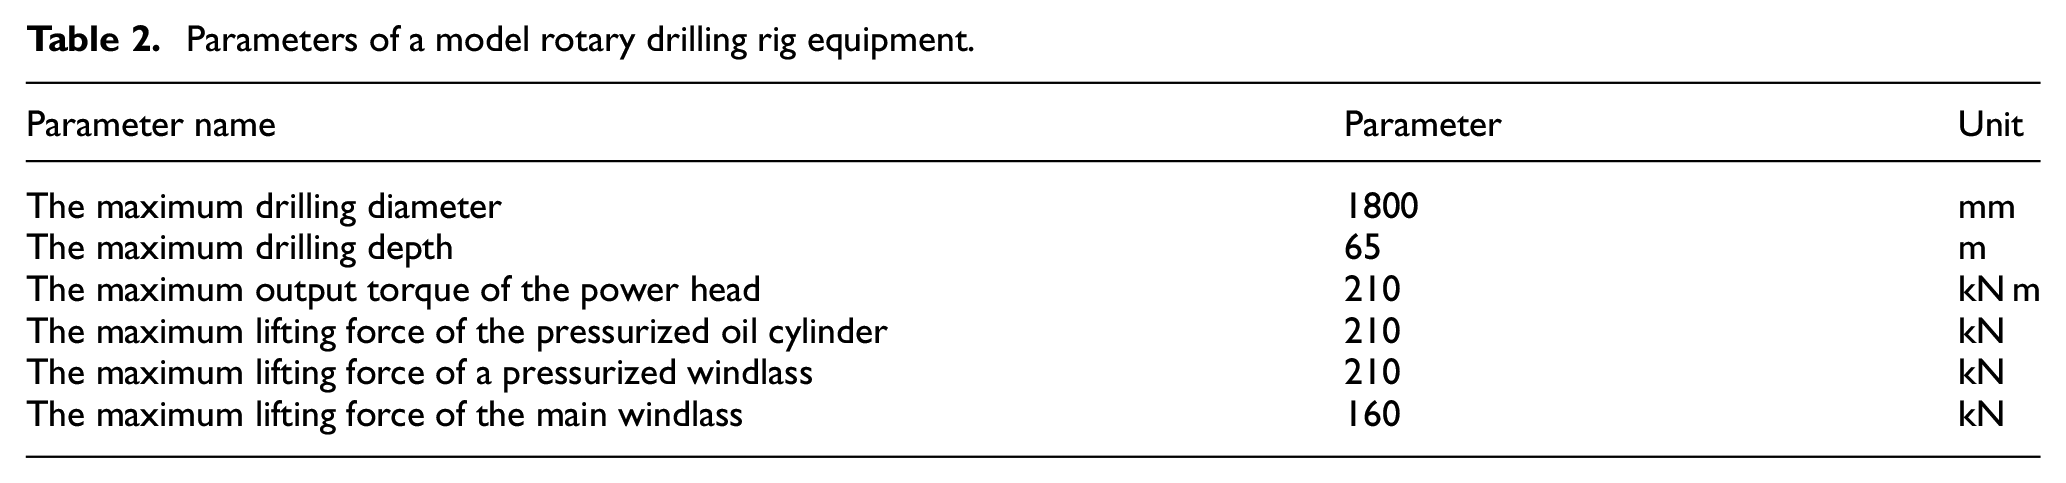
This paper takes a certain model of rotary drilling rig drilling mast model as an example, the equipment parameters of a certain model of rotary drilling rig are shown in Table 2. Multiplying the parameters of the rotary drilling rig equipment with the corresponding load coefficients and dynamic load coefficients gives the individual loads on the drill mast. The drilling mast material is Q550C, and its mechanical parameters are shown in Table 3.
Parameters of a model rotary drilling rig equipment.
Mechanical parameters of Q550C material.

Modeling
The finite element model of rotary drilling rig drilling mast is conducted according to the relevant design dimensions. The local non-structural detail dimensions of the drilling mast are selected according to the finite element discretization convention, in which the actual structure of the drilling mast including details such as diaphragm, reinforcement, pad, and so on, is simplified to ensure that the drilling mast meets the original strength, stiffness, stability requirements. A three-dimensional solid model is established for the lower mast, the middle mast, the upper mast, the goose head, the back wheel, the tilting cylinder support, the pressurized oil cylinder support, and other parts. The bottom-up assembly of the drilling mast cross-section, consisting of a closed box and the guide rail, with a height of 18,550 m, is modeled using Solid186 solid unit and shell unit Shell181, coupled with modeling, MPC unit to connect to complete the assembly of three-dimensional solid models of the drilling mast, as shown in Figure 5.
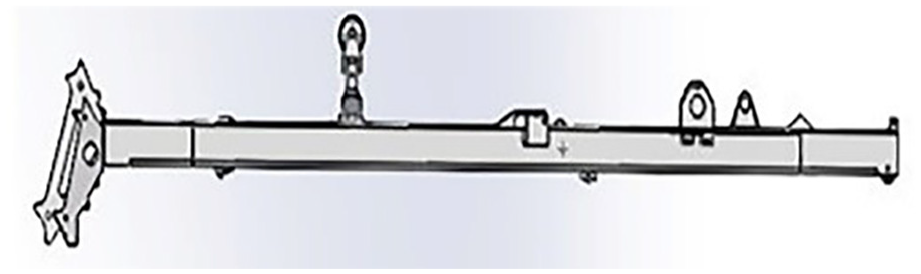
3D solid model.
Meshing
Finite element meshing is a crucial step for finite element numerical simulation analysis. Generally, the increase in the number of meshes will improve the calculation accuracy, but at the same time, it will increase the calculation scale, so the two factors should be traded off in determining the number of meshes for comprehensive consideration.
The Mesh Tool of ANSYS is used to control the grid sparsity by the selection of the accuracy level and the setting of Global Size. The model is meshed with tetrahedral free meshing using the intelligent mesh division, and the grid cell sizes are set to 40, 50, 60, 70, 80 mm. The simulation results are shown in Figure 6, where the vertical coordinate indicates the maximum stress value under the grid cell

Grid validation.
Loads and boundary conditions
Under the condition of lifting the drilling mast in the hole, the loads applied include wind load, self-weight load, main windlass lifting force, and pressurized windlass lifting force. The pin holes on the drilling mast connected with the tilting cylinder are constrained to move horizontally, while the rotary table is used as a movable hinge support.
When the drilling mast is loaded, the equivalent external force method is used to deal with the pulley frame force, and its force analysis is simplified to a plane problem, and then the parallel four deformation rule is used to calculate the size and direction of the tension of the wire ropes that have been determined for each pulley. The combined force on the pulley axle is calculated by the graphic method. Finally, the pressure on the pin of each pulley is derived as shown in Figure 7. The angle of each wire rope is shown in Table 4.

Force diagram of each pulley: (a) front pulley of the forehead, (b) pulley behind the forehead, (c) rear pulley, and (d) pressure pulley at the rear pulley.
Angle of each wire rope.

Stress and fatigue analysis
In the working process of the rotary drilling rig, the drilling mast, as the main bearing structure, shows nonlinear characteristics in its mechanical response. Therefore, when analyzing the drilling mast based on the limit state method, the comprehensive effects of deformation on the structural stiffness, displacement, and strain must be considered. Therefore, large deformation analysis should be used in the simulation process, which is more in line with the complex mechanical behavior and deformation characteristics of the drilling mast in the actual working environment. The stress state of the drilling mast is obtained, as shown in Figure 8, indicating that most of the drilling mast II is in a high-stress state, and the stress is concentrated between the rotary table support and the tilting cylinder support, with a maximum stress value of 237.29 MPa, which is much lower than the yield strength of the drilling mast material.

Stress cloud diagram.
The number of cycles is obtained through Fatigue, the post-processing fatigue analysis module of ANSYS.
Data set creation
The simulation difficulty is directly proportional to the number of design parameters, so choosing appropriate design parameters and streamlining unnecessary parameter levels can better reflect the relationship between design parameters and fatigue life. The fatigue life of the drilling mast for rotary drilling rig is mainly influenced by the structure of the drilling mast and the amount of force. The force is related to the tilt angle of the tilt cylinder and the angle of the wire rope through the back sheave. The main design parameters selected in this paper are web plate thickness, flange plate thickness, tilting cylinder angle, and back sheave angle. For the angle range, it needs to be skewed on the original basis. According to the series of drilling masts provided by the enterprise, the minimum thickness of the web plate is 8 mm, the maximum thickness is 20 mm, the minimum thickness of the flange plate is 10 mm, and the maximum thickness is 20 mm. According to the design requirements and actual measurements taken by the enterprise, the allowable deviation for the tilt angle of the rotary drilling rig’s oil cylinder and the angle of the back wheel is 2° when various components of the rotary drilling rig deviate during operation. The value range of specific parameters is shown in Table 5.
Range of values for design parameters.

In order to reduce the number of samples for numerical analysis, the Optimized Latin Method (OLDH) is used to select uniform and random sample points with orthogonal influences. As can be seen from Table 5, the influence factor m = 4, to ensure accuracy, according to the principle of factor level selection in the design range of a total of 214 parameter points on the horizontal plane, the software integration platform in the Fatigue module in ANSYS for the calculation of fatigue life, the selection of the first 184 for the training set, and the last 30 for the test set. The training set samples are shown in Table 6 below.
Selection of training dataset.

Results and analysis
Reliability
The safety factor of the drilling mast structure can be calculated according to equation (25).

Where
Evaluation indicators for predictive models
In order to reflect the performance of the IAOAVOABP prediction model more obviously, the mean absolute error (MAE), root mean square error (RMSE), and mean absolute percentage error (MAPE) are used as the evaluation indexes, and their deviation equations are:
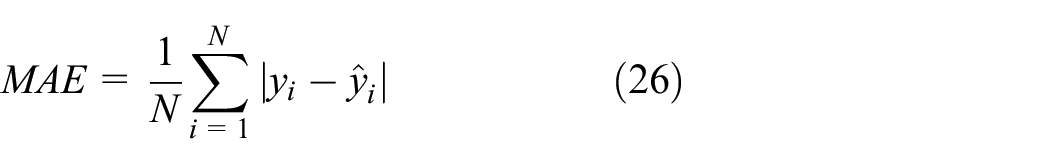

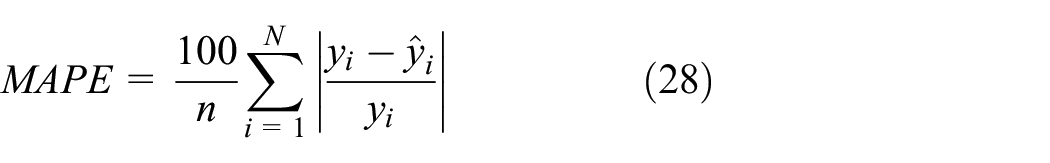
Where N is the sample size,
Comparison of forecast results
The IAOAVOABP prediction model is compared with PSOBP, AVOABP, AOBP, and BP algorithms. The comparison of the prediction performance of different algorithms is shown in Figures 9 to 11.
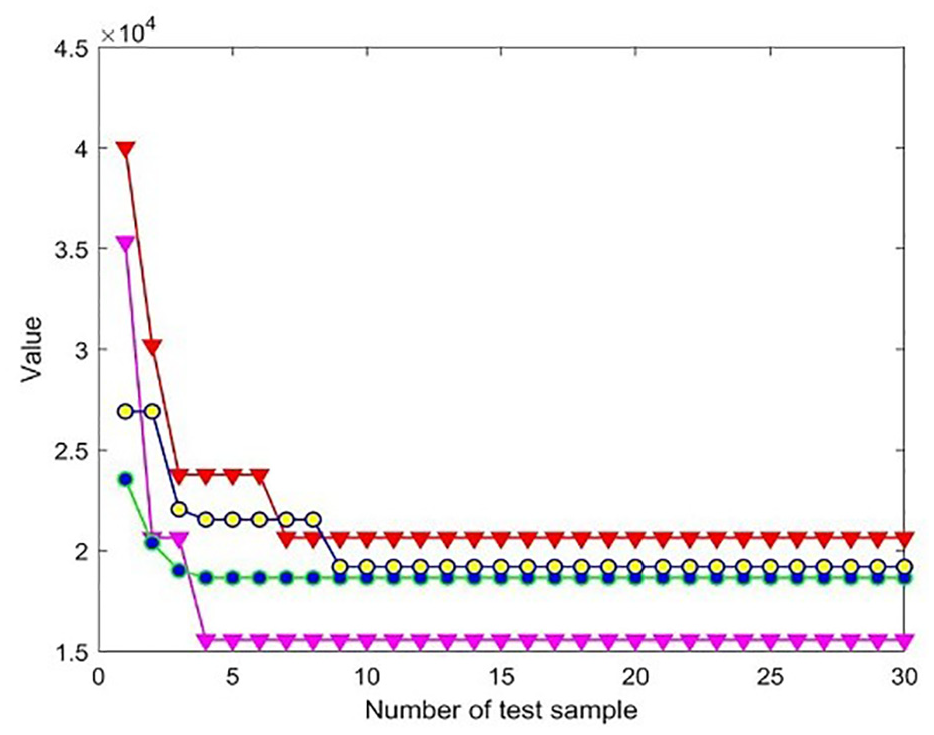
Adaptation curves.

Error curves of different prediction models.

Prediction curves of different prediction models.
As shown in Figure 9, it can be seen that the convergence speed of the improved IAOAVOABP algorithm is significantly improved, with the minimum value of 1.55 × 10⁴, which is smaller than the values of the other intelligent algorithms, which indicates that the improved IAOAVOABP can find the optimal solution quickly. Figure 10 shows that the IAOAVOABP predicted value is closer to the real value compared to the other algorithms. Furthermore, as illustrated in Figure 11, the error of IAOAVOABP is smaller compared to the other algorithms, which further demonstrates that the improved IAOAVOABP is more accurate in predicting the model.
Different evaluation metrics can show the accuracy of the model in different ways. The specific evaluation index values of different models, as well as the average relative errors, are shown in Table 7. The results show that the three evaluation index values of the IAOAVOABP prediction model are better than the other three prediction models, with a decrease of 53.57% in the MAE value, 56.52% in the RMSE value, and 53.89% in the MAPE value compared to AVOABP. Compared to AOBP the MAE value decreased by 39.71%, the RMSE value decreased by 99.9%, and the MAPE value decreased by 100%. The IAOAVOABP has the smallest average relative error of 0.92%.
Evaluation indicators for different models.

In conclusion, the comparison of the three evaluation indexes indicates that the improved IAOAVOABP has a higher prediction accuracy than the individual algorithms, and can more accurately predict the life of the drilling mast for rotary drilling rig. Therefore, in practical applications, the IAOAVOABP prediction model can be chosen to predict and evaluate the life span of the drilling mast for rotary drilling rig, ensuring the safety of construction operations.
Simulation verification
In the study, we have used finite element simulation methods to preliminarily validate the model. These simulation results are consistent with the stress distribution and fatigue life prediction trends under actual working conditions, providing us with preliminary confidence. We will use another simulation technique to verify the results, specifically by utilizing sub-model technology and the VERITY module of FE-SAFE software to analyze fatigue life. Based on the research in this article, it was determined that the area prone to fatigue is near the large disc support of the middle drilling mast. Therefore, sub-model technology was used to model the solid elements and construct a sub-model of the large disc support. The grid size was set to 10 mm, with a total of 508,331 nodes and 126,070 elements. Then insert the displacement results and import the cutting boundary constraints of the overall model. Analyze and solve the sub-model to obtain the stress cloud map, as shown in Figure 12.

Stress cloud map of sub-model.
Subsequently, combining Miner’s linear cumulative damage theory and load spectrum, and using FE-SAFE for fatigue analysis, a fatigue result file was obtained, which was imported into ANSYS for post-processing to obtain the fatigue life cloud map, as shown in Figure 13.

Cloud chart of fatigue life.
It can be seen that the minimum number of life cycles is only 104.4255, which is consistent with the simulation and prediction results. The location where fatigue failure is prone to occur is also the location with the highest stress, which is consistent with engineering practice.
Conclusions
In this study, starting from the demand of fatigue life prediction of drilling mast of rotary drilling rig, considering that the traditional algorithm has slow convergence speed and is easy to fall into the local optimal solution, we construct an improved IAOAVOA optimized BP network prediction model with mixed sky eagle optimization algorithm (AO) and African vulture optimization algorithm (AVOA) and then take a certain model of rotary drilling rig as an example, and based on the finite element of the lifting condition of rotary drilling rig in a hole, establish a data set, train, and test, and complete the life prediction of the rotary drilling rig analysis, establish the data set, and train and test to complete the life prediction of rotary drilling rig drill mast, and get the conclusions as follows:
(1) By comparing the established IAOAVOABP rotary drilling rig drilling mast life prediction model with PSOBP, AVOABP, AOBP, and BP algorithms, and evaluating it by using three metrics of MAE, RMSE, and MAPE, the results show that the IAOAVOABP model outperformed the other models, with the MAE, RMSE, and MAPE values of the IAOAVOABP, decreasing respectively by 53.57%, 56.52%, 53.89%, 39.71%, 99.9%, and 100%, compared to the AVOABP and the AOBP. The IAOAVOABP model had the smallest average relative error of 0.92%, indicating that it fits the sample point data well and provides more accurate predictions of the lifespan of the drilling mast for rotary drilling rig.
(2) The prediction results show that the model with a web thickness of 8 mm and a flange thickness of 14 mm is most susceptible to fatigue failure, with a minimum fatigue life of 26,683 cycles, which is consistent with the actual situation and simulation results of the existing 178F model. Among them, it can be found that the stress concentration phenomenon is mainly concentrated in the area near the large disc support of the middle drilling mast, and the maximum stress value in this area reaches 237.29 MPa. At the same time, this is also the shortest lifespan part of the drilling mast, which verifies that stress concentration areas on the drilling mast are indeed more prone to fatigue failure or damage, which is consistent with engineering practice experience. In addition, based on these fatigue life prediction results, useful references can be provided for the optimization design of drilling mast structures, such as considering measures such as replacing materials, adjusting geometric structures, or optimizing load spectra to effectively improve the fatigue life of drilling masts.
(3) There are still many shortcomings in this prediction system. Firstly, in terms of data, selecting fewer training samples may lead to poor stability of the model. There is a significant gap between the predicted results and the actual lifespan due to low-quality data, and the system may perform worse for specific types of datasets. Secondly, improving the algorithm involves multiple parameter settings, such as population size, iteration times, learning rate, etc. Different parameter settings can lead to different results, and not enough parameter combinations or adaptive mechanisms have been attempted. There are currently many strategies for improving optimization algorithms, such as Gaussian mutation, Cauchy mutation, differential mutation, etc. Different improvement strategies have different effects on the algorithm and even affect the final prediction results. No other improvement strategies have been attempted. This system is not suitable for all types of problems, and certain specific problems and unexpected situations make IAOAVOA’s search strategy unable to effectively adapt to different prediction needs.
In response to these shortcomings, future research directions should focus on enhancing the prediction system by expanding the training dataset to improve model stability, exploring and testing various parameter settings and combinations as well as incorporating adaptive mechanisms to optimize the algorithm, and developing more versatile and adaptable search strategies to broaden the applicability of the system across different types of problems and unexpected situations, while also considering the implementation of various improvement strategies for optimization algorithms.
Footnotes
Handling Editor: Sharmili Pandian
Declaration of conflicting interests
The author(s) declared no potential conflicts of interest with respect to the research, authorship, and/or publication of this article.
Funding
The author(s) received no financial support for the research, authorship, and/or publication of this article.