
Abstract
The hydraulic control system has a significant effect on the performance of an automotive transmission system. Conducting a full virtual design and dynamic characteristic optimization of the hydraulic control system parameters during the system development process has a highly significant effect on shortening the development cycle and improving the system performance. This article takes a specific eight-speed auto transmission (8AT) as the control object and, based on the control requirements, principle design of the main circuit, the shift function, and the cooling lubrication system is conducted. In the main pressure regulating circuit, the effect of each structural parameter on the system performance is analyzed by solving the dynamic equations. Further optimal structural parameters for the valve spool are acquired by using a genetic algorithm, and a fluid flow channel simulation the software is Ansys Student 2024 R2 is conducted. The results obtained show that after optimization, the overshoot of the main circuit response is reduced by 18% and the rise time is reduced by 0.08 s; use of the optimal structural parameters of the valve spool can improve the response characteristics significantly.
Keywords
Introduction
In hydraulic control systems, various mechanical valves, solenoid valves, accumulators, and other components are connected via oil circuits, thus forming a complete hydraulic module. Solenoid valves, which are actuated by electrical impulses, can control spool movements; then, the pressure, flow rate, and flow direction in the oil circuits can be changed accordingly, and further actuator functions can be carried out. The automotive driveline, which is one typical application of hydraulic control systems, performs the functions of clutch control, synchronizer shifting, cooling, and lubrication, and the driveline’s dynamic and static characteristics have a significant impact on vehicle performance.1,2 In hydraulic control systems, one proportional control unit is usually composed of a combination of a proportional pilot valve and other mechanical valves, which allows the unit to realize pressure and flow control of one or two oil circuits. In recent years, many researchers have established dynamic equations for hydraulic systems (mainly for the proportional control unit) through theoretical analysis, conducted in-depth research into important system parameters, and have mainly studied the influence of these parameters on the system performance and the mechanisms. In addition, many practical measures have been proposed to improve the performance of hydraulic control systems. Bury et al. 3 studied control of hydrostatic transmission using a proportional valve start-up process. The proportional spool valve was described using a modified model, which improved the performance of the model significantly in the closed-loop control process. Karpenko and Bogdevičius 4 analyzed fluid dynamics phenomena in pipelines using computational fluid dynamics (CFD) methods. Because of changes in the cross-sectional area and the structure of the fittings, the system generated large-scale turbulence after being connected through joints. Experimental data confirmed that the pressure loss of the system increased as the number of systems increased.
Liu et al. 5 proposed a structure to balance the hydrodynamic force of a cartridge poppet, and CFD simulations were performed to obtain the rules for the influence of these parameters on the hydrodynamic force. The influence of a steady flow force on the dynamic characteristics of hydraulic valves was analyzed by Wu et al. 6 and the valve structure was optimized accordingly, with a new valve sleeve being designed to compensate for the axial steady flow force. To perform hydraulic valve spool optimization, Gui et al. 7 proposed a multi-objective evolutionary algorithm that adjusted the spool mass and the transient and steady-state hydrodynamic forces by optimizing the structural parameters of the servo valve spool. Wu et al. 8 studied the influence of the rectangular valve groove structure on the internal flow field characteristics of a slide valve via fluid flow simulations. Use of an improved rectangular groove structure allowed the flow field distribution in the slide valve to be improved obviously, spool deformation to be reduced effectively, and the dynamic and static performances of the reversing valve to be improved. Li et al. 9 proposed a valve core with an inclined gradually expanding throttling groove shape. Through a combination of virtual simulations and experimental verification, they confirmed that this structure helped to improve the valve’s starting stability, response speed, and flow control accuracy, and it also improved the micro-movement characteristics of the proportional valve. Zhang et al. 10 proposed use of a novel combined groove structure as an alternative to the traditional slide valve spool throttle groove structure. Internal flow field simulations and fluid-solid coupling simulations revealed that the new combined groove structure can improve the valve’s internal flow field distribution and reduce spool deformation.
This article takes an eight-speed auto transmission (8AT) as the control target and its hydraulic control function is designed. Furthermore, to improve the dynamic characteristics of the transmission’s main oil pressure, the proportional control unit of the main oil circuit is selected as the research object. The force acting on the spool is analyzed and dynamic differential equations are then constructed. The effects of the key parameters on the dynamic characteristics of the system and their influencing mechanisms are analyzed in detail. The optimal parameter set is then obtained by using a multi-objective evolutionary algorithm with the aim of optimizing the dynamic response of the spool. Finally, CFD simulations are performed before and after the optimization process to compare and analyze the changes that occur in the flow field.
Design of the hydraulic system
The 8AT under study contains dual motors, four clutches, two brakes, and multiple sets of planetary gears, bearings, and other components (Figure 1). The hydraulic control system controls the engagement/disengagement of the clutches based on the vehicle’s operating conditions, thus enabling gear shifting from 1 to 8 and power line switching. All clutches and brakes operate independently without a common control oil circuit. The principle of the designed hydraulic control system based on the functional requirements described above is shown in Figure 2. The system is equipped with mechanical and electronic dual pumps that can adjust the flow rate accurately in sufficient time to meet flow demand and reduce the energy consumption of the hydraulic control system. The pressure of the main oil circuit is controlled by the solenoid valve MSV (main solenoid valve) and a mechanical valve, which can stabilize the main pressure, and it provides flow for the cooler valve and the B-lube valve via overflow relief. 11

Schematic diagram of the transmission structure of the eight-speed auto transmission (8AT).

Schematic diagram of the hydraulic system.
Modeling of the main valve
The structural model of the main valve is shown in Figure 3, where the spool moves under the action of various forces and the opening of each oil circuit varies accordingly. As the figure shows, the forces that act on the spool include the spring force on the right side, the viscous friction of the spool movement, the pilot chamber pressure P
r
, the hydrodynamic force F
y
, and the feedback pressure P
l
on the left side.
12
Under the effects of the forces above, the spool moves along the valve bore and regulates the opening of the two channels

Schematic diagram of the functional structure of the main pressure regulating valve: (a) Schematic of the 3D model of the main valve and (b) Sketch of the main valve structure.
The differential equation for the spool dynamics is obtained based on the balance of forces that occurs during spool movement as follows:

where M is the mass moving in the housing, and the spool mass, the 1/3 spring mass, and the associated fluid should be included in this mass; B
f
is the viscous friction coefficient; K
r
is the spring stiffness; F
y
is the hydrodynamic force;
The flow relationship for each oil opening can be expressed as follows:

where
The pressure build-up process in the pilot chamber is described by:

where R H is the liquid resistance.
According to the theorem of momentum, the flows q 1 and q 2 will cause the hydrodynamic force F y acting on the spool, which can be expressed 13 as:

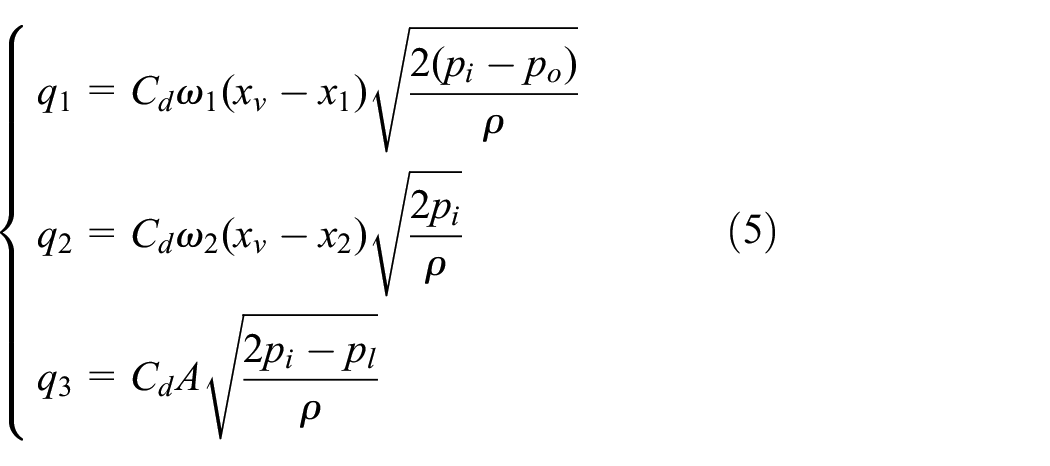
where
By combining equations (4) and (5), the hydrodynamic force F y can be expressed as:

where
The force equation is analyzed for the initial state of the spool and linearized at the state point (

where: the hydrodynamic-pressure gain:
A block diagram of the main valve’s transfer function, as shown in Figure 4, is then drawn based on the mathematical equations above.

Block diagram of the transfer function for the main pressure regulating valve.
Multi-objective optimization of systems
Based on the model presented above, the design of experiments (DOE) experimental planning method was used to analyze the degree of influence of the various design parameters on the system pressure response, and the coupling effects between multiple parameters were determined to respond to their impact on the target. Figure 5 shows the Pareto diagram obtained from this DOE study. The spring stiffness

Pareto diagram for test planning.
The flow rate
A deflector cone and a deflector boss are proposed to improve the effect of the jet angle on the dynamic performance (Figure 6).
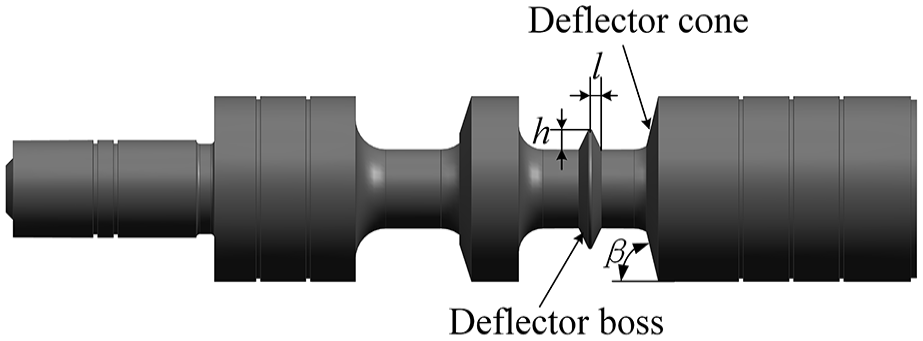
Schematic diagram of the optimized valve spool.
The deflector parameters affect the area gradients and the jet directions of the


Schematic diagram of the optimized valve opening.
Because 2R>>
According to Equation (1), by increasing the spring stiffness, the hydrodynamic force can be compensated, and the spool steady equilibrium position, the response speed, and the overshoot can subsequently be changed. From Equation (4), adjustment of
In summary, the orifice diameter

The dynamic characteristics of the hydraulic control system under a step signal input are selected as the optimization objectives. The overshoot
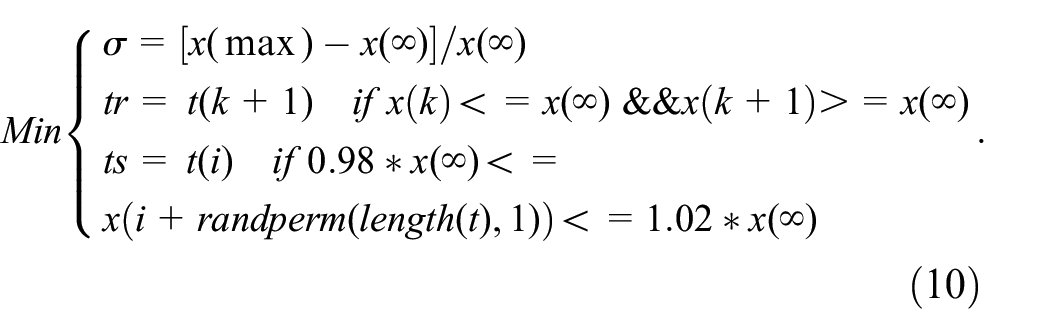
Among the available multi-objective optimization algorithms, NSGA-II is widely used because of advantages that include low computational complexity, fast execution speed, and good solution set convergence. This algorithm ensures convergence of the entire algorithm process by genetically replicating the individuals with the higher dominance ranks. The diversity of the samples is increased by selecting appropriate boundary solutions with higher crowding and sparse solutions. 16 Table 1 lists the main parameters of the multi-objective optimization algorithm.
Parameters of the multi-objective optimization algorithm.

The main steps in the multi-objective evolutionary algorithm are given as follows:
(1) Randomly generate an initial population
(2) Find the main spool response characteristics from the design variables for each individual and solve for the objective function values of
(3) Select, cross, and mutate the initial population to produce a progeny population of equal size, and then merge the parent and progeny populations to form a new population
(4) Perform a fast nondominant ordering of all individuals in the new population and then calculate the degree of crowding for individuals in each nondominant stratum. Based on the nondominance relationship and the degree of crowding of the individuals, select the appropriate individuals to form the new parent population
(5) Generate a new progeny population using the basic operations of the genetic algorithm and repeat the steps above until all iterations are completed or accurate convergence is achieved.
In multi-objective optimization, the objectives are often mutually constrained, and pure single-objective optimality cannot be pursued. In addition, it is difficult to compare the advantages and disadvantages of solutions that have been optimized using a single objective; these solutions are known as Pareto optimal solution sets 17 and their constituent Pareto frontiers are shown in Figure 8.

Pareto frontiers based on NSGA-II.
Under the condition that the other structural parameters remain unchanged after optimization, the selected structural parameters will vary uniformly within the set upper and lower limits. The results obtained show that any parameter change will have a significant effect on the dynamic characteristics of the spool motion, and this effect is often in opposition to the response speed and oscillation characteristics. Figure 9 provides a visualization of the influence of each parameter on the overshoot and the rise time of the target value. With increasing spring stiffness K, the rise time decreases almost linearly, but the overshoot also increases almost linearly. When multiple design parameters vary together, the changes in the dynamic characteristics will become more difficult to analyze, and thus it is necessary to use a multi-objective optimization algorithm to perform the analysis in this study.
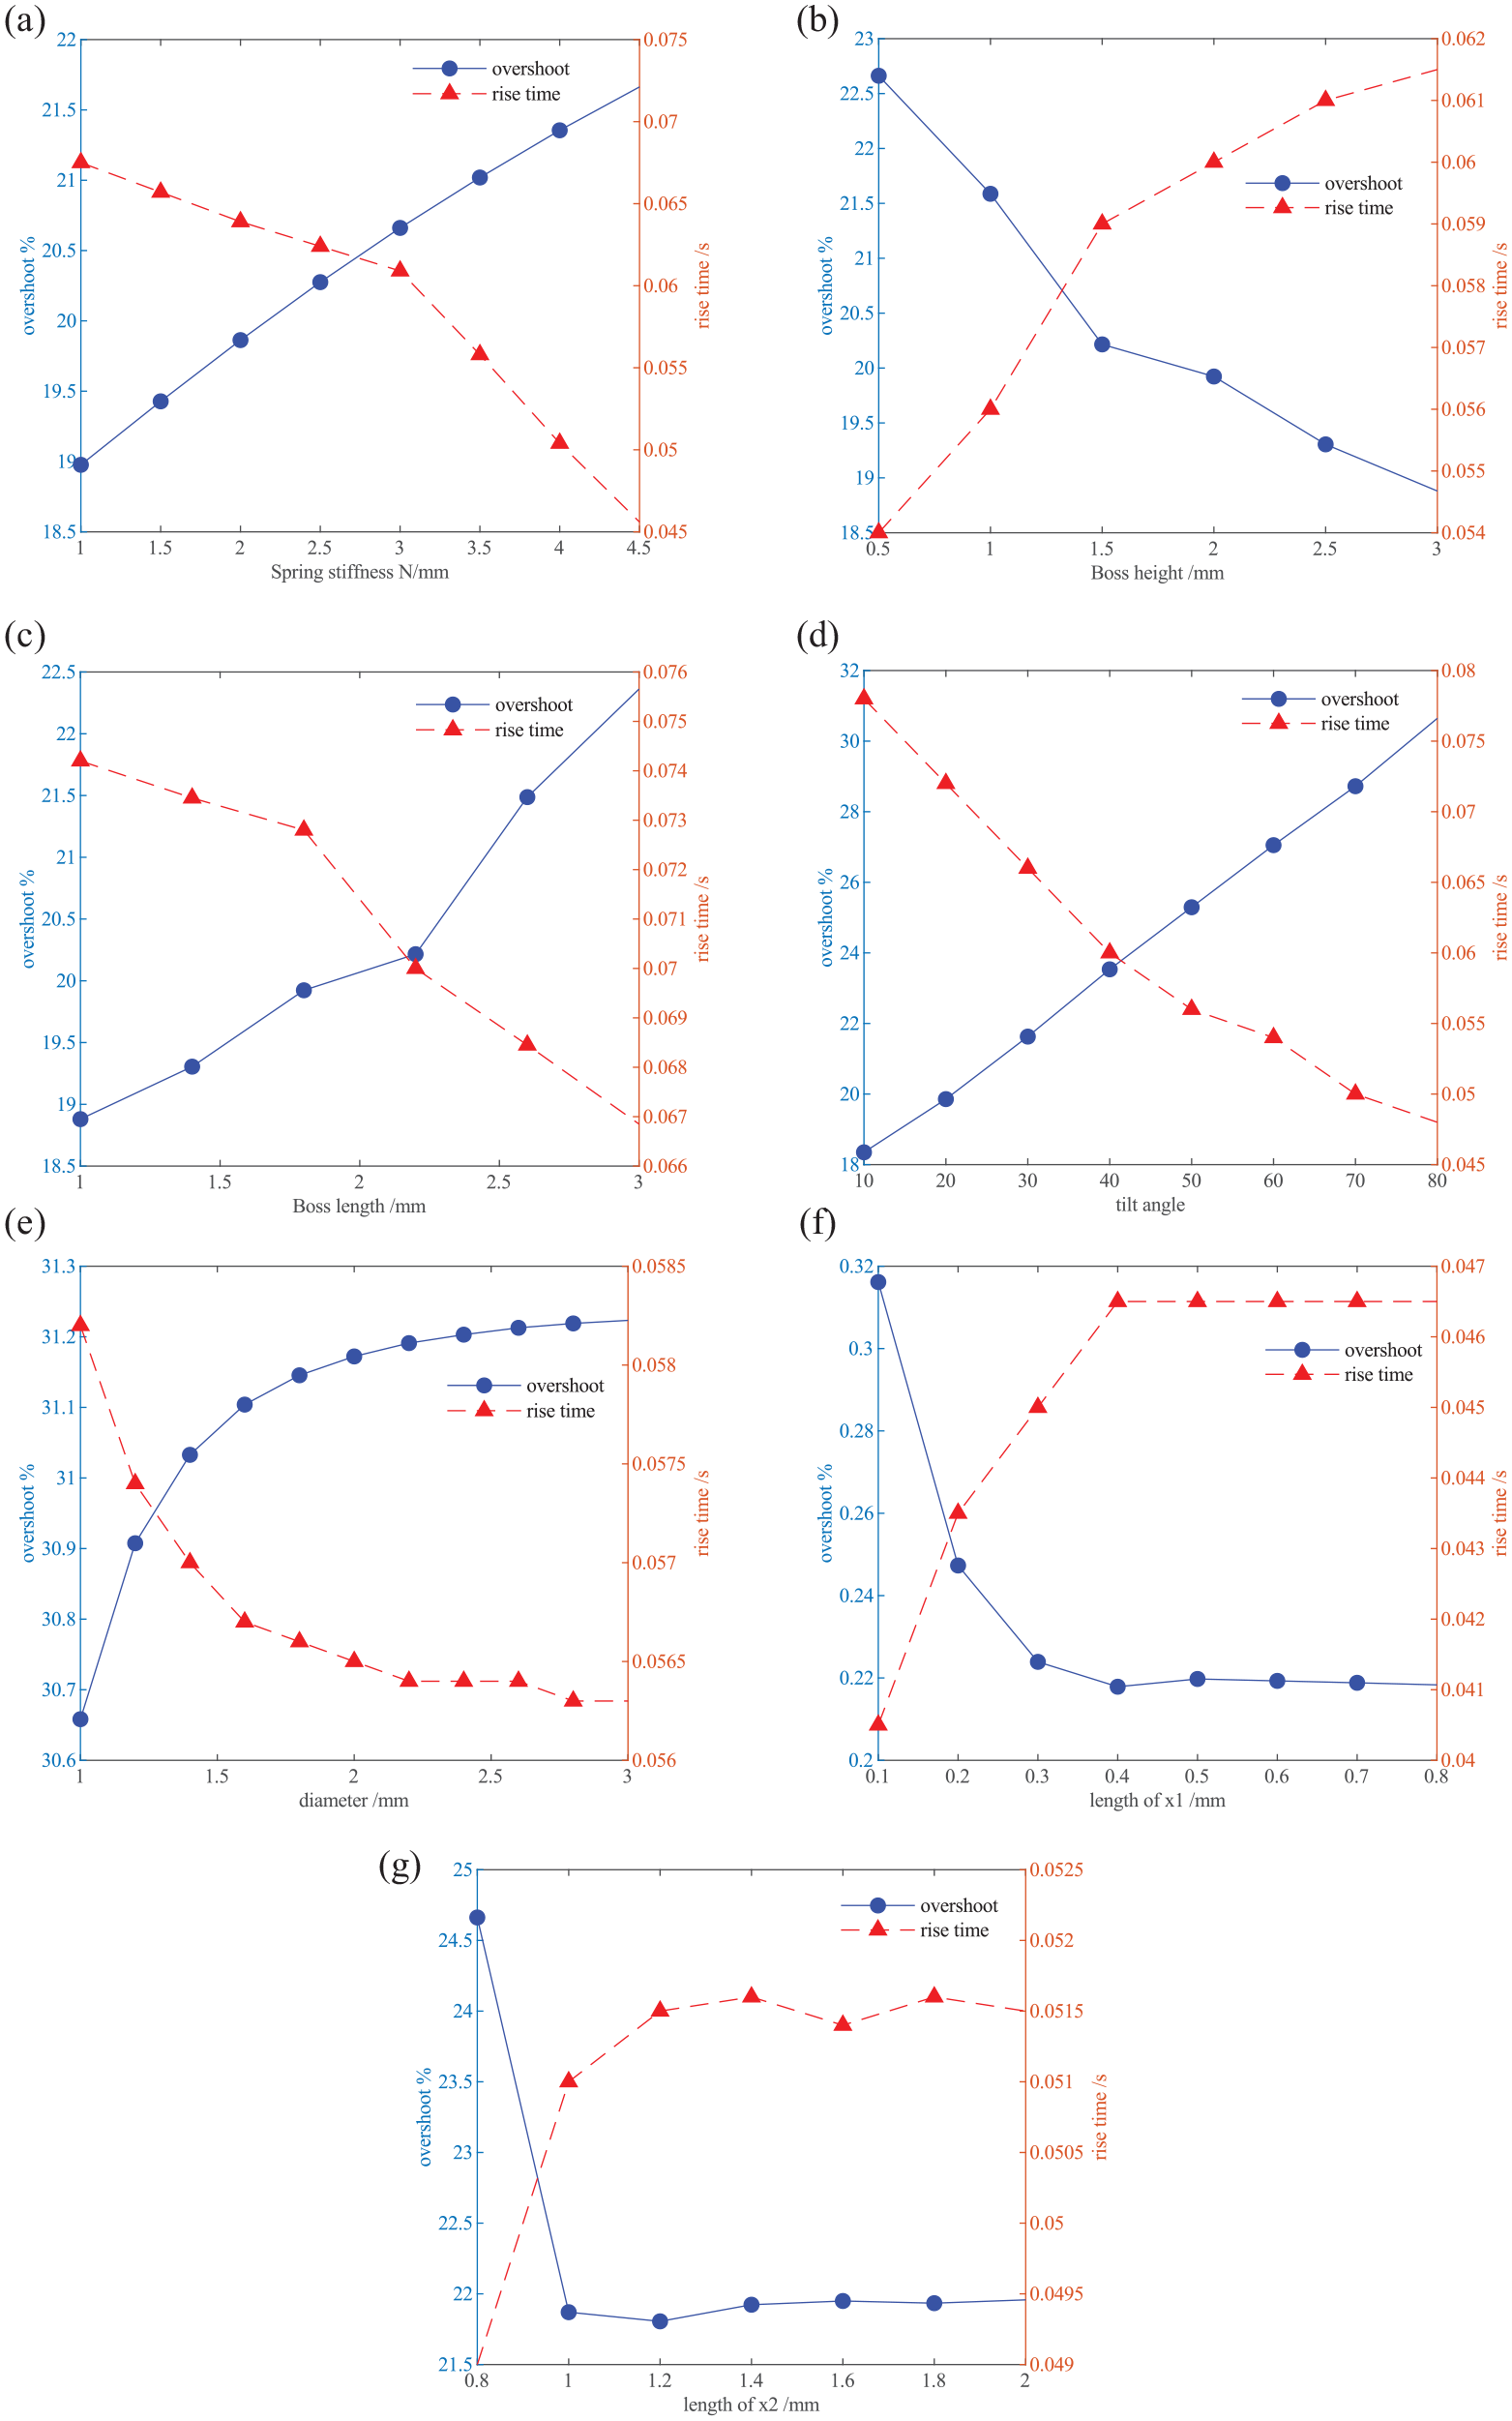
Effects of the system design parameters on the dynamic characteristic indicators.
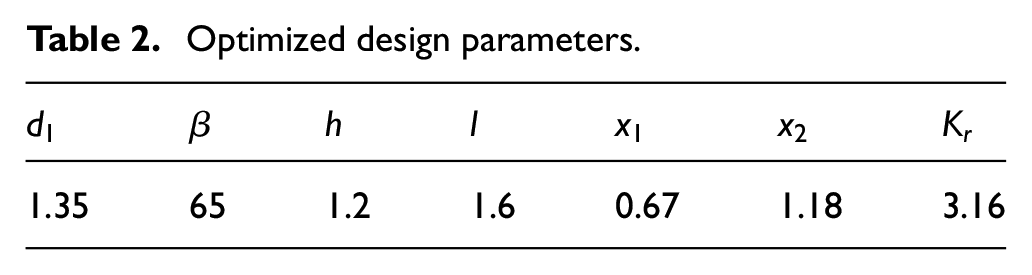
According to the analysis results, and when the manufacturing process feasibility is taken into account, the design scheme with the smaller overshoot, adjustment time, and rise time ranges in Figure 8 is selected, and the structural parameters of the optimized spool are listed in Table 2.
Optimized design parameters.
When the pilot current step input (0–850 mA) begins at 0.1 s, the pressure response is as shown in Figure 10. The pre-optimization peak pressure is 30 bar and the post-optimization peak pressure is 26.1 bar, where this reduction in pressure is due to a reduction in the steady-state hydrodynamic force and an increase in the spring stiffness, which results in an 18% pressure reduction for the same pilot current. Although the spool equilibrium point is changed, the pressure control range is satisfied, and thus the equilibrium point change is acceptable; in addition, the rise time is reduced by 0.08 s when compared with the post-optimization period, which obviously improves the system’s response characteristics.

Responses of valve before and after optimization.
Verification of optimized effect via CFD simulation
To provide further verification of the optimization effect of the deflector structure and to analyze the flow velocity and pressure change characteristics in the main valve before and after optimization, the fluid domain is extracted based on the three-dimensional model of the inlet and outlet of the liquid flow in the main regulator system and the main regulator valve, and the mesh division is conducted as shown in Figure 11. We define the oil density as 895 kg/m3 and the viscosity as 0.02 Pa·s, and we use the k-ε turbulence model to perform steady-state simulation of the flow field model. We set the inlet form as the pressure inlet and the outlet as the pressure outlet.

Mesh division of the fluid domain inside the valve.
With an inlet pressure of 22 bar and a port opening size of 2 mm, the distribution of the velocity trajectories in the valve internal field before and after optimization is shown in Figure 12. The results show that adjustment of the deflector structure improves the velocity distribution within the valve field, and that the deflector cone obviously changes the jet angle, which in turn reduces the steady-state flow force acting on the valve spool.

Velocity cloud maps of the flow field before and after optimization.
As shown in Figure 13, the pressure distributions in the valve field before and after optimization are more obvious at the flow-guiding boss and the flow-guiding cone in the P-A channel. The pressure drop generated by the deflector cone and the deflector platform guides the fluid flow direction within the valve and improves the pressure distribution and the fluid flow state in the valve’s internal field.

Pressure maps of the flow field before and after optimization.
The variations in the hydrodynamic forces acting on the spool when the spool is opening before and after optimization are shown in Figure 14. By combining Figures 3 and 14, we see that the hydrodynamic force increases as the sliding spool moves toward the right of the valve and that the P-A orifice size increases at constant differential pressure; there is a significant reduction in the steady-state hydrodynamic force after optimization when compared with that in the pre-optimization period. This result is consistent with the results obtained by reducing the velocity component of the fluid within the valve in the axial direction.

Flow forces acting on the spool before and optimization.
Test Verification
To verify the effects of parameter optimization, testing was conducted on the oil circuit controlled by the main valve. The test bench structure is shown in Figure 15. One pump supplies oil to the circuit, one ECU is equipped to control the solenoid valve current, and pressure and flow signal acquisition devices are also included.

Schematic diagram of the test bench.
In Figure 16, a comparison is made between the characteristics of the oil circuits controlled by the main valve before and after optimization, and the results show that the optimized curve demonstrates significant improvements in terms of overshoot, fluctuation, and response time.

Performance comparison of oil circuits before and after parameter optimization.
In Figure 17, the responses of the optimized oil circuit to step currents at different heights are shown. The pressure response remains stable and the overshoots are all less than 7%.
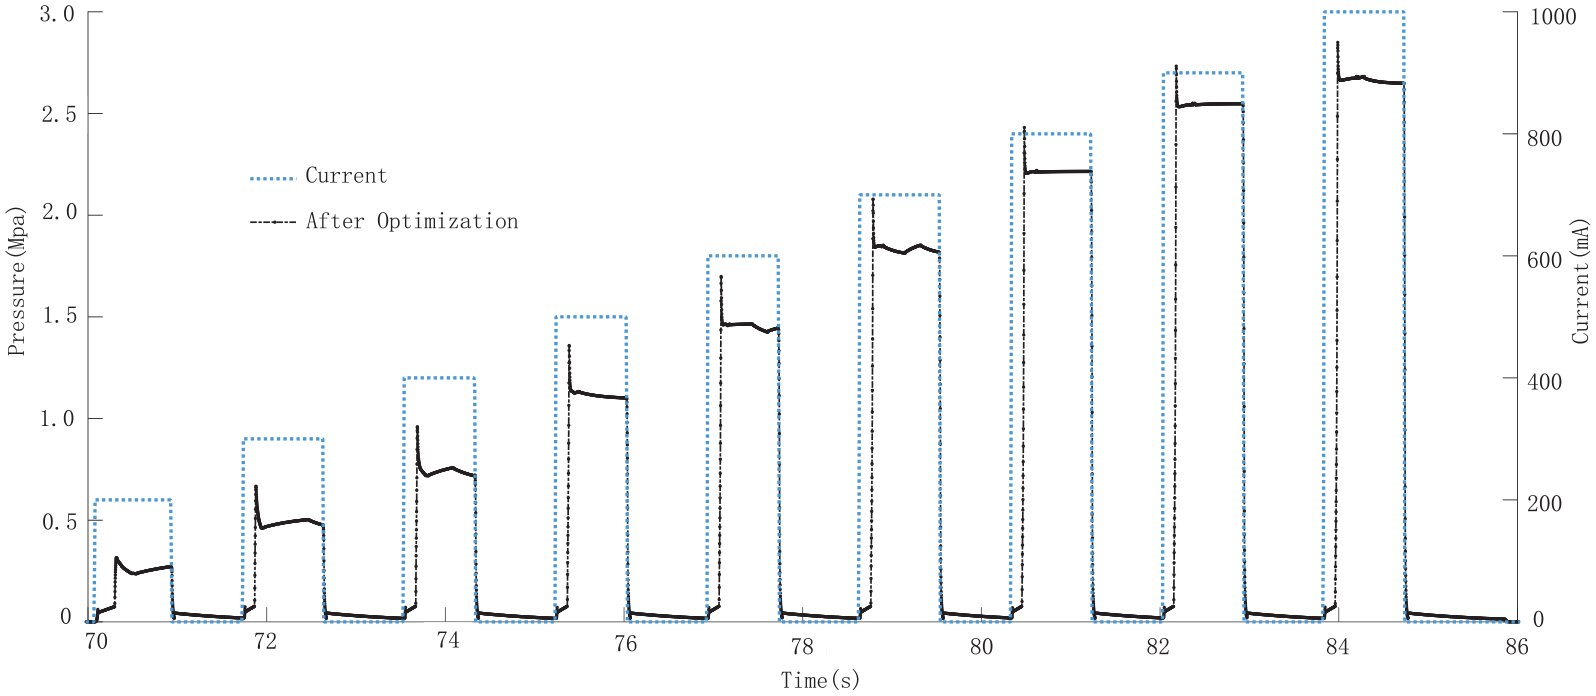
Performance of main valve on test bench.
Conclusion
In this article, a force analysis was conducted on the proportional control unit of the main oil circuit in an 8AT hydraulic system, and corresponding measures were proposed based on simulation calculations that effectively improved the response characteristics of the system. The results of modeling simulations and CFD analysis both indicate that changing the jet angles of the deflector cone and the deflector boss can reduce the hydrodynamic force effectively. After the improvement, the hydrodynamic force can be reduced by 24% when the valve spool displacement is 2 mm. The reduced hydrodynamic force can in turn reduce the opening force of the valve port and improve the precision of the valve. Furthermore, with regard to the spring stiffness
Footnotes
Handling Editor: Nicolae-Doru Stanescu
Declaration of conflicting interests
The author(s) declared no potential conflicts of interest with respect to the research, authorship, and/or publication of this article.
Funding
The author(s) disclosed receipt of the following financial support for the research, authorship, and/or publication of this article: The authors express their sincere thanks for the support from the National Natural Science Foundation of China (No. 51905164); and the Scientific Research Project of Hunan Provincial Department of Education (No. 21A0298).