
Abstract
Urban transportation systems, such as Metro de Medellín’s aerial cableways, play a key role in improving city connectivity. This study presents a Finite Element Analysis (FEA) of critical mechanical components that connect cable cars to ropeways, specifically focusing on the Connection and Suspension assembly, referred to as the J-H assembly. The primary aim was to identify potential operational vulnerabilities. The analysis follows the BS EN 13796-1:2017 standard, which provides design guidelines for cable car structural components, and evaluates cases 8, 9 and 10 as benchmarks. FEA results indicate safety factors ranging from 1.62 to 2.24, with case 9 exhibiting a 31.3% deviation from the standard’s reference values. Stress concentrations were consistently found at the J-H assembly connection across all cases.
Introduction
In recent decades, urban planners have been exploring about how to attend the necessities of people and how to improve urban traffic; for this reason, they have considered the implementation of non-traditional modes of transportation, one of which can be the aerial cable systems. 1 This mode of transportation employs cabins and suspended cables, which can transport passengers along distances within cities. 2 They are increasingly used in various cities around the world for purposes ranging from tourism to enhancing connectivity between different areas. Over the years, their usage has been increasing for their benefits over other means of transport; this trend is particularly prominent in Latin America, where the geographical contexts can make road access difficult or non-existent. These systems are usually electrically powered 1 and offer the advantage of reducing travel time within cities. 3
Metro de Medellín 4 is a public company in the city of Medellín that began operating in 1979. Its primary mission is to construct, operate and manage mass transportation systems, thereby supporting development and enhancing the quality of life for residents in the Valle de Aburrá region. The transportation network comprises 76 stations, including 27 train stations, 12 cable stations, 9 tramway stations (6 of which are stops) and 28 bus rapid transit stations (spanning lines 1 and 2, with 8 stops). The aerial cable transport systems are the current focus, with Line K being the oldest and capable of accommodating 46,000 passengers daily. As demand for these systems continues to rise, exploring alternative manufacturing options to ensure operational efficiency becomes increasingly important. In this context, innovative methodologies, such as those described in the study ‘Topology Optimization for Cold Plate Using Neural Networks as Proxy Models’, can provide significant insights. 5
Literature for finite element analysis focusing on cable cart systems has been scarce. However, through bibliographic research, a few publications have been found. For instance, Brownjohn 6 presents a mathematical simulation of a passenger cable car system. Villarreal et al. 7 executed an engineering design of an aerial cable system for 10 people, on it they included several information according to load combinations, for the verification of the calculations different simulations were executed. Other authors such as Bednarz et al. 8 present fatigue testing of cableway gondolas compared with standard EN 13796-3, the work considered several factors, for example, the number of people, materials, working conditions, safety regulations, dynamics load, amongst other terms involved in the normal functioning of the aerial cableway system. Other publications centred on the aerial ropeways, Bryja and Knawa 9 show a computational model and a numerical method for analysing nonlinear cable-car interaction. Petrova et al. 10 undertook modelling and simulation of ropeways under wind loads, with calculations adjusted for varying wind forces over time in different sections of the ropeway.
Other articles about the Aerial cable cart of Medellín were also identified, each offering unique insights. Estepa et al. 11 focused on determining the operational conditions in the aerial ropeways, the study includes a finite element analysis model development. Additionally, Flesser and Friedrich 12 provided a review of aerial cable systems, including the cable cart of Medellín.
The study utilises Finite Element Analysis (FEA) through Autodesk® Inventor®, focusing on critical parameters such as tensile strength, safety factor and displacement. Unlike prior research, which may not have consistently adhered to industry standards, this work offers a novel approach by strictly aligning all calculations with the applicable British Standards Institution (BSI) guidelines. This ensures that the analysis is comprehensive, relevant to practical applications and enhances the reliability and applicability of the results within industrial settings.
Furthermore, the study applies specific loading conditions in conjunction with these standards to effectively characterise the system, ensuring conformity across all evaluations. It should be noted that the study focuses on static verifications, as established by the (BSI) guidelines. This approach generates robust data that can support potential import substitution, contingent upon substantiated justifications for material replacement, and ensures that any proposed alternatives comply with established performance criteria.
Proposed work
The current fastening system used for attaching gondolas, or cabins, to aerial ropes in cable systems relies on components known as Connection and Suspension, informally referred to as J and H Beams due to their structural resemblance to these letters (see Figure 1). These components are crucial for the safety and stability of the cable system, yet they are currently imported from France to Colombia and manufactured by the company Pomagalski. This reliance on imported components raises concerns regarding cost, supply chain stability and the potential for delays in maintenance or system expansion.

J-H assembly.
This investigation addresses these concerns by assessing the structural performance of the H-Beam and J-Beam components through finite element simulations under various loading scenarios. The study will examine the chemical composition, mechanical properties and dimensional characteristics of the materials used in these components.
Material
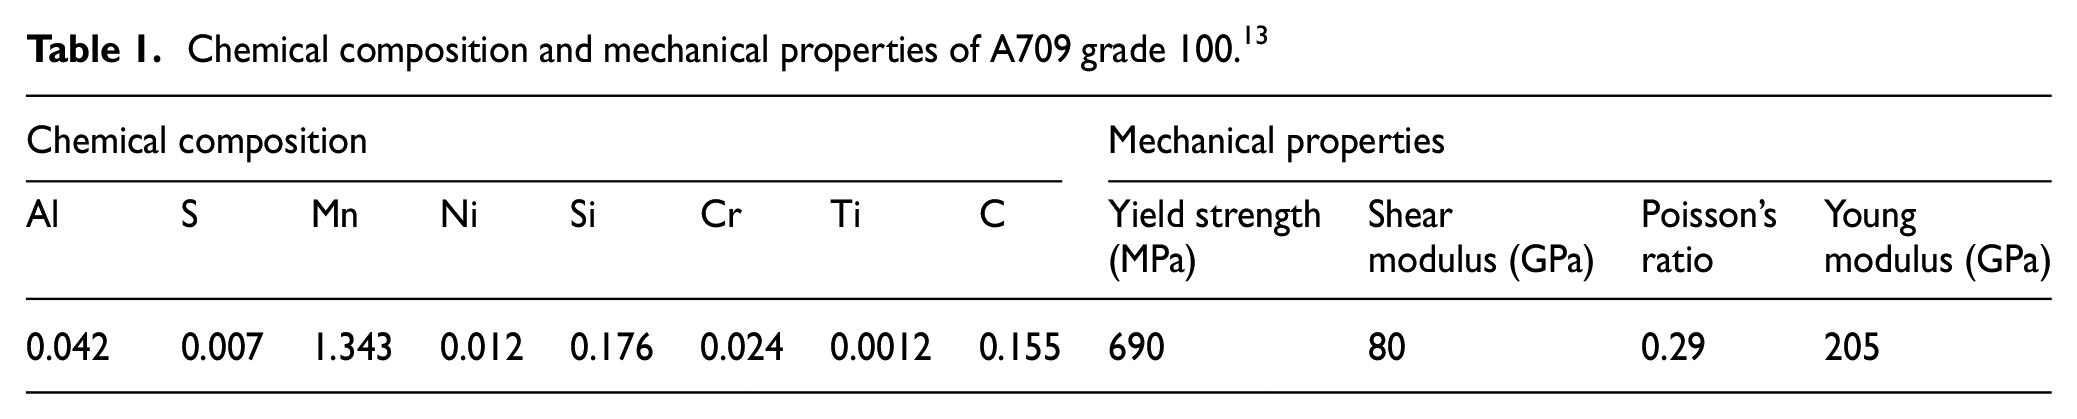
The material used for the J-H assembly was ASTM A709 grade 100 (S690QL according to standard EN 100256). Table 1 shows the chemical composition and mechanical properties.
Chemical composition and mechanical properties of A709 grade 100. 13
Dimensions
The dimensions of both the H-Beam and J-Beam components are illustrated in Figure 2(a) and (b), respectively. Figure 2(a) provides a detailed sketch and 3D representation of the H-Beam, highlighting its overall structure, including key features such as height, base width and other relevant dimensions. Figure 2(b) displays the J-Beam, offering a similar technical drawing and 3D view. It outlines the component’s overall size, including key elements like the width and length. Both figures provide a clear overview of the geometry and dimensions, ensuring accurate understanding for further application.

(a) Dimensions J-Beam (mm) and (b) dimensions H-Beam (mm).
Methodology
The finite element analysis incorporated forces and parameters in accordance with BS EN 13796-1:2017 standard, 14 which is used by the manufacturer to design aerial system cabins. This standard provided comprehensive guidelines for the design of structural components in cable car systems, outlining various study cases and conditions. Specifically, in the design of the suspension and fastening system components, the standard includes three distinct study cases within the mechanical design analysis. To adhere to these specifications, an evaluation of different force states was conducted using Autodesk® Inventor® software. Figure 2 illustrates the fastening system subjected to stress analysis in a simulation environment; furthermore, the analysis included a mesh convergence to ensure the accuracy of the results. The most important parameters for understanding the impact of various forces on the system are detailed below.
Study cases according to the standard
The standard Safety requirements for cableway installations designed to carry persons – Carriers – Part 1: Grips, carrier trucks, onboard brakes, cabins, chairs, carriages, maintenance carriers (BS EN 13796-1:2017), 14 outlines various static study cases, each including load cases specifically tailored to the system under analysis. This document focuses on suspensions for carriers equipped with detachable grips, resembling the configuration used in the Metro de Medellín cabins. This configuration allows for the detachment of the fastening system from the cable, providing operational flexibility.
In alignment with the standard, the evaluation of each load case includes safety factors of 1.6, 2 and 3, as outlined in Table 2. It should be highlighted that Case 8 refers to the moment when the cabin is in the line and station, Case 9 refers to the cabin being on the line and Case 10 represents the moment when the carrier enters the station. These safety factors represent different force conditions on the system, comprehensively assessing its performance across diverse operational scenarios.
Cases and safety factors according to standard: suspension for carriers with detachable grips. 14

The forces of load cases are described below, support calculations are attached to each definition of force used. Additionally, Figure 3 shows the loads for cases 8, 9 and 10; it is important to mention that the loads applied to the fastening system were enacted by a condition of external force. This option allows the application forces at a specific distance from a reference coordinate point. The point where these forces were applied follows the cabin dimensions and where these loads be if the simulation included an attached cabin.

Graphical description of static loading cases analysed based on BS EN 13796-1:2017. 14
Forces described
The section describes each force presented for load cases 8, 9 and 10. It includes self-weight, useful load, wind action, damping moment and reaction force when entering the station.
Self-weight
The self-weight of the system includes the combined weight of the J-Beam, H-Beam and the cabin. The total weight of the cabin and suspension system is 1500 kg (14,715 N). Using CAD models and material properties, the weight of each individual component was approximated, resulting in values of 657 N for the J-Beam, 749 N for the H-Beam and 13,309 N for the cabin.
After calculating the weight of each component, the weights of the J-Beam and H-Beam were applied at the centre of mass of the attachment system, specifically at the connection shaft where the components intersect to each other. The cabin’s weight was used at its centroid as a remote force, ensuring an accurate representation of the load distribution in the model.
Useful load
In accordance with BS EN 13796-1:2017, the average weight of each passenger is assumed to be 80 kg, which equates to a force of 784.8 N when considering gravitational acceleration. For a cabin designed to carry a maximum of 10 passengers, the total useful load is calculated based on this assumption. With each passenger contributing 784.8 N, the total load capacity amounts to 800 kg, resulting in a combined force of 7848 N acting on the system. This load value is critical for ensuring that the structural components and safety systems are adequately designed to meet the operational and safety requirements specified by the standard.
Wind action
For the wind force analysis, the cabin was treated as a cube with dimensions of width, length and height of 1880, 2060 and 2563 mm, respectively. By analysing it as a flat plate, and considering its aerodynamic characteristics, a more conservative assessment was obtained due to the higher drag coefficient compared to other shapes, such as a sphere.
15
These dimensions correspond to the maximum possible for the cabin, including side rounding, for the most critical scenario possible, as explained before; thus, the

Where:

Where:
For wind speed, an average of historical wind records was taken in Valle de Aburrá, Antioquia, Colombia, where 16.5 m/s was the maximum recorded.
16
Additionally, the velocity of the aerial cable system was considered, resulting in a total velocity of 21.5 m/s. Therefore, the wind force used was:
Damping moment
According to the standard BS EN 13796-1:2017,
14
for case studies, the damping moments
Using equation (3) and considering that the payload capacity of the cabin is 10 people, the moment resulted in 1000 Nm.

Reaction force when entering the station
The station entry reaction force is a deceleration force suffered by the cabin when entering the station; by the standard, 14 the cabin goes from 6 to 0.5 m/s when it enters the station. The deceleration time was measured, obtaining a time differential of 5.24 s. Furthermore, the mass of the air cable system is 1500 kg. Using equation (4), the reaction force when entering the station is 1574.4 N.

Simulation parameters
The software used for simulating the system suspension was Autodesk® Inventor®. The study utilised a static stress analysis for each load case. The parameters such as restrictions and contacts are explained below.
Element type:
Tetrahedral element meshing was employed for the simulation as it better represents the individual structural components, as presented in Figure 4. This approach was chosen because the real components were manufactured using methods such as extrusion and bending. The generated mesh consisted of 257,745 nodes and 134,881 elements.
Restrictions:
A bushing for the upper flange, a component of the J-Beam that is attached to the drive cable and is shown in Figure 5(a), it was modelled to approximate the clamped system to the drive cable of the actual suspension system. The component was constrained and fixed on its two outer faces (see Figure 5(b)) and assembled on the inner geometry of the upper flange. This approach allowed for focused attention on the most crucial scenario, wherein the upper flange is securely affixed to the drive cable.
Contacts:
Bonded contacts were used for all contacts between the different components. This approach restricts the free movement of the components, and the simulation is less prone to generate singularities, improving simulation convergence. 17 Additionally, to simulate the damping spring, a spring contact was used, Figure 5(c) and (d), with a stiffness constant of 56.98 N/mm calculated from the initial and final deformation of the spring for each of the couplings at the ears of H-Beam and the suspension steps of J-Beam.

Mesh generated.

(a) Clamping system of the actual cabin, (b) upper flange restriction, (c) damping spring contact simulated and (d) damping spring.
Result analysis
The results for each load case were presented, detailing the Von Mises stress, safety factor and displacements of the J-Beam to H-Beam assembly. The simulations were performed using tetrahedral 10-node elements, providing accurate stress distribution and displacement predictions for the assembly under various loading conditions.
Mesh convergence
The mesh convergence, or convergence rate, refers to the speed at which a numerical method approaches its solution as iterations increase. A higher convergence rate indicates faster error reduction, resulting in more efficient and accurate outcomes in computational simulations. For each simulated case, the mesh convergence was thoroughly analysed to ensure the accuracy of the results. This process was required for refining the mesh until the numerical analysis becomes sufficiently precise to approximate the exact solution, even if the exact solution is unknown. 18
To carry out this analysis, it is necessary to choose a parameter to assess its convergence; since the Von Mises stress is of great interest in engineering application and analysis; 19 it was chosen for Cases 8, 9 and 10 to create the mesh convergence. Figure 6(a) to (c), show the graphic for converge mesh of each case.

Mesh convergence: (a) Case 8, (b) Case 9 and (c) Case 10.
Other parameters for mesh refinement included a maximum number of h refinements (to reduce the element size), stop criteria and h refinement threshold. The maximum number of h refinements was set at 10, the stop criteria selected was 3% and 0.750 h refinement threshold were used. These values were set with the criteria of reaching the 3% stop criteria; in that way, the other values, the number of refinements and refinement threshold, allowed the number of simulations needed to reach those stop criteria. According to the mesh convergence results, parameters were successfully fulfilled for each case in which case 7 showed a similitude between h refinements of 0.386% and case 9, the most dissimilar h refinements result, a convergence rate of 2.567%, all of them under stop criteria of 3%.
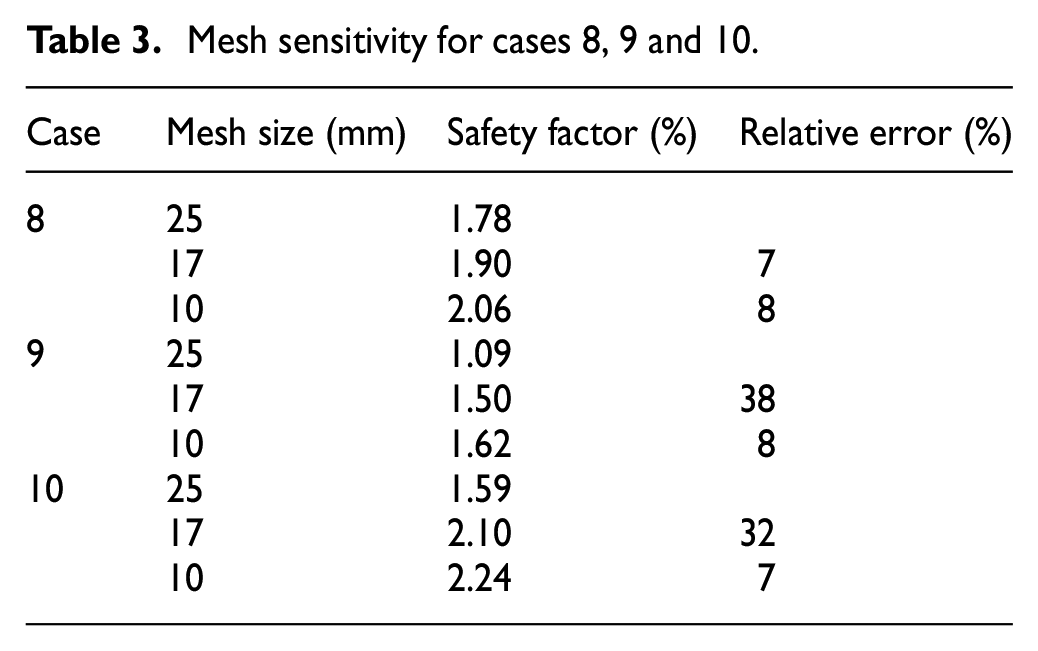
In addition to convergence analysis, a mesh sensitivity study was performed to minimise the error due to the numerical analysis made by the software. The safety factor was used as the convergence criterion for each case outlined earlier. Table 3 presents the results of the mesh sensitivity analysis conducted at the connection between the J-Beam and H-Beam, showing the relative error compared to the previous iteration. A stopping criterion was applied when the relative error fell below 10%, leading to a final mesh size of 10 mm.
Mesh sensitivity for cases 8, 9 and 10.
Von Mises stress
To ensure consistency and facilitate comparison, a single Von Mises stress scale with a maximum value of 308.2 MPa was applied across all cases (Figure 7). In case 8, the J-Beam experiences the highest stress levels, particularly in its upper regions, where values reach up to 308 MPa. The lower regions of the J-Beam and the base of the H-Beam show moderate stresses, ranging between 100 and 150 MPa, highlighting that the J-Beam bears a significant portion of the load. This case demonstrates the maximum stress concentrations across the structure, especially in the upper J-Beam.

Von Mises stress (MPa) according to Cases 8, 9 and 10.
In case 9, which represents the static condition, stress levels decrease significantly compared to case 8. The J-Beam exhibits stresses mostly below 150 MPa, with the upper sections showing values around 100 MPa, in contrast to the higher stress seen in the previous case. Similarly, the H-Beam also shows minimal stress concentration, with levels below 100 MPa in most regions. This case highlights the reduced structural strain under static conditions.
In case 10, stress levels become more evenly distributed between the J-Beam and H-Beam. The H-Beam shows increased stress concentrations, particularly near its connection to the J-Beam, where stress values range between 100 and 150 MPa. Meanwhile, the J-Beam exhibits moderate stress, with values remaining lower than those observed in case 8. The stress distribution in this case suggests a more balanced load transfer between the components under the applied load.
Comparing the three cases, the connection point between the J-Beam and H-Beam consistently exhibits moderate to high-stress concentrations, with the highest values observed in case 8 and more balanced stress in case 10. This critical area demands careful consideration in material selection to ensure it can withstand the observed stress levels. The stress variations across zones and cases provide valuable insights for optimising the structural design, particularly regarding load distribution and the selection of materials that can effectively manage these varying stress conditions.
Safety factor
Safety factor (SF) values are illustrated in Figure 8, revealing values of 2.06, 1.62 and 2.24 for cases 8, 9 and 10, respectively, showing the lowest safety factor for case 9. Each SF result was compared with the values outlined by the Standard 14 : 2, 3 and 1.6, respectively. It should be noted that the material selection is directly tied to these results, for this reason, the colour gradients correspond with the results of Von Mises Stress. To meet the standard’s requirements, the material must have mechanical properties that allow it to withstand the specified load cases, ensuring operational functionality under all necessary conditions.

Safety factor for cases: (a) 8, (b) 9 and, (c) 10.
SF simulated results for cases 8 and 10 fall under the standard (see Table 2), unlike case 9 (Figure 8(b)) where the difference is significant. This discrepancy may be attributed to the fact that case 9 represents the most frequent operational scenario, an online suspension system, while case 8 occurs when the carrier is into the station and, case 10 to the entry to the station only. With this in mind, the standard likely prescribes a higher safety factor for case 9 to ensure the system’s long-term operational stability and reliability since the component operates under these specific conditions more regularly, due to, this case occurs when the carriers along the line.
An aspect of interest is the location of the maximum values observed in the results obtained via simulation where the minimum SF is located at the connection between the H and J-Beams, this aspect is significant when considering that in its system the simulated SF values are around 6 for all the analysed cases and, locations in the assembly.
Displacements
Displacement analysis allows the observation of discontinuities or incompatibilities that suggest a correct or incorrect coupling of components mesh; also, this indicates that no restrictions will be generated by interference between the pieces. Figure 9 shows the results of displacement analysis of suspension system components of the respective simulation. It can be concluded that simulated cases showed continuity in the colour variation, indicating a correct mesh coupling between components, and no interferences were generated, assuring mesh convergence. Finally, the maximum displacements are generated at the ends of the H-Beam, with values between 22.5 and 42.5 mm, which are associated with the drift generated by the cabin.
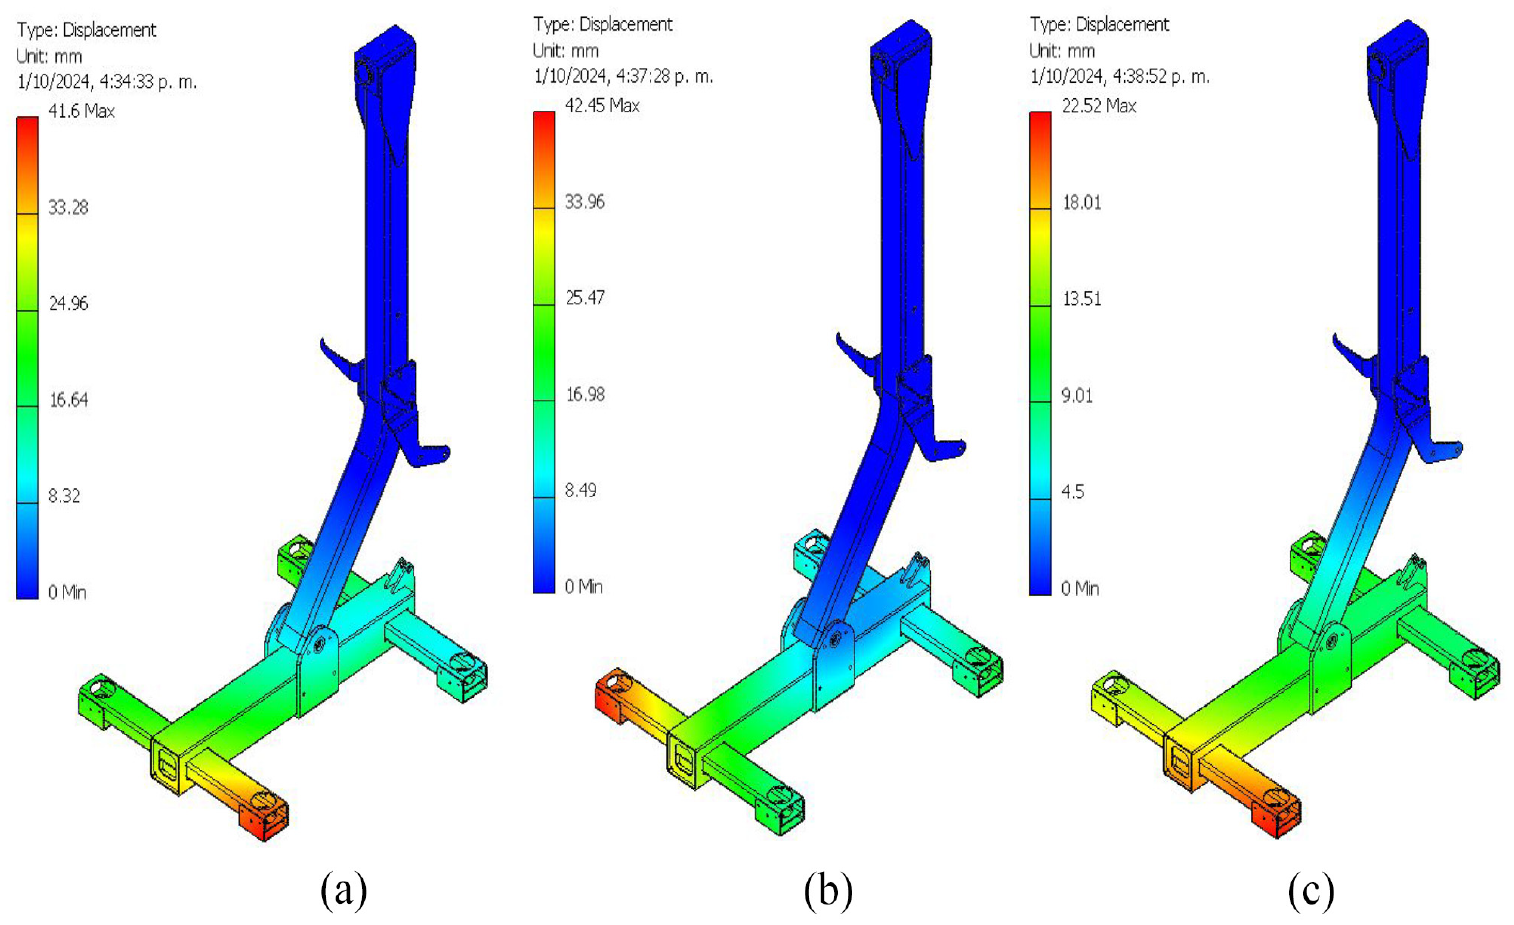
Displacements for cases: (a) 8, (b) 9 and (c) 10.
Correspondingly, the upper flange bush, which is fixed by constraint, interferes with the development of system suspension behaviour by the displacement response to each case. This can be seen in developing a colour gradient that goes from a 0 mm displacement near to upper flange (blue colour) from 22.52 to 45.45 mm in the H-Beam front (red colour).
Exploratory cases
To increase the overall tensile strength of the J-H assembly and evaluate simulated safety factors, the base material of both components was replaced with S960QL, a hot-rolled structural steel categorised above the previously used material in the relevant standard. This steel achieves its maximum tensile strength through quenching and tempering. The mechanical properties of S960QL are provided in Table 4.
Mechanical properties of S960 QL. 20
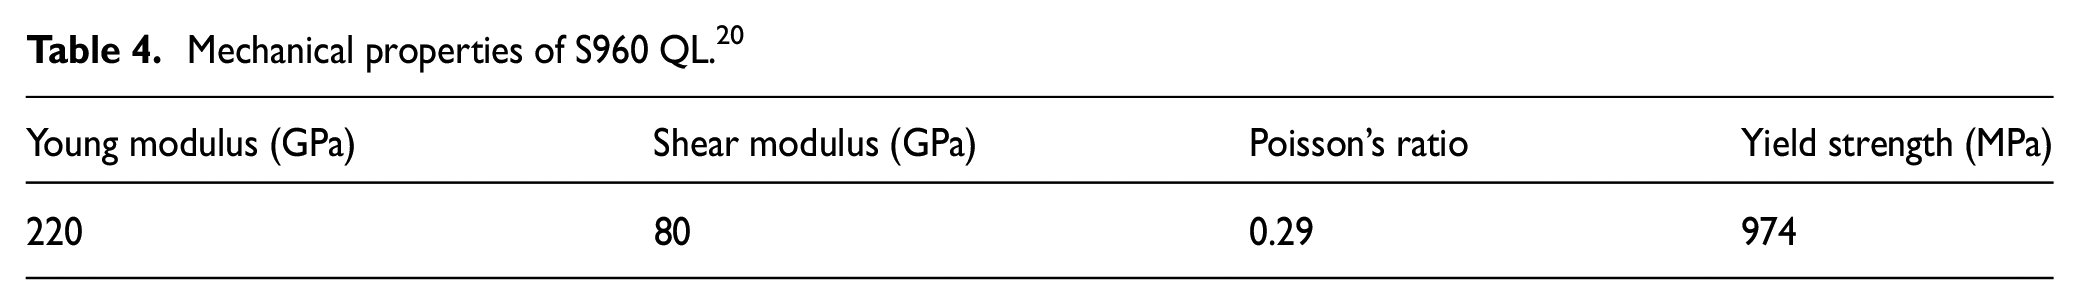
Figure 10 presents the safety factor (SF) simulated results for assembly using S960QL steel for all three cases. When compared to the results shown in Figure 6, for ASTM A709 grade 100 (S690QL), improvements are evident across all cases. An interesting aspect of this analysis is that case 9 minimum SF remains below the value established by the standard of 3, with an SF of 2.7. While the majority of the structure exhibits a safety factor close to 15, the area with the lowest SF is the connection between the J-Beam and H-Beam, which warrants further attention.

Safety factor using S960QL for cases: (a) 8, (b) 9 and (c) 10.
The results obtained for the analysed case did not meet the required safety factor, despite the material change and a significant increase in mechanical strength of approximately 30%. Although the standard mandates a safety factor (SF) of 3 for this load condition, most of the structure exceeded an SF of 6. However, a small region showed a safety factor as low as 2.7, which can be attributed to the geometry of the components. This region is a connection point in the assembly where, due to the interpolation performed by the simulation software, issues arise when resolving the interaction between the two connected components. 21 This limitation in the simulation process likely contributed to the discrepancy in safety factor values in this localised area.
Conclusions
Aerial cable systems play an important role in supplying the necessities of people and enhancing urban traffic betterment connecting different zones of the cities and ensuring safe passenger transit, as seen in Metro de Medellín’s operations. Standards such as BS EN 13796-1:2017 outline the safety regulations for cableway installations, ensuring compliance with safety standards. This study conducted finite element analysis in Medellín, Colombia to evaluate safety factors, displacements and strength. The analysis revealed differences between simulation results and standard specifications.
The present study reveals several differences in the results of simulations conducted to evaluate safety factors in comparison to the information presented in the Standard. Specifically, the safety factors obtained in the finite element analysis for Cases 8, 9 and 10 were 2.06, 1.62 and 2.24, respectively. Notably, the differences in the results were 2.9 % for Case 8 and 40% for Case 10 above the suggested values from the Standard, which could be considered insignificant. However, the largest difference was observed in Case 9, which has the highest safety factor in the standard (SF of 3) but resulted in a safety factor of 1.62 in the simulation, reflecting a difference of 31.3% below the Standard. Given that Case 9 is the most frequently operated condition, it is reasonable that this was intentionally done to ensure a larger safety factor, intentionally designed for operational stability.
The analysis, using a consistent Von Mises stress scale, highlighted variations in stress distribution across the J-Beam and H-Beam under different loading conditions. Case 8 displayed significant stress concentrations, with values reaching up to 308 MPa in the upper J-Beam, while case 9, representing static conditions, showed reduced stress levels, primarily below 150 MPa. In case 10, stress was more evenly distributed, particularly near the connection between the J-Beam and H-Beam, where stress values ranged from 100 to 150 MPa. The displacements show values of 27.21, 21.99 and 23.17 mm for cases 8, 9 and 10, respectively. The maximum displacements are observed in the H Beam, representing the overall displacements of the combined J-Beam and H-Beam assembly. The obtained results are accomplished with a mesh convergence analysis for each case, all with under a 3% convergence rate. These findings provide valuable insights for designing and fabricating suspension system components, ensuring compliance with safety standards and operational functionality.
Furthermore, an additional case was included in the article using the material S960QL. Despite the material modification and a 30% improvement in mechanical strength, the safety factor for the analysed case did not meet the required value of 3 for certain load conditions. Although most of the structure exhibited a safety factor exceeding 6, a localized region displayed a lower safety factor of 2.7. This variation is likely due to the component geometry at connection points, where the simulation software’s interpolation struggles to accurately resolve interactions between connected parts, contributing to the observed discrepancies in safety factor values.
Footnotes
Handling Editor: Divyam Semwal
Declaration of conflicting interests
The author(s) declared no potential conflicts of interest with respect to the research, authorship, and/or publication of this article.
Funding
The author(s) disclosed receipt of the following financial support for the research, authorship, and/or publication of this article: This research was funded by Universidad EIA in the project called “Development of a manufacturing concept for structural components of the Medellin cable cart system”.