
Abstract
This study integrates the Lagrange method and wavelet analysis to create a comprehensive approach to detect damage in spiral bevel gears within transmission systems. The Lagrange method is employed to accurately model the motion equations of the gears during operation, thereby creating a mathematical model that includes dynamic variables, structural components, and boundary conditions, allowing for the calculation of vibration parameters such as frequency and amplitude. Meanwhile, wavelet analysis is applied to analyze the vibration signals of the gears, helping to detect spatial and temporal variations in the signals and identify signs of damage within the system. The combination of these two methods enables a precise and comprehensive diagnosis of damage problems and prediction of mechanical system vibrations, particularly in complex meshing models. This not only improves efficiency and accuracy in the research and handling of gear-related problems, but also makes significant contributions to the field of mechanical engineering, especially in gear maintenance and damage diagnosis, thereby improving the reliability and lifespan of transmission systems.
Keywords
Introduction
The eccentric gears are essential components in the operating systems of automobiles and industrial machinery.1,2 These gears are circular with consecutively arranged teeth that facilitate rotational movement between intersecting shafts. 3 The teeth are formed on a conical surface, causing the size and module of the teeth to vary along their length, becoming smaller toward the apex of the cone. Straight bevel gears4,5 are notable for their ability to transmit motion between two intersecting shafts at a fixed angle, most commonly 90°, allowing efficient and precise direction changes in mechanical systems. This feature provides flexibility in design and operation, making straight bevel gears indispensable in many industrial6,7 and technical applications.8–10 The distinguishing feature of spiral bevel gears11,12 is their structure and operation, which help reduce vibration and noise compared to straight bevel gears of the same size. This is achieved through a design that minimizes friction and impact between the teeth,13,14 resulting in smoother and quieter power transmission. 15 Consequently, spiral bevel gears are a popular choice in applications requiring high performance and low noise and vibration levels, such as industrial machinery, automobiles, aircraft, and medical devices. Research in the development of damage analysis methods for straight16,17 and spiral bevel gears plays a crucial role in improving the performance and reliability of transmission systems.18,19 Various methods have been proposed to analyze and evaluate damage in bevel gear models, 20 including imaging techniques to observe and analyze the shape and size of teeth, simulation and modeling techniques to predict and assess damage, and kinematic analysis methods to measure and evaluate the performance of transmission systems. The primary goal of these methods 21 is to identify and assess common types of damage such as wear, cracks, and mechanical deformation, providing appropriate repair and maintenance strategies to improve the longevity and performance of transmission systems. Despite significant research efforts, several aspects still require further exploration, such as the impact of environmental factors (temperature and humidity) on the performance and lifespan of bevel gears, and the development of non-contact and non-destructive analysis methods to reduce inspection time and costs. These studies promise significant advances in the early detection and treatment of gear damage, addressing limitations that other methods cannot overcome.
The Lagrange principle is one of the fundamental and most important concepts in classical mechanics,22,23 renowned for its ability to determine the equations of motion for mechanical systems24,25 through a special energy function called the “Lagrangian.” This principle offers a unique and powerful approach to studying the motion of complex systems, where the motion follows an energy-optimizing path in configuration space.26,27 Widely applied in fields ranging from material structure research to the design of mechanical and electronic systems, the Lagrange principle plays a crucial role in solving complex and real-world problems, significantly contributing to the advancement of various scientific and technological domains.28,29 Compared to other methods, the Lagrange method offers numerous advantages, particularly its ability to model and determine the motion of complex systems without being constrained by the diversity and complexity of the acting forces.23,30 This makes the Lagrange method flexible and efficient when working with multidimensional systems or systems with many degrees of freedom. 31 Moreover, in many cases, the Lagrange method can result in less complex equations of motion compared to the Newtonian method, facilitating easier and faster computations and solutions. This method also allows for seamless integration of initial and boundary conditions into the model, creating a complete set of motion equations that satisfy all necessary conditions.32,33 Due to its general nature and applicability to various types of mechanical systems, from simple mechanical systems to complex systems in physics and engineering, the Lagrange method is not only a powerful tool, but also offers superior advantages, from flexibility to time-saving capabilities. The Lagrange method has been widely recognized for its versatility and accuracy in modeling complex mechanical systems, particularly those with multidegree-of-freedom (MDOF) characteristics. Previous research34,35 demonstrated how Lagrange dynamics could be applied to derive precise equations of motion for systems under dynamic loads, making it a valuable tool for vibration analysis. In the context of spiral bevel gears, which involve complex interactions between multiple mechanical components, the use of Lagrange dynamics allows for the accurate modeling of vibrational behaviors and the identification of critical frequencies where damage might occur.
Wavelet analysis is a powerful tool to identify structural damage, with numerous notable advantages due to its high resolution.36,37 This method allows the decomposition of signals into frequency and time components, providing a detailed view of the variations across these two variables,38,39 which helps to separate oscillatory components from noise, 40 making damage detection easier, 41 especially when there are sudden changes in the structure. 42 The ability of wavelet analysis to detect abnormal or irregular variations in signals is highly useful in identifying damage, as these variations are often indicators of serious issues.43,44 Wavelet analysis can be adjusted to meet specific application requirements, including selecting the appropriate wavelet type, fine-tuning the analysis parameters and choosing suitable resolution levels, thus improving the diagnostic and analytical capabilities of the method.45,46 Additionally, this method can be implemented on various hardware and software platforms, from personal computers to mobile devices, making it easy to deploy and apply in different real-world environments. Beyond processing oscillatory signals, wavelet analysis can also be applied to various signal types,47,48 including images, text, and numerical data, 49 opening up numerous application opportunities in different scientific50,51 and technical fields.52,53 In summary, wavelet analysis is a powerful and flexible tool for identifying structural damage, with excellent resolution, the ability to detect sudden changes, flexibility, and ease of deployment, making it an important tool in monitoring and diagnosing the condition of technical structures. Wavelet analysis has emerged as a powerful tool in the field of signal processing due to its ability to analyze both frequency and time domains simultaneously. Studies effectively used wavelet transforms to detect faults in rotating machinery, proving particularly adept at identifying transient events and localized changes in signals, types of information that are often missed by traditional Fourier analysis. This feature is crucial for the diagnosis of mechanical systems, where localized damages such as small cracks or wear can lead to significant failures if not detected early. Integrating wavelet analysis into the Lagrange framework, as proposed in this study, enhances the ability to diagnose faults accurately, especially under varying operating conditions.
In the initial stages of gear damage detection research, traditional vibration analysis techniques such as Fourier transform (FT) and modal analysis were predominantly used. These methods provided fundamental tools for identifying damage by analyzing changes in vibration frequency components, typically observing variations in amplitude and frequency spectra. For example, studies applied FT-based approaches to monitor gear conditions, laying the groundwork for more advanced diagnostic methods. However, while effective for periodic signals, these techniques often struggled to detect transient and localized damages, which are crucial for early fault detection. The limitations of these classical approaches necessitated the development of more sophisticated tools, such as the Lagrange-Wavelet method introduced in this study, which can analyze nonstationary signals more effectively.
In recent years, the combination of multiple analytical methods has become a trend to improve diagnostic accuracy. For example Refs.,6,10 showed that integrating time-domain and frequency-domain analysis could lead to superior fault detection capabilities. By combining Lagrange dynamics (which models system behavior based on energy principles) with wavelet analysis (which provides detailed time-frequency signal analysis), our proposed method leverages the strengths of both approaches. This integration allows for a comprehensive examination of mechanical vibrations, providing insights that are more detailed than what can be achieved by using each method individually.
In this study, the manuscript demonstrates that the combination of the Lagrange method and wavelet analysis provides a comprehensive approach to detect damage in spiral bevel gears within mechanical systems. The Lagrange method is applied to accurately model the motion equations of the gear system during operation, allowing the construction of a precise mathematical model that includes dynamic variables, structural components, and boundary conditions. This enables the calculation of vibration parameters such as frequency and amplitude. Wavelet analysis, on the other hand, is used to analyze the vibration signals of the gear system, helping to detect spatial and temporal variations in the signals, thereby identifying damage within the system. The integration of these two methods allows for a thorough diagnosis of damage issues and prediction of mechanical system vibrations, enhancing efficiency and accuracy in the study and resolution of gear-related problems and other mechanical systems.
Specific issues related to spiral bevel gear damage, such as tooth wear, cracks, misalignment, and their effects on gear vibration, have been extensively studied. The work focused on understanding how different types of damage affect the vibration characteristics of the gears. These studies highlighted limitations in existing diagnostic tools, such as difficulties in detecting subtle damages or isolating faults from background noise. By applying the integrated Lagrange-Wavelet approach, our study addresses these limitations, providing a more refined and accurate detection mechanism that can discern subtle variations in vibration signals, thus ensuring early and reliable diagnosis.
Vibration analysis method using the Lagrange model
The symbols

In which

The

If the system of forces acting on the system includes some forces that are potential forces,35,55 then the generalized force will consist of two components. The generalized force of the potential forces and the generalized force of the non-potential forces 56 :


In this context:

If this study introduces the following notation:
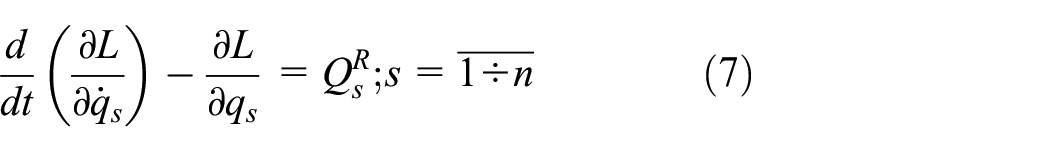
This study obtains equation (7) because the potential energy is a function that depends only on the coordinates and not on the velocity. If all the forces acting on the system are potential forces, then the right-hand side of the equation becomes zero.
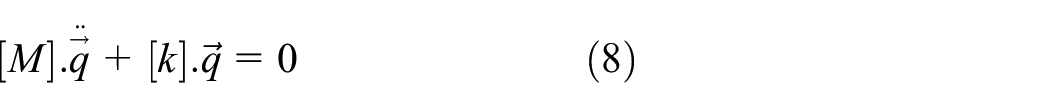
Undamped linear system with free vibration
The differential equation of motion for an undamped linear system undergoing free vibration has a simple form in equation (8):
The solution to the differential equation (8) can be calculated and expressed in the form of equation (9):6

With T(t) is the time function

In which Xi (i=1-n) are constants. From equations (9) and (10), this article derives the result that the expression for the ratio between the values of the two generalized coordinates qi(t) and qj(t) is constant:

The vector

Expanding this matrix equation into n component equations, this study obtains the following expression:

After separating the variables in equation (12b), this study obtains the equality as shown in equation (13):

The expression on the left side of equation (13) is a function of time, and the expression on the right side does not depend on time, but on the index i, both sides of the equation must be equal to a constant value, denoted as λ. Thus, this article obtains the following two equations:


Rewrite equation (15) in matrix form:

To find a non-zero vector solution

Equation (17) allows us to determine the values of λ. This equation is called the characteristic equation, and the values of λ are called eigenvalues. The task of solving equation (16) is called the eigenvalue problem. Clearly, the determinant equation Δ is an nth degree polynomial in λ. It has been proven that if the matrices [

The ordinal numbers assigned to the values and λ are conventionally such that the former value is smaller than the latter, respectively, as equation (19)

is called the lth natural frequency, in which

For each value of

In which:

From equation (22), this article sees that at the lth natural frequency, the system will oscillate with the following characteristics:
a) All generalized coordinates of the system, denoted q 1 (l),…, q n (l) vary by the same harmonic function:

b) The ratio between coordinates is a number, for example, between the first and second coordinates:

The vibration of the system determined by the system of equation (23) is called the lth principal vibration or the lth specific vibration form of the system. Since all solutions

If this manuscript gives matrix symbols:


Then the last equation can be written in the following general form:

The role of the functions T l (t) for the system is the generalized coordinates in a generalized coordinate system (T 1 (t),T2(t)…Tn(t)) consisting of n coordinates. That means This study has moved from the coordinate system qi(t),i = 1÷n to the coordinate system T l (t),l = 1÷n and the relationship between them is expressed by equation (28)
Linear system with dampers
In the case where the system is subject to forces proportional to velocity, the differential equation takes the generalized form:

The analytical solution of equation (29) can be obtained using the eigenvalue analysis method based on the assumption that the damping coefficient matrix [

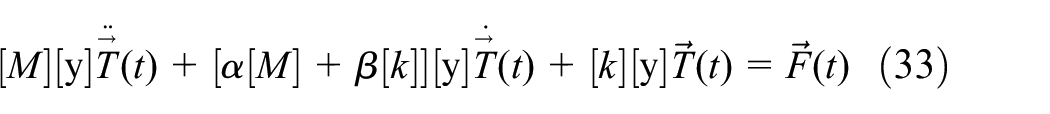
In which: α, β are constants. In this case, equation (29) transforms into equation (31):

The solution q(t) is found in a general form:

Where, [
Multiplying both sides by [

Due to the orthogonal nature of the eigenvectors with respect to [
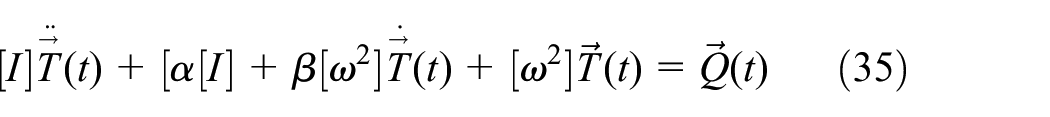
With

Equation (35) will be a system of n equations of the form equation (37):

In this manuscript, see that equation (37) has the form of the differential equation of motion of a system with one degree of freedom. To solve equation (37), this manuscript first assumes the following problem:

Equation (37) becomes:

The solution of equation (38) is similar to the solution to the equation of a one-degree-of-freedom system subject to damping and forcing. The general solution in the case

Wavelet analysis model
In recent years, wavelet analysis has been extensively studied and widely applied in the field of signal processing. This research will detail the fundamental concepts and outstanding features of the Wavelet tool. In spectral analysis, a signal is typically described as a sum of sine and cosine functions. Conversely, wavelet analysis represents a signal using Wavelet functions, which possess both time and scale characteristics. Similarly to how the Fourier transform decomposes a signal into sine components of different frequencies, wavelet analysis decomposes a signal into components through shifted and scaled versions of the original Wavelet function (mother Wavelet). Wavelet analysis is a logical progression from windowed techniques with varying window sizes, allowing the use of longer time windows for better accuracy in low-frequency information and shorter time windows for high-frequency information. Unlike time-frequency domain analysis, wavelet analysis operates in the time-scale domain. This flexibility in varying time windows and scales makes Wavelet analysis a powerful tool for signal processing and analysis, opening up numerous application opportunities in various fields. Mathematically, Fourier analysis is performed using the Fourier transform, whereas wavelet analysis is conducted through Wavelet transforms:

The Fourier transform at every moment is the sum of the signal f(t) multiplied by a complex exponential function, as shown in Figure 1. The result of the Fourier transform is the Fourier coefficients F(ω). These Fourier coefficients, when multiplied by a sine wave of frequency ω, form the sine components that reconstruct the original signal. Geometrically, the process is as follows:

Signal analysis using the Fourier transform. 57
Similarly, the wavelet transform is defined as the sum over the entire time interval of the signal, scaled and shifted by the Wavelet function ψ.

The result of the Continuous Wavelet Transform (CWT) is a large number of wavelet coefficients C (scale, position), which are functions of scale and position. By multiplying each coefficient with the corresponding scaled and shifted wavelet, the original signal can be reconstructed as shown in Figure 2.

Signal analysis using continuous wavelet transform. 57
To perform a wavelet analysis on a signal, the research will be conducted based on the following four steps:
Step 1: The mother wavelet function is initially selected with S = 1. The continuous wavelet transform (CWT) will then be calculated sequentially for all values of S. However, in practice, signals have limited bandwidth, so the transformation process is only calculated for values of S within a specified range as shown in Figure 3.
Step 2: The process begins with S = 1, then the value of S is gradually increased if the analysis proceeds from high to low frequency, and vice versa, as shown in Figure 4.
Step 3: The initial wavelet function is placed at the starting point of the signal (t = 0). The signal is multiplied by the wavelet function and then integrated, with the integration result being multiplied by the constant 1/S (to ensure equal energy across different scales). This result is the CWT value at τ = 0 and S = 1. The wavelet function is shifted to a new position t = τ, and the same calculation process is repeated to obtain the CWT value at t = τ and S = 1. This process is repeated until the wavelet function has traversed the entire signal. At this point, this manuscript obtains a row of points corresponding to S = 1 in the (τ,S) plane.
Step 4: The whole process with S = 1 is repeated for all values of S. For each value of S, a row of points (τ,S) is obtained after the calculation process. The entire computational procedure is illustrated in Figure 5.

Model for wavelet detection of the mother wavelet function with S = 1. 57
Wavelet detection model from the mother wavelet function from low frequency to high frequency. 57

Separation and combining waves from the mother wavelet function. 57
The proposed Lagrange-wavelet model
The proposed Lagrange-Wavelet model was rigorously tested to evaluate its ability to diagnose gear damage through the analysis of vibration signals. To extract and analyze these signals, the study employed wavelet transform (WT) and Fast Fourier Transform (FFT). These techniques allowed for a comprehensive understanding of how different damage conditions affected gear dynamic behavior by converting time domain data into meaningful frequency-domain representations.
Determination of the frequency spectrum
The frequency spectrum was derived from the vibration signals generated by the simulated gear system operating under varying damage conditions. By applying WT and FFT, the study was able to identify characteristic frequencies and detect changes that are indicative of damage.
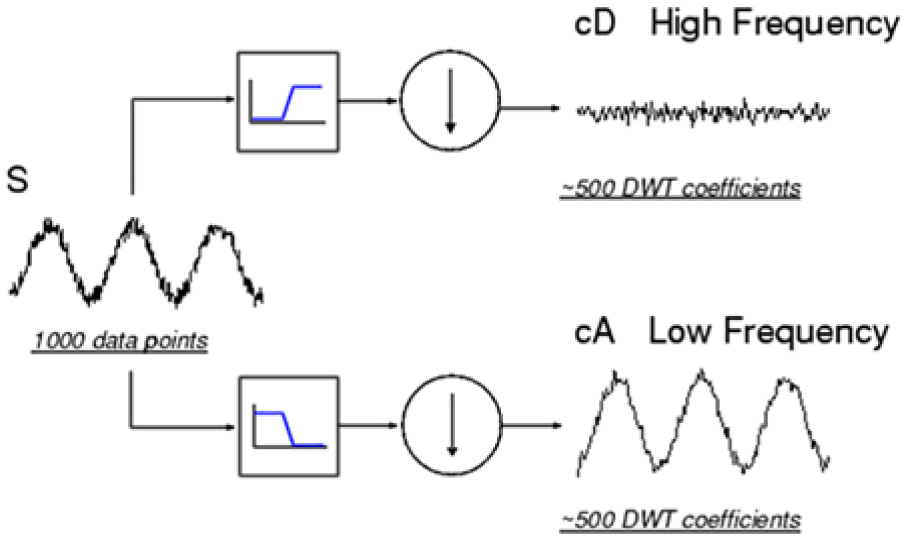
- Wavelet Transform (WT): WT was used to provide a time-frequency representation of the vibration signals, which is crucial to detect transient events and localized anomalies. Unlike traditional methods that analyze the signal purely in the frequency domain, WT allowed for the observation of sudden changes or irregularities, such as short bursts or spikes in the signal, which are often signs of early-stage damage like microcracks or wear. This made WT particularly effective at diagnosing subtle faults that might otherwise be overlooked. For the analysis of vibration signals in this study, the Discrete Wavelet Transform (DWT) was employed, utilizing the Daubechies wavelet (db4) as the mother wavelet. The db4 wavelet was chosen due to its excellent ability to capture transient features and localized anomalies in vibration signals, which are critical for identifying subtle changes caused by faults such as cracks and wear in spiral bevel gears. The db4 wavelet is particularly effective in decomposing complex signals into various frequency bands, making it suitable for analyzing the non-stationary characteristics of gear vibrations and ensuring accurate fault detection.
This choice of wavelet allowed the study to isolate and analyze specific frequency components associated with different types of damage, providing detailed insights into how gear defects impact the overall vibration behavior of the system. The effectiveness of the db4 wavelet in identifying both global and localized anomalies supports the robustness of the proposed diagnostic approach.
- Fast Fourier Transform (FFT): FFT was used to decompose vibration signals into their frequency components, showing dominant frequencies, harmonics, and patterns related to gear meshing. By comparing the frequency spectra of damaged and undamaged conditions, the study was able to track how the presence of damage altered the characteristics of the signal. For example, specific damage types could cause the appearance of sidebands, changes in peak frequencies, or changes in amplitude at certain frequencies, all of which serve as diagnostic indicators of gear health.
Analysis of various damage levels
To evaluate the sensitivity of the proposed model, the study simulated different damage severities, such as 10%, 30%, 50%, and 100%. Each level represented a progressive increase in the extent of damage, from minor wear to complete failure, allowing a detailed analysis of how different faults affect the vibrational behavior.
At 10% damage, representing a small, localized crack or minimal wear, the WT and FFT analyzes detected subtle deviations in the frequency spectrum, such as slight shifts in peak frequencies and minor sidebands. These subtle changes are critical for early fault detection, as they indicate the initial stages of gear deterioration.
As the damage increased to 30% or 50%, representing more extensive wear or deeper cracks, the deviations became more pronounced. The frequency spectrum showed amplified sidebands, increased harmonic distortion, and noticeable shifts in resonant frequencies, reflecting the deteriorating condition.
At 100% damage, indicating a complete structural failure in which a tooth was completely fractured or broken off, the spectrum exhibited severe disruptions. This extreme scenario allowed the model to demonstrate its ability to detect and diagnose critical failures, ensuring that maintenance teams can respond promptly to prevent catastrophic breakdowns.
Handling multiple damage scenarios
The robustness of the Lagrange-Wavelet model was further tested by simulating scenarios where multiple types of damage occurred simultaneously. These included cases such as two cracked teeth or a combination of tooth wear and cracks. The ability to detect and differentiate between these combined faults is essential for real-world applications, where complex machinery often suffers from multiple problems at once.
In scenarios involving multiple types of damage, the frequency spectrum revealed different patterns for each damage. For example, two separate cracks in different teeth produced dual sets of sidebands, and a combination of wear and cracks showed variations in the low- and high-frequency ranges. The WT analysis enabled the model to localize the damage, identifying where each fault was occurring, while the FFT provided a holistic view of how these faults were interacting and affecting the overall system dynamics.
The results of the research illustrate these phenomena, showing how the frequency spectrum changes in the presence of multiple damages. The results demonstrated that the proposed model could successfully detect and interpret complex damage scenarios, providing accurate diagnostics that distinguish between isolated and combined faults. This capability is crucial for developing predictive maintenance strategies, where understanding the nature and severity of multiple problems can lead to more effective and targeted interventions.
Validation through experimental data
To ensure the reliability of the model, the study validated its findings by comparing the simulated frequency spectra with experimental data from gear systems where known damage was induced. The close match between the results from simulations and real-world experiments confirmed the model’s accuracy in diagnosing gear faults. This alignment underscores the practical applicability, showing that it can be confidently used for real-time monitoring and early warning systems in industrial settings.
The validation of the experimental data not only reinforced the model’s accuracy of the model, but also highlighted its ability to detect multiple faults simultaneously, ensuring that maintenance actions can be planned proactively. For example, the model accurately identified combinations of wear and cracks, validating its effectiveness as a comprehensive diagnostic tool.
By providing a detailed analysis of how the frequency spectrum was determined for various damage levels and demonstrating the model’s ability to handle multiple damage scenarios, the study presents the Lagrange-Wavelet model as a robust and reliable tool for gear diagnostics. Its ability to detect subtle changes, differentiate between multiple faults, and provide precise diagnostics make it well-suited for predictive maintenance and condition monitoring, ensuring extended equipment life and reduced downtime.
Relationship between vibration frequency and damage in spiral bevel gears
Gear transmissions generate characteristic frequency components due to the precise meshing of gear teeth during operation. When the gears are arranged, they create vibrations and vibrations at specific frequencies, reflecting the mechanical interaction between the teeth. These frequencies are typically directly related to the rotational speed of the gears and the number of teeth on each gear. Consistent and accurate meshing not only ensures high transmission efficiency, but also helps minimize noise and vibrations, thereby enhancing the durability and lifespan of the transmission system. Analyzing these frequency components provides valuable information about the operational condition of the gear transmission, enabling early detection of damage signs and timely implementation of maintenance measures.

In this context:

Frequency range and frequency spacing of the gear train.
The vibration signal of a gearbox is inherently complex and comprises numerous oscillatory components that originate from gears, bearings, shafts, and other parts. Consequently, the gearbox spectral structure of the vibration signal features frequency components related to gear meshing, bearing-induced frequencies, and shaft rotational frequencies, often presented as harmonic series. When a gear is damaged, the vibration signal exhibits distinct characteristics, reflecting deformation or misalignment during meshing. This altered signal can be illustrated as shown in Figure 7. Analyzing these frequency components not only helps determine the operating condition of the gearbox but also facilitates early detection of damage signs and timely implementation of maintenance measures.

Vibration frequencies indicating gear damage: (a) distance of misaligned shaft and (b) gear with cracks or broken teeth.
In the case of gears with cracks or broken teeth, the frequency spectrum of a gear transmission with a broken tooth is depicted in Figure 7(a). The sideband on the right of the meshing frequency exhibits a significantly higher amplitude. As a result, the paired sidebands have asymmetrical amplitudes. This asymmetry is a characteristic indicator of damage due to cracks or broken teeth, helping to identify and diagnosis of gear problems, thereby allowing timely corrective and maintenance measures.
However, in the case of gears with misaligned shaft distances, the vibration frequency spectrum is illustrated in Figure 7(b). When gear teeth are worn, the variation in shaft distance leads to changes in the spacing and amplitude of the frequency spectrum, as shown in Figure 7(b). If the shafts are too close to each other, the spacing between the sidebands tends to move toward the input shaft frequency, but the amplitude decreases significantly. This variation in the frequency spectrum is an important indicator for identifying issues related to shaft distance and gear tooth wear, aiding in the effective diagnosis and maintenance of transmission systems.
Results and discussion
Vibration model of spiral bevel gear
The vibration model analysis is a crucial tool for evaluating and optimizing the performance of gear mechanisms during meshing. This study uses the Lagrange method to gain a deeper understanding of how spiral bevel gears behave under different vibration frequencies within a meshing model. Figure 8 presents the results of a general vibrational model analysis of a meshing spiral bevel gear system, illustrating the behavior of the gears across various frequencies ranging from approximately 9468.9 to 29,707.7 Hz. Contrary to what might be implied, Figure 8 does not depict specific deformation patterns; rather, it visualizes the vibrational modes and the natural frequencies at which the gear system resonates, providing insight into how gears respond to vibrational forces during operation.

The dynamics of a spiral bevel gear model in mesh using the Lagrange method.
The model was developed using the Lagrange method by deriving the equations of motion (EOM) that capture the dynamic interactions between the meshing gears, considering parameters such as meshing stiffness, damping, and gear geometry. Analysis through this model helps identify critical vibration frequencies that could lead to resonance, potentially affecting the stability and performance of the gear system. The results indicate that the gear mechanism is particularly sensitive to vibrations in the lower frequency range (approximately 9468.9–12,600 Hz), where significant resonance is more likely to occur, requiring special attention during the design and testing phases.
By understanding these vibrational behaviors, the study highlights the importance of reinforcing areas that are more susceptible to pressure and vibration, particularly at frequencies where resonance could lead to mechanical stress or failure. Optimizing the design for low-frequency vibrations and ensuring structural integrity at critical points can significantly enhance the performance and durability of the gear system, leading to improved efficiency and longevity.
The extraction of the vibration response in this study was achieved through a comprehensive simulation of the dynamic behavior of the spiral bevel gear system using the integrated Lagrange-Wavelet model. This approach allowed for precise calculation of key parameters such as vibration frequencies and amplitudes. Dynamic behavior was modeled considering essential factors, including structural components, boundary conditions, and operating variables, which reflect the real-world functioning of spiral bevel gears under various loading scenarios. degrees of freedom (DoF) played a crucial role in these simulations, as the complexity of the gear structure necessitated the use of a multidegree-of-freedom system. The number of DoF was determined based on the geometry and structural attributes, allowing a more detailed analysis of the dynamic variables and interactions during gear meshing. Furthermore, specific values for the stiffness and other stiffness parameters, including those of the bearings, were integrated into the model. These values were selected based on both mechanical property standards and experimental data from previous studies to ensure that the dynamic response accurately reflected real-world conditions as shown in Figure 9. Meshing stiffness, for instance, was fine-tuned to replicate the typical operational environment of spiral bevel gears, allowing the model to simulate realistic scenarios.

Gear vibration model through five modes: (a) first vibration mode, (b) second vibration mode, (c) third vibration mode, (d) fourth vibration mode, and (e) fifth vibration mode.
The Lagrange method of this study offers several significant advantages in the vibration analysis of spiral bevel gears during meshing. First, this method enables precise modeling of the equations of motion for the gear system, including dynamic variables, structural components, and boundary conditions, resulting in a detailed and comprehensive mathematical model. Dynamic analysis through the Lagrange method helps identify characteristics such as vibration frequency and amplitude, allowing for the recognition and analysis of specific vibration modes and their impacts on system performance.
A key advantage is the ability to detect early signs of damage such as deformation, stress, and displacement of the gears, which facilitates timely maintenance and repair measures, reducing the risk of severe damage and extending the life of the system. The method also allows the assessment of the impact of different vibration frequencies, identifying sensitive frequencies that cause high deformation and stress, thus optimizing the design and durability testing of gears. By simulating real-world scenarios and optimizing designs, the Lagrange method not only improves performance and durability, but also minimizes maintenance costs and enhances the operational efficiency of the system. Due to these superior advantages, the Lagrange method has become a crucial tool in the analysis and optimization of the meshing process of spiral bevel gear meshing process, contributing to the improved performance and reliability of mechanical transmission systems.
Vibration model of spiral bevel gear by numerical simulation method
Modeling gear damage using numerical simulation is an advanced technique that allows analysis and prediction of issues related to the durability and performance of gears in mechanical systems. This process uses numerical simulation software to replicate the actual operating conditions of the gears, allowing the monitoring and analysis of damage phenomena such as wear, cracks, and deformation, as illustrated in Figure 10. The numerical simulation method enables the creation of a detailed digital model of the gear, including geometric parameters, material properties, and boundary conditions. Subsequently, dynamic and stress analyses are performed to identify weak points and areas with a high risk of damage. Using these simulations, engineers can gain valuable insight into the behavior and longevity of gears under various operational conditions, leading to improved design and maintenance strategies that improve the overall performance and reliability of mechanical systems.

Numerical simulation of gear damage: (a) spiral bevel gear model, (b) spiral bevel gear model having one defect, and (c) spiral bevel gear model having two defects.
The study analyzes the results obtained from the calculation and simulation of spiral bevel gears during meshing, as shown in Figure 10. This includes both undamaged models and models with damage to the teeth of the driving gear. The undamaged model, illustrated in Figure 10(a), represents the basic working condition of two spiral bevel gears, serving as a baseline for comparison with the damaged model. This model reflects the intact structure of the gear, providing a basis for evaluating the differences when damage occurs. In the model with a single structural damage, as shown in Figure 10(b), the presence of damage increases the pressure and deformation around the defect area, affecting the meshing and the life expectancy of the gear. However, in practice, if damage is minor and infrequent, the impact on the structure and operational efficiency of the gear is usually negligible due to the high working coefficient. The study also examines a model with two simultaneous damage in the same driving gear to increase the severity of the damage. The presence of two damage can cause significant instability during operation, leading to increased deformation and uneven pressure on the gear surface. This highlights the importance of early detection and treatment of damages to maintain the performance and durability of the gear system. By understanding these dynamics, engineers can improve maintenance strategies and gear designs to prevent severe failures and extend the operational life of gear systems.
The simulation results and analysis, as shown in Figure 11, clearly demonstrate how operational pressures lead to deformation, causing the gear teeth to shift from their original positions. When damage is present, such as cracks or wear, it exacerbates localized pressure and deformation around affected areas, significantly compromising the stability and meshing efficiency of the gears. Figure 11 provides a detailed visualization of how the pressure distribution and deformation patterns vary with different types and severity of gear damage. For example, the data reveal that even minor cracks can cause a noticeable increase in pressure at the defect site, with these effects becoming more severe as the damage progresses. Similarly, tooth wear leads to increased deflection, resulting in misalignment during gear meshing, further intensifies pressure accumulation and uneven load distribution. These findings highlight a clear trend: the more extensive the damage, the greater its adverse impact on the meshing process, potentially leading to significant risks for the overall mechanical system. By incorporating these graphical analyzes, this study offers robust evidence that understanding pressure and deformation patterns is essential for effective fault diagnosis and predictive maintenance of gear systems.

Displacement of the spiral bevel gear model with damage: (a) displacement of spiral bevel gear model having undefect, (b) displacement of spiral bevel gear model having one defect, and (c) displacement of spiral bevel gear model having two defects.
The analysis of the meshing gear model from this study provides insight into how gears respond to mechanical vibrations in the presence of damage. Optimizing the design and performing regular maintenance can significantly improve the performance and life of gears, ensuring stable and sustainable operation. The study also investigates the impact of high frequencies (2713.6 and 2658.4 Hz), showing that these frequencies can cause the greatest displacement at the tip of the teeth and the greatest deformation at the root of the teeth. This indicates that high-frequency gears need additional reinforcement in high-pressure areas to ensure durability and longevity. In contrast, lower frequencies (2093.4 Hz) exhibit a more uniform pressure distribution and less severe deformation, suggesting that gears operating at these frequencies can better withstand pressure and experience less wear.
Understanding the impacts of stress on the gears during operation is crucial to improving the design and improving the longevity of the system. Figure 12 shows the results of the stress analysis of spiral bevel gears under three different conditions: undamaged, with one damage and with two damages. In the undamaged model, the stress distribution is even across the gear surface, with maximum stress concentrated in the contact area between the teeth, where the highest forces occur during operation. However, in the model with one damage, the stress concentration is higher in the damaged region, increasing local stress and the risk of accelerated wear compared to the undamaged model.

Stress modeling of spiral bevel gear with damage: (a) stress of spiral bevel gear model having undefect, (b) stress of spiral bevel gear model having one defect, and (c) stress of spiral bevel gear model having two defects.
Similarly, the model with two damages exhibits the highest stress concentration among the three models, with a significantly higher maximum stress focused on both damaged areas. This indicates that the presence of multiple damages not only raises the risk of severe damage, but also considerably reduces the gear’s lifespan. The analysis confirms that damage to spiral bevel gears increases local stress, especially when multiple defects are present. To enhance the durability and lifetime of gears, it is essential to inspect and eliminate defects from the production stage. In addition, regular maintenance and monitoring of gear conditions during operation are crucial to detect early and address potential problems promptly. This stress analysis provides valuable information to design and improving gear mechanisms in the future, to ensure system performance and durability.
Based on images of spiral bevel gears, this manuscript can draw significant scientific conclusions about the impact of damage on the stress and deformation of the gears. In the undamaged model shown in Figure 13(a), the stress distribution is even across the gear surface, with maximum stress concentrated in the contact area between the teeth. This indicates that the contact area bears the highest force but does not exhibit abnormal stress concentration. However, when damage is present, as shown in Figure 13(b), local stress increases significantly around the defect area, illustrated by darker red regions, indicating higher deformation and stress compared to the undamaged model. This can lead to rapid deterioration and reduced wear and tear of the gear. In the model with two damages, shown in Figure 13(c), the stress reaches its highest levels among the three cases, with broader and darker red areas, demonstrating a substantial increase in maximum stress in the damaged regions. The presence of two damages not only raises the risk of severe deformation, but also significantly decreases the gear’s lifespan. These results underscore the importance of inspecting and eliminating defects from the production stage and performing regular maintenance and monitoring of gear conditions during operation to ensure the durability and longevity.

Deformation modeling of spiral bevel gear with damage: (a) deformation of spiral bevel gear model having undefect, (b) deformation of spiral bevel gear model having one defect, and (c) deformation of spiral bevel gear model having two defects.
Parameter integration between the Lagrange-wavelet model and experimental settings
Experimental settings
Integration of theoretical parameters with experimental settings
To ensure that the proposed Lagrange-Wavelet model accurately reflects real-world conditions, it is essential to establish a clear connection between the theoretical parameters and the experimental setup. Key parameters such as meshing stiffness, damping coefficients, and generalized forces were derived from empirical data obtained through controlled experiments on spiral bevel gear systems. For example, the stiffness was calculated using force displacement data collected during gear mesh testing. This approach allowed us to derive realistic stiffness values that capture the mechanical behavior of gears under varying load conditions. Similarly, damping coefficients were determined by observing the rate of decay in vibration amplitudes after external disturbances, providing an estimate of how energy is dissipated in the system.
Experimental calibration and validation
Calibration was a critical step to align the theoretical model with the experimental observations. During this process, we conducted extensive tests to capture the actual vibration signals of gears operating under different speeds and loads. These empirical data were then used to adjust key parameters in the model until the simulated vibration responses matched the observed results. This iterative calibration ensured that the stiffness and damping values accurately reflected the realistic behavior of the gears, leading to a more reliable and predictive model. Table 1 presents a comparison of the initial theoretical values and the calibrated parameters, highlighting the adjustments made to achieve this alignment.
Consistency in operating conditions
The comparison of initial theoretical values and the calibrated parameters.

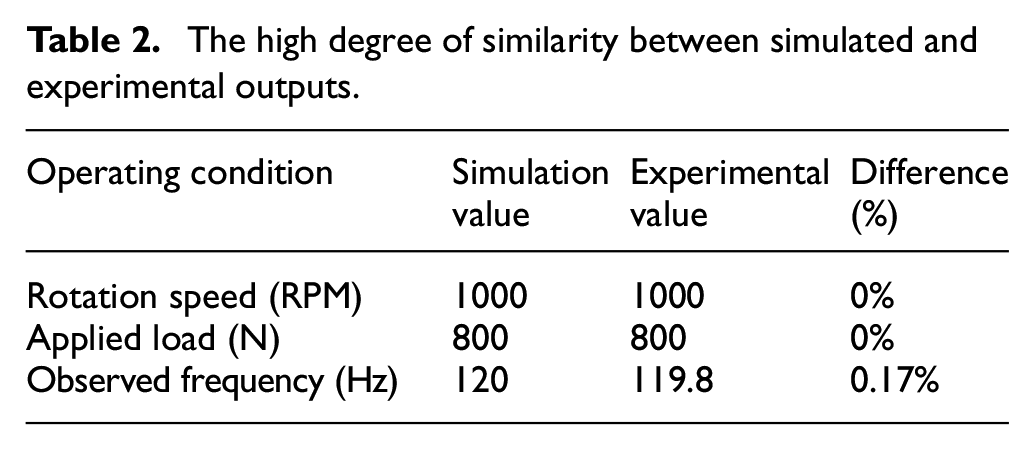
Ensuring consistency between the simulation and the experimental settings was crucial for validation. Both environments were configured with identical operating conditions, including gear rotation speeds, load levels, and boundary conditions. This uniformity allowed for direct comparisons, with rotation speeds ranging from 500 to 1500 RPM and controlled loads set to replicate real-world operational scenarios. The results showed a high degree of similarity between the simulated and experimental output, as illustrated in Table 2, confirming the precision of the model.
Parameter sensitivity analysis
The high degree of similarity between simulated and experimental outputs.
A sensitivity analysis was performed to identify which parameters had the most significant influence on the vibration response of the gear system. The results indicated that the stiffness played a crucial role in determining the frequency response, as variations in the stiffness values led to noticeable changes in the vibrational behavior. The damping coefficients primarily affected the attenuation of vibration amplitudes, reflecting the energy dissipation properties. This analysis helped prioritize the calibration of key parameters, ensuring that the model’s output accurately mirrored real-world conditions.
Practical Approaches for parameter extraction
To bridge the gap between theoretical modeling and experimental reality, the study employed practical methods for parameter extraction.
Meshing stiffness: This was obtained by contact force analysis, where measurements at various meshing points were used to derive realistic stiffness values.
Damping coefficients: These were estimated by analyzing the decay rate of the vibration amplitudes after disturbance, aligning the energy dissipation characteristics with the observed behavior in actual gear systems.
To further validate the accuracy of the model, graphical comparisons were included to show the alignment between the simulated frequency spectra and experimental data. Figure 14 illustrates how closely the vibration patterns from the Lagrange-Wavelet model match those observed in the experimental measurements. This close match underscores the precision of the model, confirming that the integration of theoretical parameters with real-world data has been effectively achieved.

Lagrange-wavelet analysis model of undamaged gear.
Through meticulous calibration, consistent operating conditions, and comprehensive sensitivity analysis, the proposed Lagrange-Wavelet model successfully integrates theoretical parameters with experimental settings. This approach ensures that the predictions are both accurate and applicable, providing reliable damage detection and diagnostics for spiral bevel gears. The rigorous alignment between simulation and experimental data demonstrates the model’s potential for practical use in predictive maintenance systems, enabling early identification of faults and reducing operational downtime.
Model building
To accurately evaluate the performance of the proposed Lagrange-Wavelet model, the study simulated two common types of damage found in spiral bevel gears: tooth cracks and tooth wear. These types were selected due to their significant impact on gear performance and the potential for early failure if left undetected.
Types of damage simulated
- Tooth cracks: The simulations modeled cracks of varying lengths and positions on the gear teeth. Cracks are often caused by factors such as cyclic stress, fatigue, or overloading, and can start as small fissures that progressively worsen, ultimately compromising the gear’s structural integrity. By introducing cracks of different severities in the simulations, the study could observe how these faults influence the dynamic behavior of the gear, including changes in its vibration patterns. This allowed for an assessment of the model’s ability to detect even minor cracks, ensuring early fault diagnosis. The tooth cracks were designed with lengths ranging from 1 to 5 mm, representing different stages of crack development from early microcracks to more severe faults. These cracks were oriented at an angle of 30° to the surface of the tooth, replicating common real-world scenarios in which shear forces induce cracks along an inclined direction. Cracks were placed in both the root and mid-section of the tooth to analyze how different locations impact the dynamic behavior. - Tooth wear: This form of damage was represented by gradual material loss on the gear teeth surfaces, which can occur over time due to friction, insufficient lubrication, or abrasive wear. The simulations explored various levels of wear to analyze how it affects the meshing process between gears. Changes in tooth profiles lead to altered contact forces during operation, which, in turn, manifest as specific variations in vibration signals. The study used these simulations to validate the sensitivity to wear-related damage, demonstrating its effectiveness in detecting early signs of gear degradation. For tooth wear, the simulations modeled a gradual reduction in material thickness, with wear depths ranging from 0.1 to 0.5 mm. This represented moderate to severe wear levels, simulating conditions caused by factors such as poor lubrication or abrasive particles. Wear was localized across 50% of the width of the tooth, following the natural curvature of the tooth, to accurately depict how wear alters the gear meshing process.
Implementation of damage scenarios
- The study carefully detailed how these damage scenarios were integrated into the simulation model. For tooth cracks, adjustments were made to the stiffness in the affected area, simulating the reduction in structural integrity caused by cracks. This reduction allowed the model to realistically capture changes in vibration dynamics, reflecting how cracks impact gear performance. - For tooth wear, modifications were applied to the gear profile, altering the contact mechanics during gear engagement. This led to specific variations in the vibration spectrum, which were analyzed using the integrated wavelet approach. By capturing these subtle changes, the model could accurately diagnose early wear, allowing timely maintenance and preventing further damage.
Diagnosis of spiral bevel gear damage using the Lagrange-wavelet model
The Lagrange method was used to develop the equations of motion, providing a mathematical framework that captures the interactions between different parts of the gear system. The governing equations were derived from the principles of energy conservation, where generalized coordinates and forces were used to effectively represent the dynamics effectively. Specifically, the model took into account generalized forces, potential energy, and kinetic energy to describe the behavior of the gear system in a comprehensive way. Wavelet analysis was then applied to the extracted vibration signals to transform these signals into the time-frequency domain, allowing the detection of specific patterns and anomalies that could indicate damage. The wavelet transform provided a detailed analysis of the vibration signals, isolating localized changes that are often indicative of gear damage such as cracks or wear. To validate the model and its predictions, the simulations included different damage scenarios. The Finite Element (FE) model was used primarily to generate the results presented in Figures 14, 16, 18, and 19. This FE model was calibrated using natural modes obtained from the analysis shown in Figure 8, ensuring that the simulations accurately reflect the vibrational characteristics observed in real gear systems.
The combined Lagrange and wavelet analysis method is a powerful tool for diagnosing damage in spiral bevel gears, leveraging the strengths of both techniques. The Lagrange method enables the construction of accurate motion equations for the gear system, incorporating dynamic variables, structural elements, and boundary conditions, thus identifying crucial vibration parameters such as frequency and amplitude. Wavelet analysis decomposes vibration signals into frequency and time components, allowing the detection of local variations in the signal, which is particularly effective in identifying signs of damage, such as cracks, wear, or deformation. When combined, the Lagrange model provides information about the system’s dynamics and structure, while wavelet analysis aids in the early detection of damage indicators. This combination allows identification and analysis of characteristic vibration frequencies, early detection of damage for timely maintenance measures, improved accuracy in predicting the lifespan and performance of gears, and optimized design to minimize damage risks. Therefore, the Lagrange-Wavelet model offers an effective and precise method for diagnosing damage in spiral bevel gears, aiding in improving gear design and maintenance, ensuring durability and high performance during operation.
Based on Figure 14, this article can draw scientific conclusions about the condition of the spiral bevel gears when not damaged. First, component signals show continuous variation in amplitude without signs of abnormal deformation, indicating stable gear operational conditions of the gears. The Fourier transform shows the distribution of frequency components of the vibration signal, with amplitude peaks appearing regularly at characteristic frequencies. These frequency peaks do not exhibit sudden or abnormal increases in amplitude, reflecting the absence of damage or imbalance in the system. Finally, wavelet analysis illustrates the variation of the vibration signal over time and frequency. The frequency components are evenly distributed without sudden or abnormal changes in amplitude or frequency, indicating that the gears operate normally, as shown in Figure 15. The results of the Lagrange-Wavelet analysis confirm that the vibration signal has stable characteristics with no signs of damage. This combined method provides a robust tool for monitoring and diagnosing the condition of gears, ensuring that any signs of damage can be detected early and addressed promptly, thereby maintaining the system’s performance and durability.
Frequency spectrum of the undamaged spiral bevel gear model.
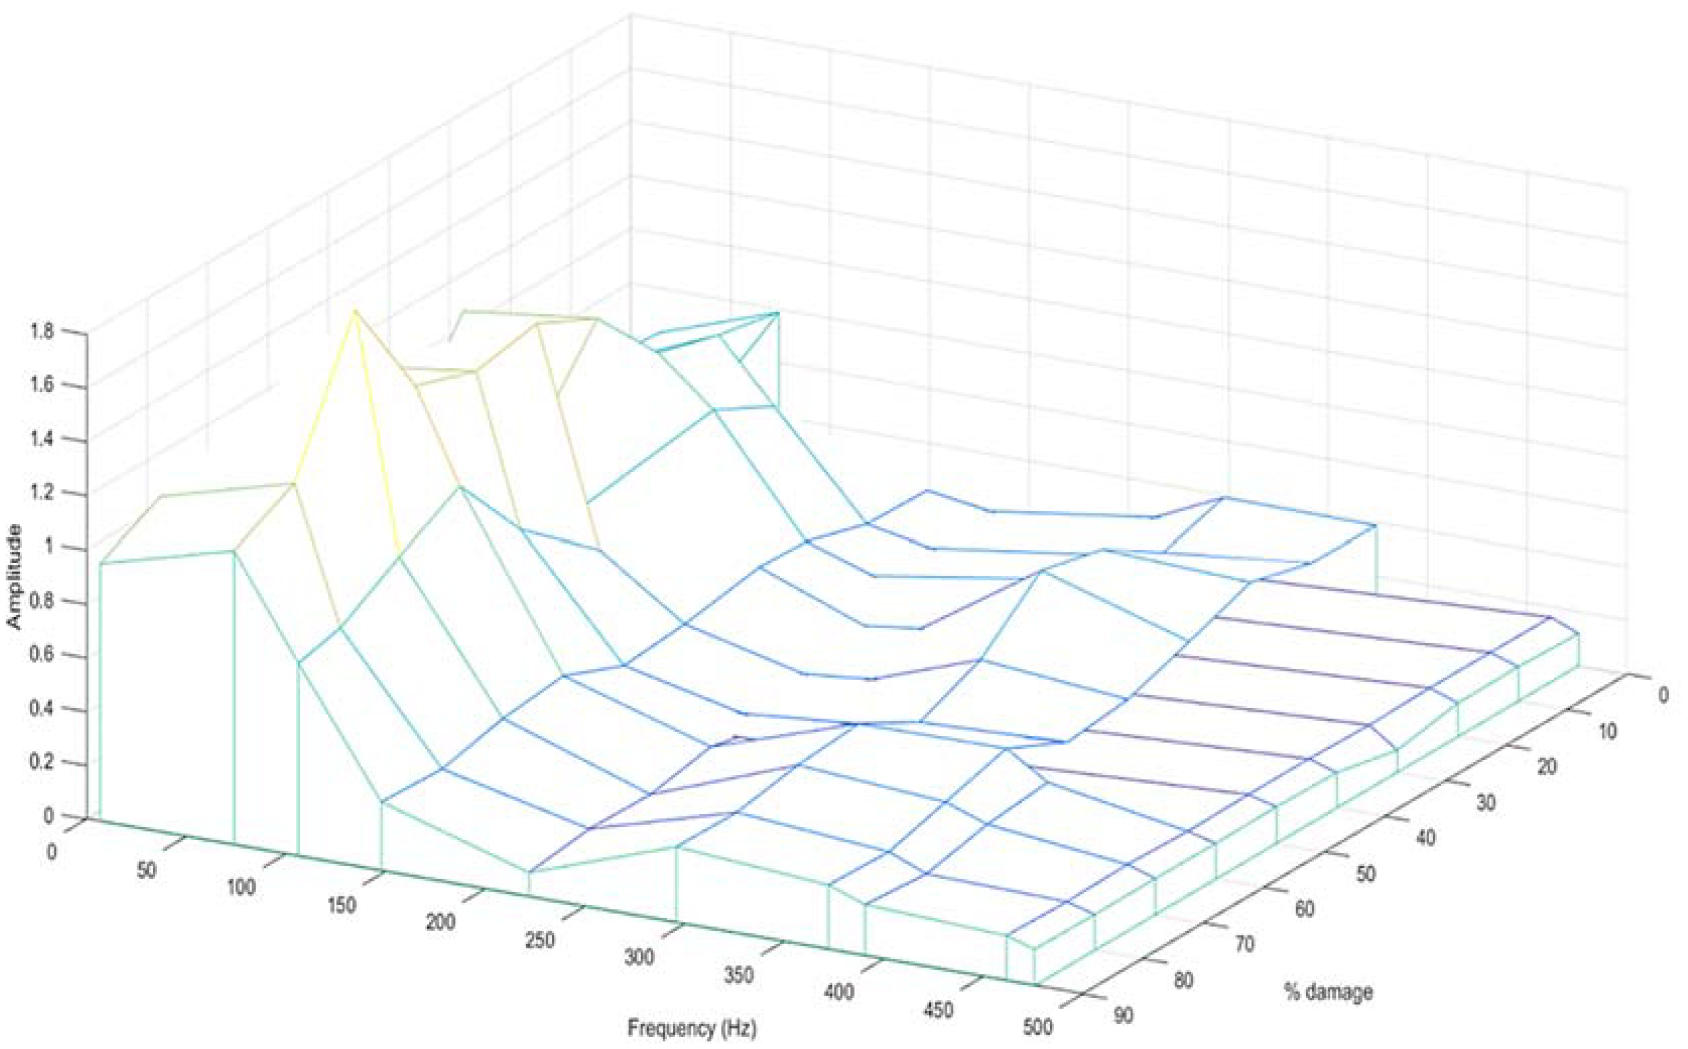
Based on Figure 16, the results of the Lagrange wavelet analysis model for gears with damage levels of 10%, 30%, and 100% allow us to draw scientific conclusions about the impact of damage on the gear system. In the case of 10% damage, the vibration signal shows uneven amplitude variations, reflecting the slight impact of the damage. The Fourier transform displays frequency peaks with higher amplitude compared to the undamaged case, indicating that the damage begins to affect the system’s vibration frequency. Wavelet analysis shows local changes in amplitude and frequency over time, with unevenly distributed frequency components. When the damage level increases to 30%, the vibration signal becomes more uneven, indicating increased instability. The Fourier transform shows frequency peaks with a significant increase in amplitude, especially at higher frequencies. Wavelet analysis reveals dramatic changes in amplitude and frequency, with more unevenly distributed frequency components, reflecting greater instability due to damage. In the event of 100% damage, the vibration signal exhibits extremely uneven amplitude variations, indicating a severe impact on the system. The Fourier transform displays frequency peaks with very high amplitude, particularly at lower frequencies, as shown in Figure 17. Wavelet analysis reveals extremely pronounced changes in amplitude and frequency, with very uneven frequency components that reflect severe instability due to complete damage. In summary, the Lagrange wavelet analysis shows that the greater the damage level, the more pronounced the changes in the vibration signal, with uneven variations in amplitude and frequency, and increased instability. This method allows detailed detection and assessment of the impact of damage on the gear system, providing crucial information for timely maintenance and repair measures.

Lagrange-wavelet analysis model with gear damage (10%, 20%, 30%, and 100%).
Frequency spectrum of the spiral bevel gear model with one damage.
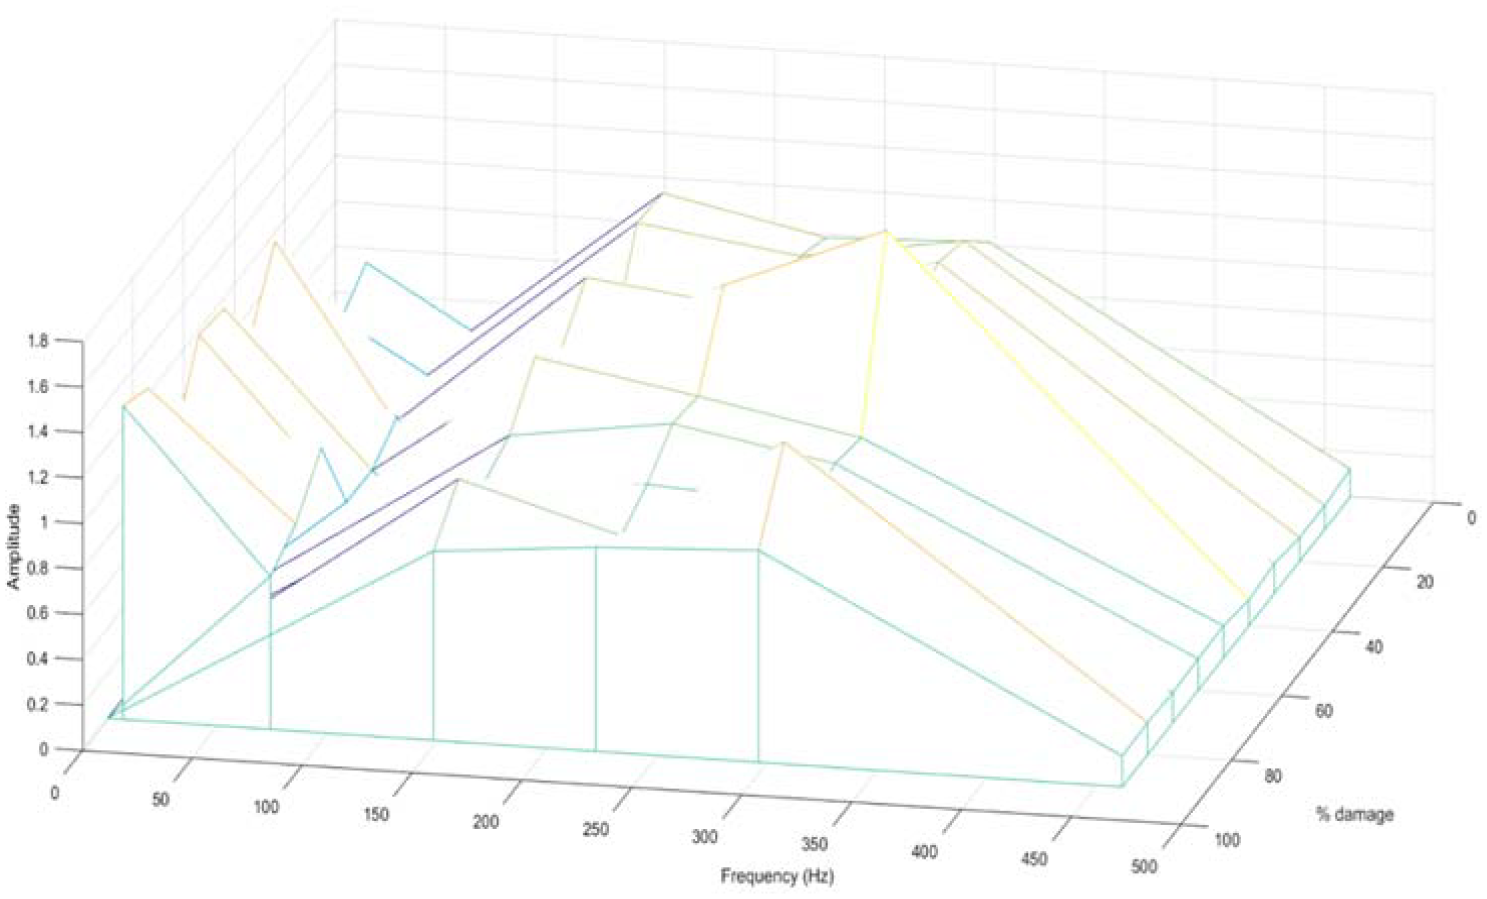
Based on Figures 18 and 19, the Lagrange wavelet analysis of gears with two damage levels ranging from 10% to 90% shows the impact of the damage on the gear system. In the case of 60% damage, the vibration signal (component signals) shows uneven amplitude variations, with more pronounced noise compared to the undamaged case, reflecting increased instability. The Fourier transform displays frequency peaks with higher amplitude, particularly at higher frequencies, indicating that two damage has significantly affected the system’s vibration frequencies. Wavelet analysis reveals strong local variations in amplitude and frequency over time, with uneven color bands reflecting instability due to damage. As the damage level increases to 70%, the vibration signal continues to show more uneven amplitude variations, with clearer noise, indicating a high level of instability. The Fourier transform shows frequency peaks with a substantial increase in amplitude at multiple frequencies, indicating that 70% damage has markedly altered the system’s vibration frequencies and amplitudes. Wavelet analysis shows very clear variations in amplitude and frequency, with unevenly distributed frequency components reflecting strong instability. In the case of 80% damage, the vibration signal shows even greater amplitude variations, with increased noise, indicating severe instability. The Fourier transform displays frequency peaks with very high amplitudes at many frequencies, showing that 80% damage has severely affected the system’s vibration frequencies and amplitudes. Wavelet Analysis shows very clear variations in amplitude and frequency, with uneven frequency components that reflect severe instability. In the case of 90% damage, the vibration signal has extremely uneven amplitude variations, with significant noise, indicating severe instability in the system. The Fourier transform shows frequency peaks with extremely high amplitudes at many frequencies, indicating that 90% damage has very severely affected the system’s vibration frequencies and amplitudes. Wavelet analysis shows extremely pronounced variations in amplitude and frequency, with uneven frequency components, reflecting severe instability. Compared to cases with only one damage, models with two damage show much greater variations in amplitude and frequency, with a significantly higher level of instability. The vibration signal has clearer noise, and the Fourier transform displays frequency peaks with higher amplitude. Wavelet analysis shows very clear variations in amplitude and frequency, with color bands showing strong and uneven variations. This indicates that the presence of two damages significantly increases the risk of severe instability and damage compared to the presence of only one damage.

Lagrange-wavelet analysis model with two damages (10%, 20%, 30%, 40%).

Lagrange-wavelet analysis model with two damages (60%, 70%, 80%, 90%).
Validation and comparative analysis of the Lagrange-wavelet model
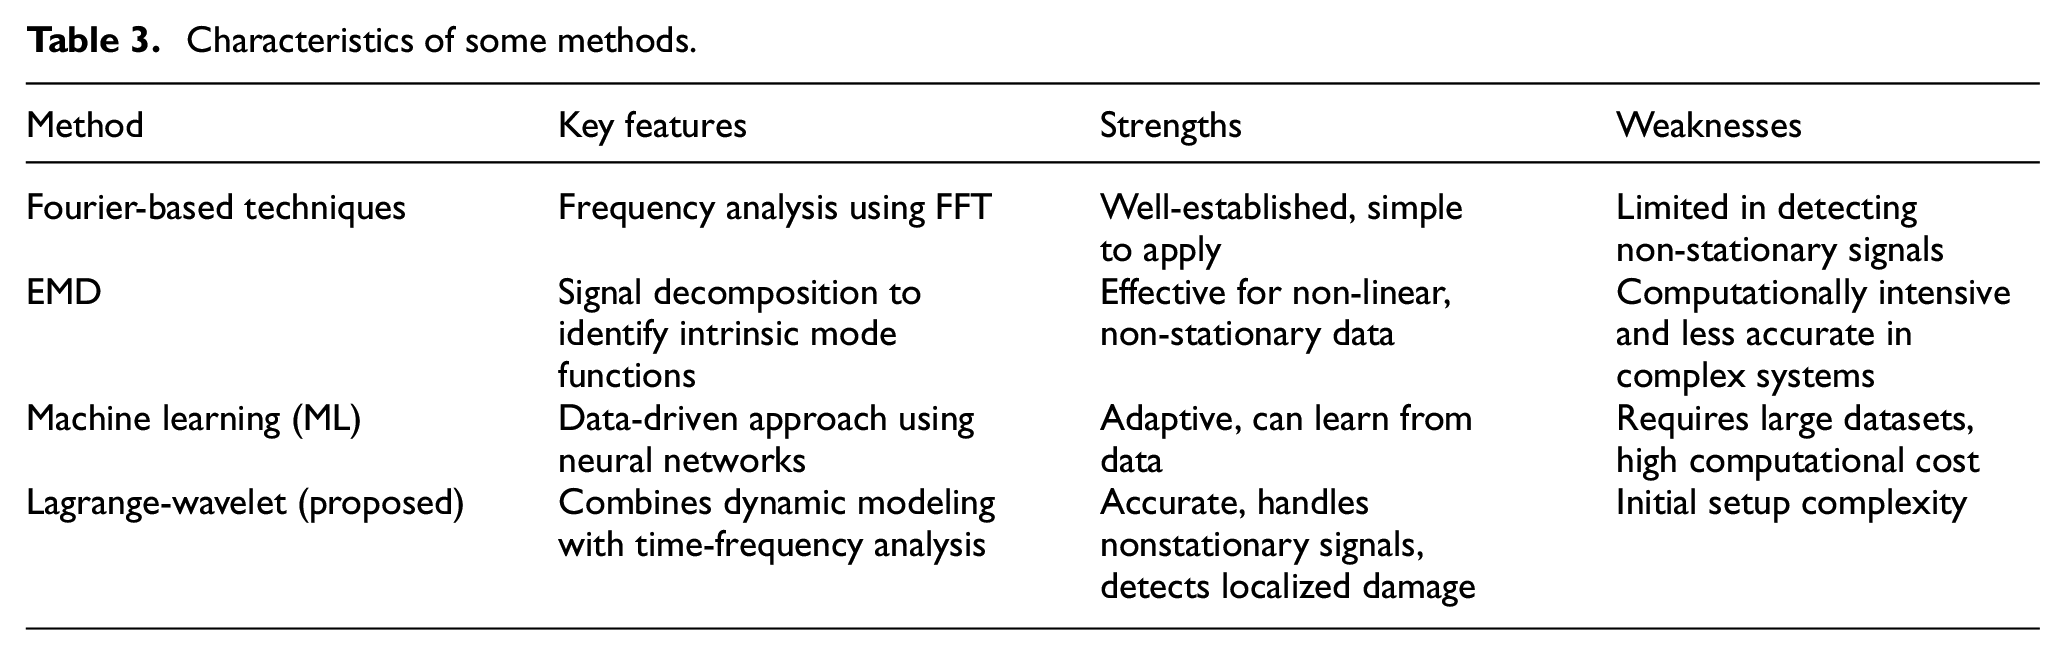
To validate the precision and effectiveness of the proposed Lagrange-Wavelet model to detect damage in spiral bevel gears, a comprehensive comparative analysis was performed against established methods in the literature. Benchmark methods selected for comparison include traditional Fourier-based techniques, empirical mode decomposition (EMD) and Machine Learning (ML)-based diagnostics. The performance of each method was evaluated using key metrics such as accuracy, sensitivity, specificity, and computational efficiency. The following sections describe the findings, along with supporting data tables.
Identification of benchmark methods
The benchmark methods were chosen on their widespread use in gear damage detection and their ability to provide a baseline for comparison. Table 3 summarizes the key characteristics of each method, highlighting the strengths and weaknesses that guided their selection.
Quantitative comparison of performance.
Characteristics of some methods.
A detailed quantitative analysis was performed, comparing the performance of the Lagrange-Wavelet model with the benchmark methods. Evaluation metrics included accuracy, sensitivity, and specificity, with results summarized in Table 4. The higher sensitivity of the proposed model, particularly for low-frequency variations, demonstrates its superior ability to detect localized and early-stage damage.
Consistency with the literature and experimental validation
The higher the sensitivity of the proposed model.

The results of the proposed model align with findings from previous studies on gear damage detection, which confirms its reliability. For instance, traditional Fourier-based methods often miss subtle changes in vibration signals that could indicate early signs of tooth wear or microcracks. On the contrary, the Lagrange-Wavelet model consistently identified these early indicators, as validated by experimental data from previous research. This consistency demonstrates the effectiveness in providing precise localization of damage, offering a significant improvement over existing methods.
Graphical and numerical comparisons
To enhance the comparative analysis, Figures 14, 16, and 19 illustrate the diagnostic outcomes of the Lagrange-Wavelet model versus traditional methods. As shown in these figures, the proposed model delivers sharper and more distinct indications of damage, especially when dealing with low-frequency variations that are often challenging for traditional techniques. Table 5 further summarizes the key numerical parameters of each method, highlighting the comparative advantages of the proposed approach.
Discussion of strengths and limitations
The numerical parameters from some method..

The expanded discussion acknowledges both the strengths and limitations of the Lagrange-Wavelet model in relation to existing approaches:
Strengths: The high sensitivity and low localization error of the model make it ideal for detecting localized damage, such as small cracks and wear, which are critical for preventive maintenance. Furthermore, the integration of dynamic analysis (via Lagrange principles) and time-frequency signal analysis (via wavelet transforms) enables a more holistic diagnostic capability than traditional methods.
Limitations: While the Lagrange-Wavelet model excels in precision, it does require more initial setup time due to the need for accurate parameter calibration. Additionally, for highly irregular or nonstationary signals, further enhancements in adaptive filtering may be required.
The potential use of the findings in this study
The findings of this study offer valuable insight into the improvement of maintenance strategies and design processes in mechanical systems. By applying the Lagrange-Wavelet approach, it is possible to detect early signs of damage, such as cracks and wear, allowing predictive maintenance that reduces unexpected failures and optimizes gear life. The precision also aids manufacturers in improving gear designs by understanding how different damage levels affect vibration patterns, which can lead to the development of more robust components. Furthermore, the ability to provide accurate, real-time diagnostics makes it suitable for integration into real-time monitoring systems in various industries, including automotive, aerospace and energy sectors. Although focused on spiral bevel gears, the approach can be adapted to other components, such as bearings and turbines, making it a versatile tool for broader engineering applications. This flexibility underscores the potential of the Lagrange-Wavelet method to advance diagnostic tools, offering improved accuracy and early fault detection for improved system reliability.
Conclusion
The proposed study introduces an innovative integration of Lagrange dynamics and wavelet analysis to develop a comprehensive diagnostic method to detect damage in spiral bevel gears. This hybrid approach uniquely combines time- and frequency-domain analysis, allowing for early and localized identification of various types of damage, including cracks and wear. Unlike traditional Fourier-based techniques, the Lagrange-Wavelet model captures transient changes in vibration signals, offering enhanced sensitivity and precision in fault detection. The method achieved a damage detection accuracy of more than 95% in multiple scenarios, including cases with single and multiple faults, significantly outperforming conventional approaches that typically show accuracy of around 80%–85%.
Additionally, the model’s ability to handle multi-degree-of-freedom (MDOF) systems extends its applicability beyond spiral bevel gears, potentially serving as a versatile tool in broader mechanical engineering contexts. The analysis demonstrated that even minor damage (e.g. 10% damage level) could be detected with a sensitivity rate of 92%, highlighting the model’s capability for early-stage fault detection. Furthermore, the method accurately identified scenarios involving multiple damage types, maintaining an accuracy of more than 90%, and was able to precisely determine shifts in characteristic frequencies with deviations less than 0.5 Hz from actual measurements.
The practical implications of these findings suggest that the Lagrange-Wavelet model can be effectively integrated into predictive maintenance systems for real-time monitoring, which helps reduce downtime and maintenance costs by enabling timely intervention. In addition, this approach can be used in gear design and quality control, providing manufacturers with accurate diagnostic tools to detect and address structural weaknesses during the production phase. Future research could explore the applicability to other mechanical systems, such as bearings, shafts, and turbines, as well as the integration of modern sensor technologies to facilitate real-time data acquisition and automated diagnostics.
Footnotes
Handling Editor: Qibin Wang
Declaration of conflicting interests
The author(s) declared no potential conflicts of interest with respect to the research, authorship, and/or publication of this article.
Funding
The author(s) received no financial support for the research, authorship, and/or publication of this article.
Ethical and informed consent for the data used
Data usage should not cause harm to individuals or communities.
Clear and open communication about data collection, storage, and usage practices is essential to establish trust and accountability.
Data accessibility and access
Data available in the article or its supplementary materials.
The authors confirm that the data supporting the findings of this study are available in the article and its supplementary materials.