
Abstract
Jet impingement quenching as one of the most effective cooling methods is widely applied in many industrial fields. When a subcooled jet strikes the hot surface, the wetting front propagates outside after the wetting delay accompanied by high-frequency fluctuations. To elucidate the propagation behavior of the wetting front and its fluctuation characteristics, the quenching experiments that an upward water jet with different velocities and subcoolings impacted onto a hot nickel block with an initial temperature of 280°C were conducted. The transient transition boiling associated with the intermittent wet and dry situations around the wetting front was quantitatively analyzed based on the visual observation and fast response surface temperature measurement technique. The liquid-solid contact period near the wetting front, under the late transition boiling regime, spans the range of 494–590 µs. This time interval is comparable to the period of disturbance waves induced by the Plateau-Rayleigh instability of the jet. Furthermore, fluctuation amplitude of the wetting front diminishes from 0.8 to 0.2 mm as it propagates. The order of magnitude and the trend of variation in the fluctuation amplitude with respect to the wetting front radius align with theoretical calculations without considering boiling heat transfer effects.
Keywords
Introduction
Jet impingement quenching is one of the most effective cooling methods by impacting the coolant onto a heated surface. The heat transfer coefficients typically surpass those observed in pool boiling systems significantly. This enhancement is attributed to the penetration of a circular jet through the protective vapor film that covers the hot surface, a phenomenon driven by the Leidenfrost effect. Jet quenching cooling technique finds extensive application in various domains, including material processing, emergency cooling systems for nuclear reactors, and thermal management of high-density electronic equipment. The jet emanates from the nozzle exit in an axial direction and, upon impingement, deflects radially toward the wall jet region. 1 A circular wet area is formed around the stagnation point once the direct liquid-solid contact appears.2,3 The peripheral boundary of this wet area, termed the wetting front,4–6 initiates radial propagation after the wetting delay7,8 or resident time. 9 Various boiling regimes including single-phase convection, nucleate boiling, transition boiling, and film boiling coexist on the cooling surface, whose distributions evolve dynamically with the radial propagation of the wetting front.10–16
The propagation velocity of the wetting front plays a crucial role in the performance of jet impingement quenching, as it dictates the overall cooling rate. Kumar et al.17,18 calculated the wetting front velocity by the period necessary for it to move a distance between two thermocouples measuring the sites at the beginning of a fast reduction in temperature. Karwa et al. 19 reported that the wetting front velocity on a cylindrical steel surface reduced for the downstream parallel flow region as the cooling time elapsed. Agrawal et al.20–22 observed a comparable phenomenon on a hot stainless steel surface, where the wetting front velocity was notably slower at downstream locations compared to regions near the stagnation point. Another common method of evaluating the wetting front velocity is to establish the relationship between the instantaneous wetting front radius rwf and the elapsed time t, as given in equation (1),23–25

where a and n are the constants that depend on the jet velocity, diameter, and subcooling as well as the initial surface temperature. Mitsutake and Monde 13 reported that a linearly changed with the jet velocity and subcooling, while n only depends on jet subcooling. Narayan and Fritsching 26 experimentally observed that the rwf can be quantitatively represented by a power law rwf = 11.98t0.4439 for the Al-alloy quenching with uj = 17.7 m/s and Ts0 = 400°C. Oliveira et al. 27 conducted jet cooling experiments near industrial conditions on a large nickel plate. They found that a and n fell within the ranges of 8.25–30.0 and 0.416–0.589, respectively. Abotaleb et al. 28 recorded the propagation of the wetting front on a casted leaded-bronze block impinged by a circular water jet. Based on the regression analysis, they calculated a = 7.3Rej0.4(ΔTsub/Ts0) and n = 0.0019Rej0.5(ΔTsub/Ts0)0.2 to estimate the wetting front velocity. The values of n in these studies, which ranged from 0 to 1, also essentially reflected the gradual decrease in wetting front velocity (uwf = antn−1) as it progressed downstream.
Numerous researchers have conducted extensive investigations into the impact of various operating parameters on the propagation velocity of the wetting front. Akmal et al. 25 explored the impact of jet velocity and subcooling, noting that the wetting front velocity increases with the increase of jet velocity, however, such an effect is less pronounced with lower subcooled liquid. The higher jet velocity not only enhanced the convective heat transfer but also promoted the breaking of the protective vapor film on the hot surface. Filipovic et al. 29 agreed that the wetting front velocity increased with the rise in jet velocity and subcooling. Mitsutake and Monde 13 found that the wetting front movement on a steel surface is faster than that on a copper surface due to its lower thermal inertia. Mozumder et al. 15 experimentally concluded that the wetting front velocity increased with the rise in jet velocity, subcooling, surface thermal conductivity, and the reduction in initial surface temperature. They also elucidated that these findings were only valid for the shorter wetting delay conditions.
In actuality, the propagation of the wetting front is accompanied by high-frequency fluctuations arising from transient transition boiling, which encompasses unsteady and heterogeneous phenomena characterized by locally unstable wet and dry patches. The principal challenge in investigating the fluctuation characteristics of the wetting front during its propagation process lies in the capture of high-frequency liquid-solid contact dynamics. The visualization of such contacts is hindered by the presence of deflected liquid films and splash droplets in proximity to the wetting front, rendering direct observation difficult. Consequently, fast-response temperature measurement emerges as a more feasible approach to indirectly infer the intermittent wetting conditions. Previous studies have predominantly relied on embedded thermocouples2,5,9,10,12–22,25,27–31 and high-speed infrared cameras4,6,11,23,26,32–34 to acquire time-dependent temperature data essential for heat transfer calculations. However, due to inherent limitations in thermocouple response times and camera frame rates, these methods are confined to capturing spatiotemporal-averaged temperature variations alone. Therefore, there is a scarcity of reports detailing the quantitative fluctuation characteristics of the wetting front during its propagation, as well as the factors influencing them. The author has developed a fast response heat transfer measurement technique with thin-film thermocouples. 35 The developed temperature sensor has high-temperature proof and a high-frequency response of 100 kHz, which is indispensable to understanding the transient transition boiling phenomenon. The main objectives of this paper are to investigate the propagation behavior of the wetting front and its fluctuation characteristics during the subcooled jet impingement quenching process. The transition boiling in the vicinity of the wetting front was quantitatively explored based on the visual observation and fast response heat transfer measurement technique. Furthermore, the influences of the dominating parameters for the expansion of the boiling region such as jet velocity and subcooling were analyzed.
Jet impingement quenching experiment
Experimental setup
The propagation behavior of the wetting front and its fluctuation characteristics during a subcooled jet impingement quenching process were explored based on visualization and fast response temperature measurement technology. The schematic of the jet impingement quenching experimental set-up is shown in Figure 1. A hot nickel block (1) installed in a stainless steel heater container (3) is quenched by an upward subcooled water jet from a circular nozzle (13). The water is supplied from the storage tank (15) through an electromagnetic valve (19). The velocity of the water jet is adjusted by controlling the tank pressure with an air compressor (18) and a pressure regulator (16). The subcooling of the water jet is pre-adjusted to the designated value by a tank heater controller (16) and further corrected by a nozzle heater controller (21). The nickel block (1) is heated to a specific temperature from the back side by a band heater (3). The external heater container (2) is wrapped with rock wool insulation to minimize heat losses. The wetting front behavior is captured by a high-speed video camera (9) from side and top directions simultaneously in the same view frame. The top view is directly observed while the top view is reflected by a mirror (12).

Schematic of the jet impingement quenching experimental set-up. (1. Nickel block, 2. Heater container, 3. Band heater,4. Band heater controller, 5. Ice box, 6. DC isolation amplifier, 7. DMM data logger, 8. PC, 9. High-speed video camera,10. Laser-photodiode detector, 11. Light source, 12. Mirror, 13. Circular nozzle, 14. Electromagnetic valve, 15. Water storage tank, 16. Tank heater controller, 17. Pressure regulator, 18. Air compressor, 19. Valve switch, 20. DC power, 21. Nozzle heater controller.).
However, due to the violent boiling phenomenon accompanied by splashing droplets near the wetting front, it is difficult to reveal its fluctuation characteristics during the propagation process from the visual observation quantitatively. A fast response temperature measurement technology is adopted to detect the invisible liquid-solid contact. The nickel block with fast response thin-film thermocouple is shown in Figure 2 and its main properties are listed in Table 1. The chromel and nickel were chosen as materials for positive and negative electrodes. The dimension of the nickel block is ϕ50 × 5 mm. A chromel wire (ϕ0.32 mm) coated with SiO2 is inserted into a fine through-hole. A nickel deposit layer with 3 μm thickness is plated on the entire surface to form the hot junction, which is located at the tip of the chromel wire denoted in red. The cold junction formed by connecting the nickel block and chromel wire with nickel wire is placed in an ice box (5) to obtain a known reference temperature (0°C). The impact point of the jet is fixed at 7.5 mm far from the measuring point by adjusting the position of the nozzle mounted on an X–Y positioning stage.

Nickel block with fast response thin-film thermocouple.
Main properties of nickel block with thin-film thermocouple.

Experimental procedure
The jet velocity uj at the nozzle exit is preliminarily calibrated based on the discharged water volume and collected duration at the tank pressure Pt of 50 and 70 kPa. The distance between the nozzle exit and the nickel surface is 40 mm, and the diameter of the round nozzle is ϕ1 mm. The nickel block is heated to 300°C then naturally cools to the initial temperature Ts0 of about 280°C, which is below the homogeneous nucleation temperature of 304°C for water at atmospheric pressure.36,37 Such an approach can make the initial temperature distribution of the nickel block more uniform. Meanwhile, the water in the storage tank is pre-heated to the subcooling ΔTsub of about 50 and 70 K. The experimental conditions are summarized in Table 2.
Three cases in jet impinging quenching experiment.

The electromagnetic valve (14) switches on once the water in the storage tank (15) and the nickel block (1) reach the designated temperature as shown in Table 2. The shooting of the high-speed video camera (9) starts in sync with the temperature recording of the nickel block after the laser-photodiode detector (10) detects the water jet. The shooting frame rate of the camera is 22 kfps and the captured data is recorded in an external HDD through the PC (8). The actual size in the images is converted in proportion based on the scale length. The thermal electromotive force at the measuring point is recorded at the sampling rate of 200 kHz with a 12-bit A/D converter. According to the temperature data at the hot junction, the local one-dimensional axial heat conduction analysis technique35,38–40 is adopted to estimate the local surface temperature and surface heat flux above the sensor.
Uncertainty analysis was applied in all stages of the present experimental procedure. Based on the mathematical technique for estimation of uncertainty propagation into experimental results proposed by Kline and McClintock, 41 the uncertainties of the measured temperature, jet velocity, and observed radial position are calculated as ±0.11 K, ±0.012 m/s, and ±0.2 mm. The experiments were conducted in duplicate for all three operational conditions and the obtained results consistently fell within the uncertainty ranges, which verified the repeatability of the findings. The experimental results under identical environmental and time were presented in this paper.
Experimental results and discussion
Behaviors of wetting front and nearby droplets
The propagation behavior of the wetting front and the splash behavior of nearby droplets were observed from the top and side directions, respectively. A typical photo image taken for Case 1 at t = 167.68 ms is shown in Figure 3. The water column jet has a slight periodic wave on the liquid-air interface due to surface tension, whose wavelength is larger than the jet diameter. This instability is known as the Plateau-Rayleigh instability and is induced by flow oscillation in a liquid supply system or eddying motions of the fluid due to friction. The vibration communicated to the nozzle renders the rate of discharge subject to a slight periodic variation. The most dangerous wavelength for which instability develops at the fastest speed is given as λj = 4.508dj. 42 The disturbance of the jet column travels from the stagnant point to the outside on the parallel flow. As shown in the top view, the single-phase convective heat transfer region is recognized as a wavy bright liquid surface area. Dense bubbles are observed on the outer area of the single-phase convection, in which the nucleate boiling takes place. It presents as a dark annular area due to the scattering of light from the irregular liquid surface. The outer edge of the dark area, namely the wetting front, exhibits high-frequency advancing and receding movements. The advancing parallel flow is separated from the cooling surface by the violent bubble ejections, and the deflected liquid sheet is finally fragmented into the droplets. The wave crests denoted by the arrows periodically rush to the wetting front, which may affect its transient fluctuation during the propagation process.

Video images taken from top and side directions for Case 1 at t = 167.68 ms: (a) top view and (b) side view.
Although there are a vast number of droplets splashing out from the surface, only the droplets downstream of the wetting front close to the surface and with clear outlines are available. As shown in Figure 3(b), the outline of the jet can be clearly found since the focal length of the camera is on the jet. Therefore, the droplets with clear outlines along the moving path should also be on the focal length of the camera. Such droplets are not only easier to be captured but a more accurate radial velocity and deflection angle can be obtained due to their parallel movement with the video images.
Figure 4 denotes a schematic of the boiling heat transfer regimes identified on the cooling surface during the disturbed jet quenching process based on the side view shown in Figure 3(b). Four kinds of heat transfer modes, namely single-phase convection, nucleate boiling, transition boiling, and film boiling, coexist on the cooling surface. The central single-phase convection and nucleate boiling regions are stably wetted. Adjacent to the stable wet area, the surface is suddenly wetted once the wetting front advances and recovers drying after the parallel flow is deflected. In other word, the wet and dry situations intermittently occur downstream of the nucleate boiling region, which is defined as the transition boiling region. The surface that remains stable drying is termed the film boiling region, where the natural convection and heat radiation are dominated. The distribution of boiling heat transfer modes is specified by three characteristic radial positions denoted as arrows in the figure, namely the onset of nucleate boiling (ONB) location, the maximum heat flux (MHF) location, and the maximum transient reachable location of wetting front.
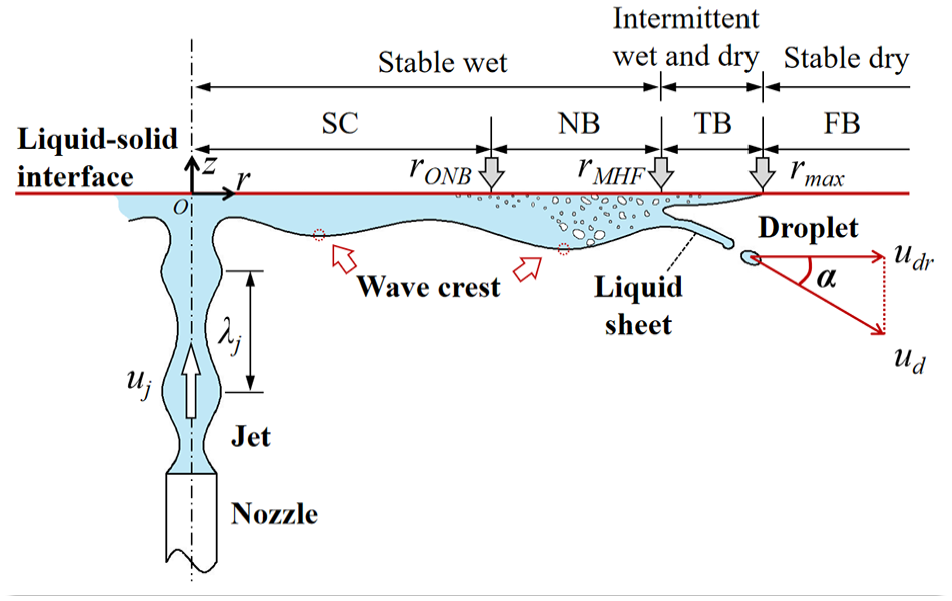
Boiling heat transfer regimes identified on the surface during subcooled jet impingement quenching process.
Figure 5 shows the propagation behavior of the wetting front with elapsed time. The wetting front positions observed in Figure 3(a) are recorded as the red, green, and blue symbols for Cases 1, 2, and 3. The recorded data is fitted by a power function and drawn as solid lines with a shaded error band of ±0.2 mm. The measuring position is denoted as a horizontal dashed line for reference. The resident time for all cases is too short to be determined. Just after the jet impingement starts, the stagnant area within around 3.0 mm recovers stable wetting. The variation of rwf is well correlated with a power function of time. In other word, the propagation velocity of the wetting front tends to decrease with the expansion of the wet area. The higher jet subcooling leads to the faster propagation of the wetting front by comparing Case 1 and Case 2. Furthermore, the higher jet velocity also causes a faster propagation of the wetting front by comparing Case 2 and Case 3. The wetting front reaches the measuring point later in Case 2 than in Cases 1 and 3, which will be further proved in the measuring temperature analysis given in the next section.
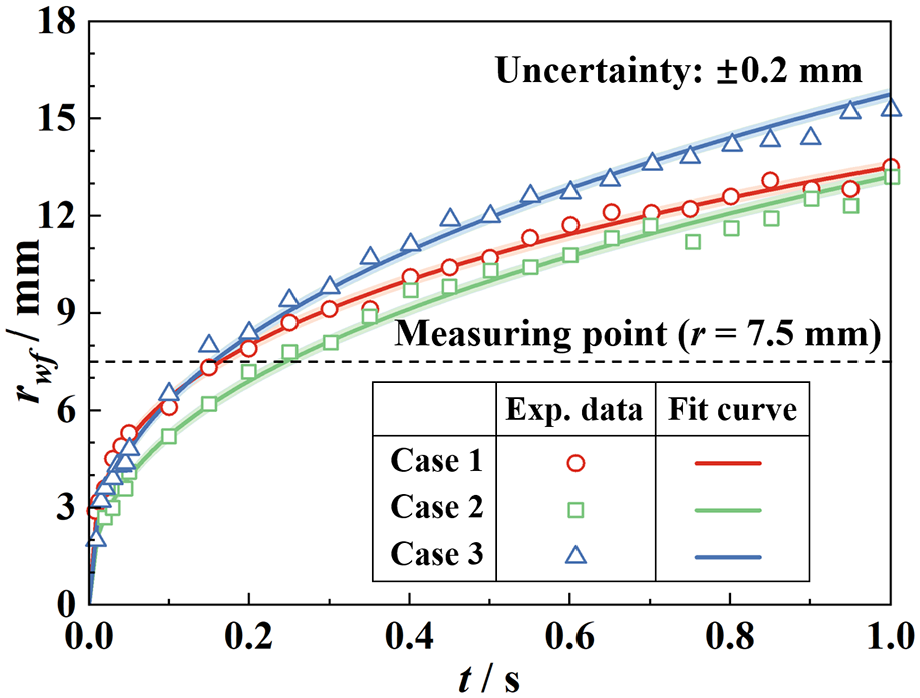
Propagation behavior of wetting front with elapsed time.
The width of boiling zone W marked in Figure 3(a) is a crucial parameter to estimate the maximum heat flux during jet impingement quenching.12,16,43 Figure 6 shows the variations of W with radial position rwf of the wetting front. The red, green, and blue symbols represent the observed data for Cases 1, 2, and 3. The propagation process is mainly divided into two stages based on the difference in the trend of W with respect to rwf. Stages I and II are represented by hollow and semi-solid symbols, whose boundary is approximately located at rwf = 12 mm. The boiling width overall increases as the wetting front propagates in the radial direction during Stage I. After that, the boiling width tends to a constant value and fluctuates within a certain amplitude of about 0.5 mm. The lower jet subcooling results in a wider boiling width during both stages of wetting front propagation. This is because the liquids with a lower subcooling are more likely to be heated to the boiling state. In addition, the higher jet velocity also leads to a wider boiling width at a specific wetting front position. The greater inertial force allows the parallel flow to overcome the resistance of the bubbles in the boiling area and reach farther. Meanwhile, it causes more dramatic fluctuations in the boiling width as shown by the green hollow symbols in Stage I.

Variations of boiling width with radial position of wetting front.
Figure 7(a) and (b) provide the characteristics of the radial velocity udr and deflection angle α of the fragmented droplets near the wetting front. The udr and α are marked in Figures 3(b) and 4. The red, green, and blue symbols represent the observed data for Cases 1, 2, and 3. As shown in Figure 7(a), the udr gradually decreases as the wetting front propagates in the radial direction. The relationship between udr and rwf is linearly fitted shown as a solid line for each case. The higher jet velocity leads to the higher udr at a specific position of the wetting front. The maximum udr reaches a high level exceeding 3 m/s at the beginning for Case 3. This may be due to the fact that the udr is majorly affected by the inertial force from the jet. The wave crest on the radial flow rushes the wetting front faster with larger kinetic energy and fragments as droplets with higher udr. However, the udr is hardly affected by the jet subcooling.

Splash behavior of fragmented droplets near the wetting front: (a) radial velocity of droplets and (b) deflection angle of droplets.
Similar to the width characteristics of the boiling area shown in Figure 6, the variation of deflection angle α of droplets during the propagation process of the wetting front is also divided into two stages. As shown in Figure 7(b), the Stages I and II are indicated by the hollow and semi-solid symbols. The α fluctuates within 20° when the radius of the wetting front is less than about 11 mm. The higher jet subcooling leads to the relatively larger α since the vapor flux generated underneath the wetting front is more intense. During Stage II, the α increases as the wetting front propagates in the radial direction. The higher jet velocity results in the larger passing velocity of the wave crest through the wetting front and delays the increase in α. Compared with the characteristic of boiling width shown in Figure 6, the α seems to start increasing as the W reaches relatively stable values.
Transient heat transfer around the wetting front
The surface temperature Tw and surface heat flux qw at the measuring point r = 7.5 mm are estimated based on the temperature data at the hot junction of the thin film thermocouple. The variations of estimated Tw and qw with elapsed time for Cases 1, 2, and 3 are shown in Figure 8(a) to (c). The black and red curves give the estimated Tw and qw. The boiling heat transfer regimes, namely film boiling, transition boiling, nucleate boiling, and single-phase convection, are also marked for each condition. The film boiling and transition boiling regimes are categorized with the characteristic times twf and tMHF, which are denoted as the triangle symbols on each Tw curve. The twf and tMHF indicate the arrival time of the wetting front and the reaching time of maximum heat flux.
As shown in Figure 8, apparent fluctuations in Tw become more intense after the wetting front arrives at the measuring point and transition boiling starts. This fact corresponds to the gradual increase in a peak of the qw variation with time. As time elapses, a rapid increase in the peak heat flux occurs. Immediately after the Tw records the highest cooling rate and decreases sharply. The qw reaches its maximum values. The maximum heat fluxes for Cases 1, 2, and 3 are 17.5, 14.8, and 15.4 MW/m2. The higher jet subcooling and velocity cause the larger maximum heat flux. After that, the nucleate boiling is dominated above the measuring point and the surface is stably wetted. The local Tw and qw perform similar fluctuations with the transition boiling regime. Such fluctuations generally calm down and the qw maintains around 5 MW/m2, where the single-phase convection takes place.

Variations of estimated surface temperature and heat flux with time: (a) Case 1, (b) Case 2, and (c) Case 3.
Figure 9(a) to (c) show the magnified variations of the measured temperature Tj at the hot junction under the transition boiling regime for Cases 1, 2, and 3. The situations under the early transition boiling regime around twf and the late transition boiling regime around tMHF are also given for each case. The measured temperature repeats a successive temperature drop and recovery after twf. Since the crude temperature change includes intense random noise from the surroundings, only the temperature changes that consistently decrease or increase over 100 μs are considered to be caused by the intermittent liquid-solid contact in this analysis. The temperature drop due to liquid-solid contact and the temperature rise due to liquid-solid separation are pointed out with the red and blue circle symbols. Such alternating wetting and drying states on the measurement point are actually caused by the high-frequency advancing and receding motion of the wetting front. In addition, the amplitude of temperature fluctuation under the early transition boiling regime is significantly smaller than that under the late transition boiling regime. Therefore, it can be deduced that the quenching at the measuring point is triggered by an increase in temporal liquid-solid contact duration.

Measured temperature histories under the transition boiling regime: (a) Case 1, (b) Case 2, and (c) Case 3.
Fluctuation characteristics of wetting front
The fluctuation characteristics of the wetting front are quantitatively analyzed based on the magnified variations of the measured temperature shown in Figure 9. Figure 10 depicts the histograms of the liquid-solid contact period with the class width of 200 μs under the transition boiling regime (twf ≤ t ≤ tMHF). The liquid-solid contact period is defined as the time interval between adjacent blue symbols pointed out in Figure 9. The red, green, and blue columns represent the count within each interval for Cases 1, 2, and 3. A specified time t* (= (twf+tMHF)/2) is introduced to distinguish the early and late transition boiling regimes. The liquid-solid contact periods are measured as τwf and τMHF for the early transition boiling from twf to t*, and the late transition boiling regime from t* to tMHF. The average values τavg and standard errors σ are calculated on the basis of N sampled data and provided in the figure. The arrows with corresponding colors indicate the τavg for each case.

Histograms of the liquid-solid contact period under the early and late transition boiling regimes: (a) twf ≤ t < t* and(b) t* ≤ t ≤ tMHF.
The dominant period of unstable liquid-solid contacts causing major temperature drops is limited to 1 ms under the early transition boiling regime, as shown in Figure 10(a), the average values of τwf for Cases 1, 2, and 3 are 671, 650, and 585 μs, whose standard errors are 353, 354, and 285 μs. The τavg is majorly affected by the jet velocity but barely influenced by the jet subcooling. The higher jet velocity induces the lower τavg. The effects of jet velocity and subcooling under the late transition boiling regime are similar to those under the early one, as shown in Figure 10(b). However, the average value of τMHF for Cases 1, 2, and 3 are reduced to 590, 570, and 494 μs. The periods of the Plateau-Rayleigh instability of the jet, namely the passing period of wave crest through the wetting front, are calculated from λj/uj and the results for the jet velocities of 7.97 and 9.60 m/s are 566 and 470 μs, which are comparable with the average values of τMHF for the corresponding case. In addition, the average values of τMHF is closer to the disturbed period of the jet compared with those of τwf. Since the period of intermittent liquid-solid contact arises from the advancing and receding motion of the wetting front, the fluctuation period of the wetting front during its propagation process is reasonable to be considered as the period of the Plateau-Rayleigh instability of the jet.
A temperature drop caused by continuous liquid-solid contact and a temperature rise caused by continuous liquid-solid separation occurs during a liquid-solid contact period. The proportion η of liquid-solid contact duration τc to the contact period τwf or τMHF may have a significant impact on the cooling rate of the surface under the transition boiling regime. Figure 11 provides the histograms of the η with the class width of 20% during twf ≤ t ≤ tMHF. As shown in Figure 11(a), the most frequent values of ηwf are located in the range from 20% to 40% under the early transition boiling regime. The average values of ηwf for Cases 1, 2, and 3 are 42.2%, 42.1%, and 43.9%, whose standard errors are 20.2%, 19.7%, and 18.6%. The liquid-solid contact duration is slightly longer than the separation duration within one period. The ηavg is almost unaffected by the jet subcooling but exhibits a slightly larger value for Case 3 with higher jet velocity. However, the most frequent values of ηMHF convert to the range from 40% to 60% during the late transition boiling period as shown in Figure 11(b). Furthermore, the average values of ηMHF for Cases 1, 2, and 3 increase to 47.6%, 46.5%, and 50.1%. The higher jet velocity and jet subcooling result in the larger ηavg, thus accelerating the propagation of the wetting front as shown in Figure 5 and enhancing the cooling rate as shown in Figure 8.
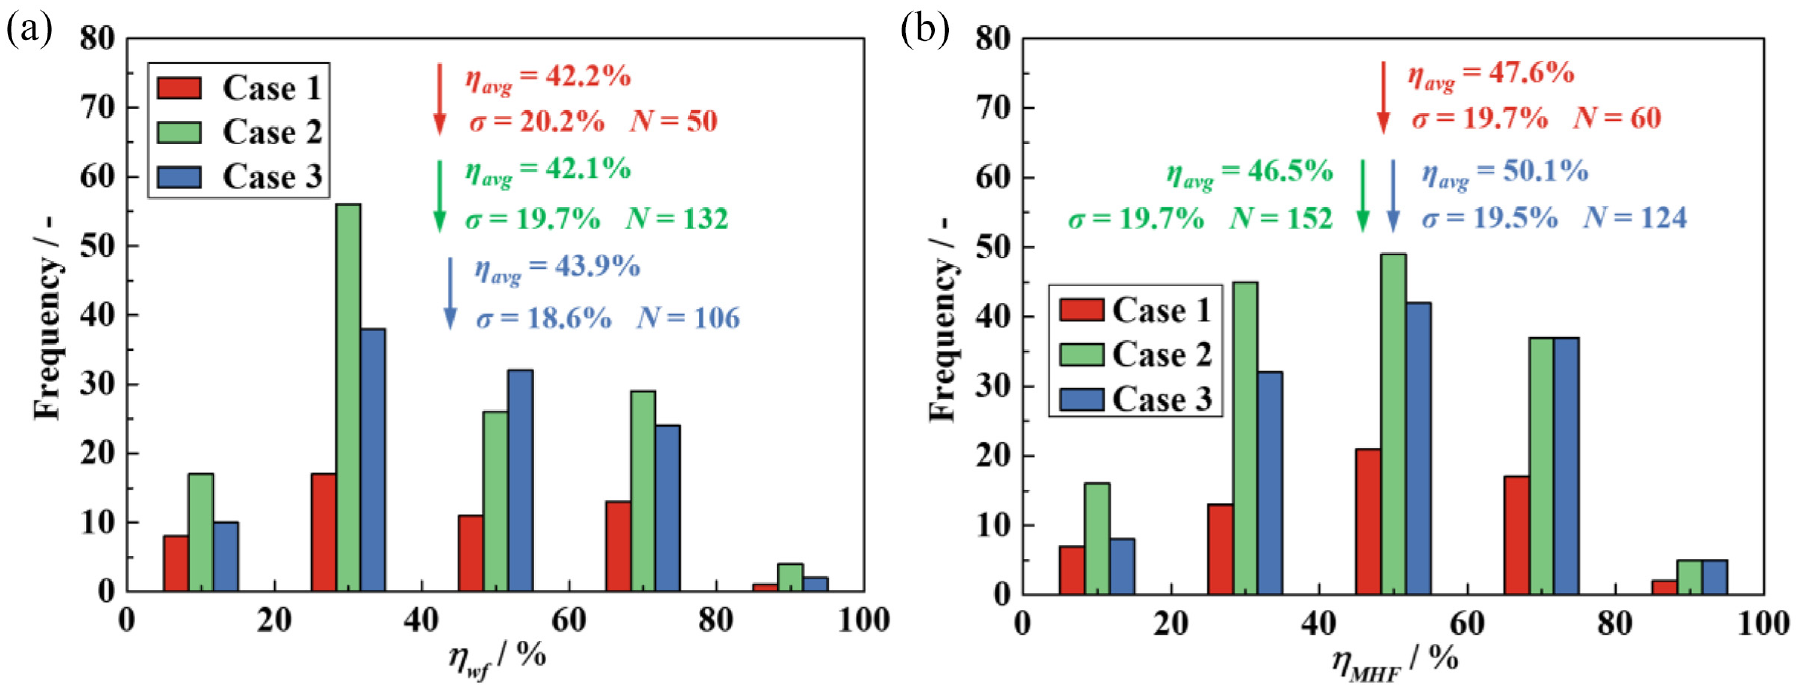
Histograms of the proportion of liquid-solid contact duration within a contact period under the early and late transition boiling regimes: (a) twf ≤ t < t* and (b) t* ≤ t ≤ tMHF.
Figure 12 represents the histograms of the temperature drop ΔT during a liquid-solid contact duration with the class width of 2 K under the transition boiling regime. As shown in Figure 12(a), the most frequent values of ΔTwf are limited within 2 K under the early transition boiling regime for Cases 2 and 3, while are located in the range from 4 to 6 K for Case 1. Besides, the average value of ΔTwf for Case 1 is larger than that for Cases 2 and 3, which means that the high jet subcooling may significantly increase the temperature drop during a liquid-solid contact period due to the stronger boiling heat transfer. The higher jet velocity as Case 3 may also enhance the boiling heat transfer but only causes a slightly larger averaged ΔTwf. The influences of jet velocity and subcooling under the late transition boiling regime are the same as those under the early regime, as given in Figure 12(b). The average values of the ΔTMHF for Cases 1, 2, and 3 all increase to 7.0, 4.2, and 3.3 K. The ΔTMHF exceeding 10 K is dominated under Case 1, which leads to faster cooling as shown in Figure 8.
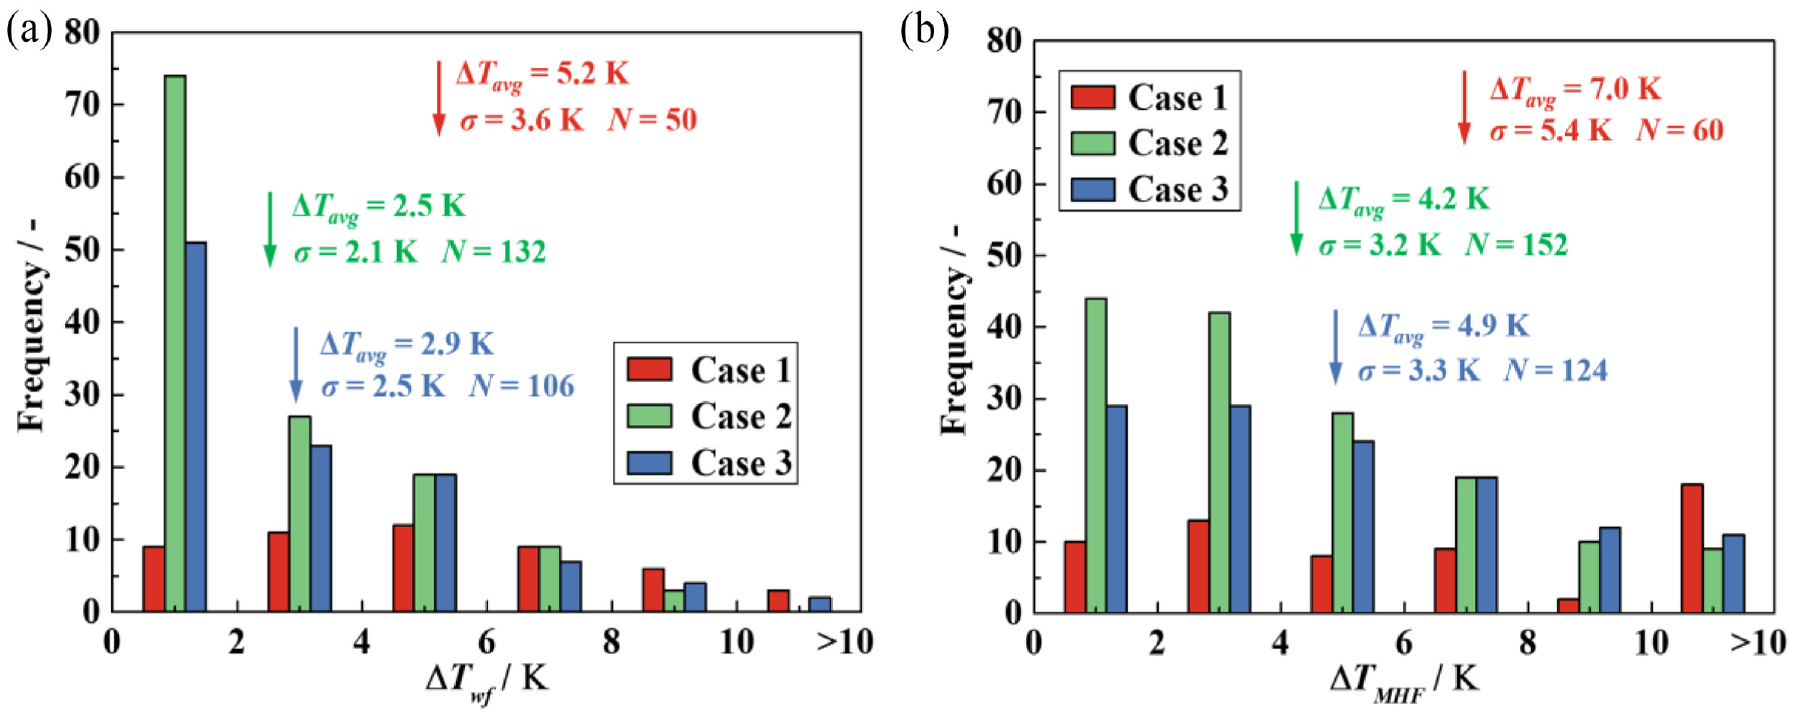
Histograms of the temperature drop during liquid-solid contact duration under the early and late transition boiling regimes: (a) twf ≤ t < t* and (b) t* ≤ t ≤ tMHF.
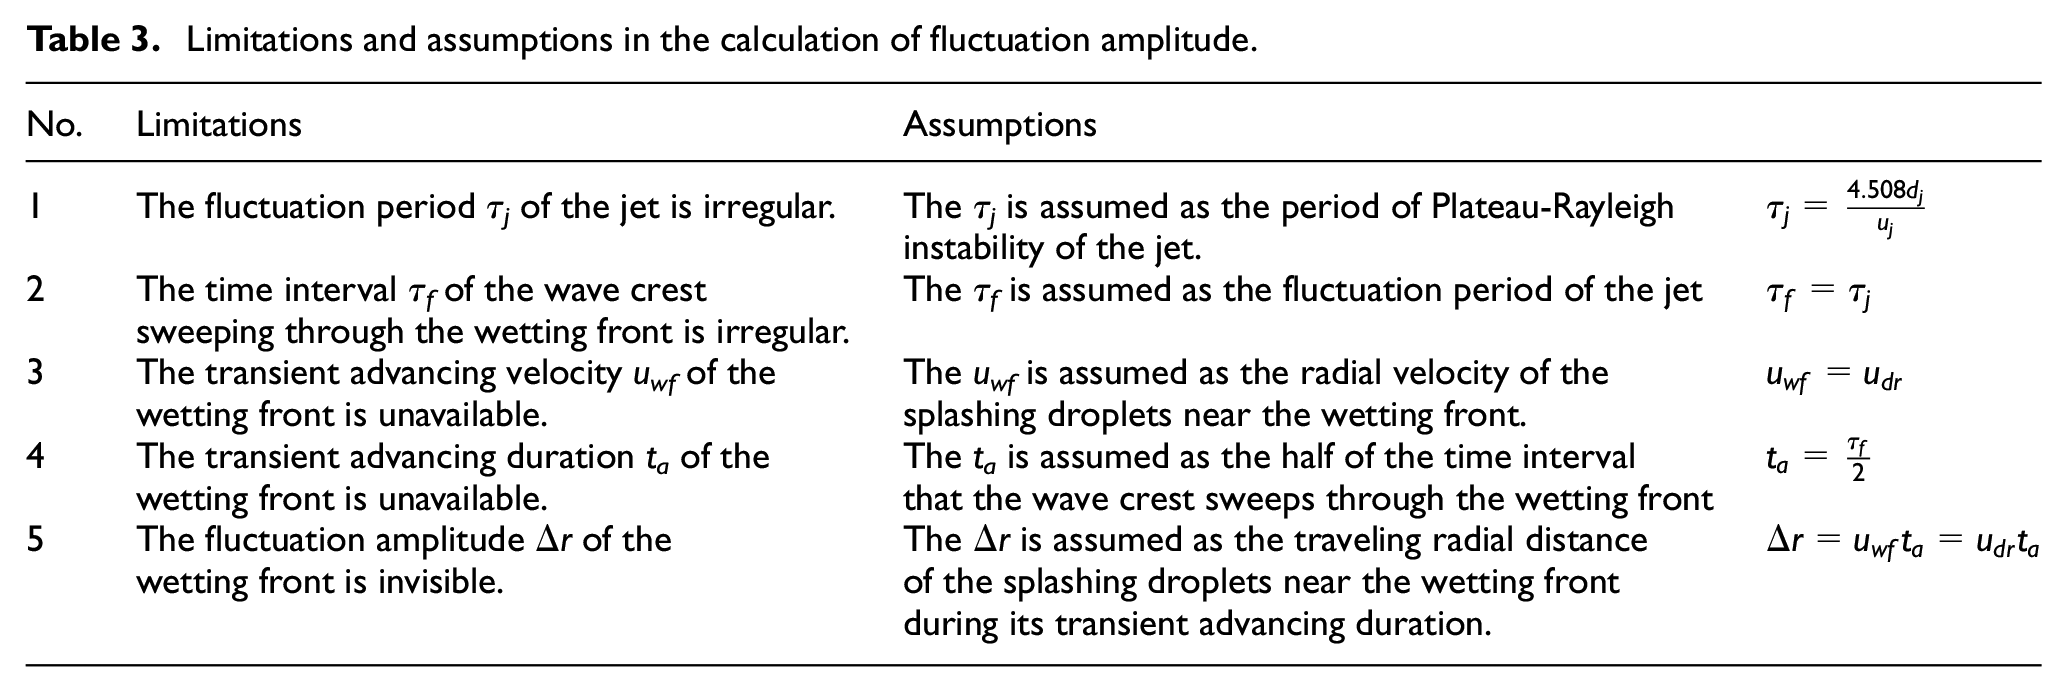
Due to the deflected liquid sheets and splashing droplets in the vicinity of the wetting front as observed in Figure 3(a), the fluctuation amplitude Δr is difficult to be distinguished clearly. The Δr may be obtained indirectly according to the transient advancing velocity of the wetting front. Because the splash kinetic energy in the radial direction of the droplets is mainly derived from the inertial force of the radial flow of the wave crests, the transient advancing velocity of the wetting front is reasonably assumed to be consistent with the radial velocity of droplet udr during its transient advancing duration ta. According to the analysis of Figure 11, the liquid-solid contact duration occupies approximately half of the contact period, which is comparable with the Plateau-Rayleigh instability of the jet. Therefore, the ta is simply calculated as τj/2. The Δr can be approximately calculated with a traveling radial distance of the wetting front during the period of ta, namely Δr = udrta. The limitations and assumptions in the calculation of Δr are summarized in Table 3.
Limitations and assumptions in the calculation of fluctuation amplitude.
The fluctuation amplitude Δr of the wetting front is calculated and connected with its radial position as shown in Figure 13. The red, green, and blue symbols represent the calculated results for Case 1, Case 2, and Case 3. The Δr generally decreases from 0.8 to 0.2 mm as the wetting front propagates from 4 to 15 mm. The relationship between Δr and rwf is linearly fitted and shown as a solid line for each case. The fit curves perform the slopes within the range from −0.06 to −0.04. Besides, the higher jet velocity obviously increases the Δr due to the larger inertial force of the wave crest. However, the Δr is barely affected by the jet subcooling.
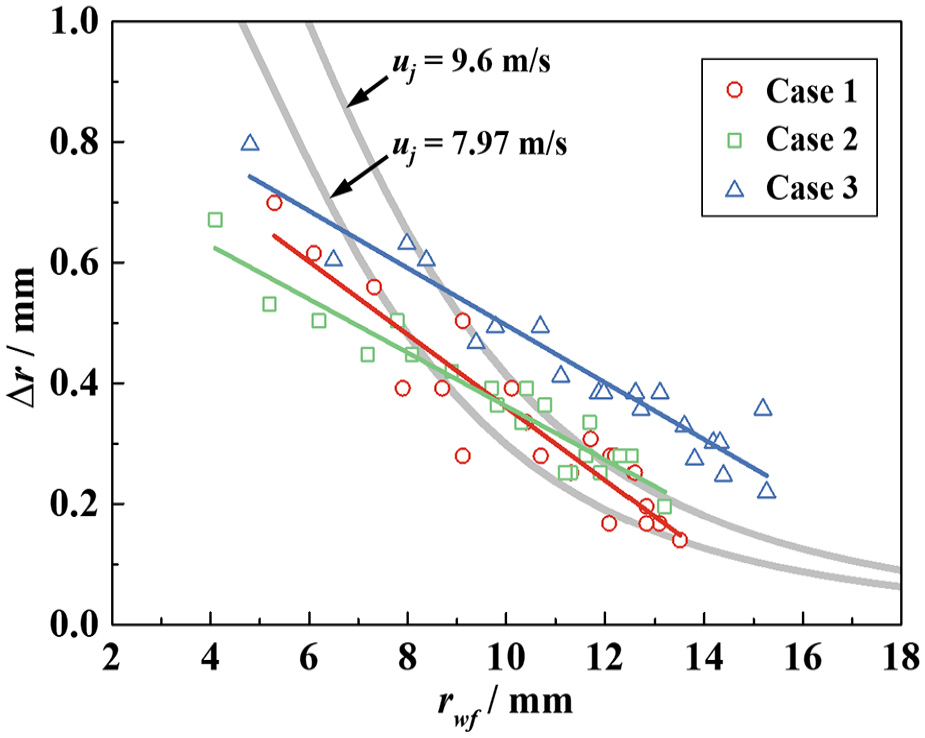
Variations of the calculated fluctuation amplitude of wetting front with its radial position.
The accuracy of the obtained fit functions between Δr and rwf for three cases is further verified through theoretical calculations. Because the liquid film thickness of the wetting front in the parallel flow during jet quenching process cannot currently be calculated and is difficult to be observed experimentally, an expression for the liquid film thickness without boiling heat transfer is directly adopted. Watson 44 applied a similarity transformation to solve the boundary layer equation and the non-dimensional liquid film thickness was derived as follows,
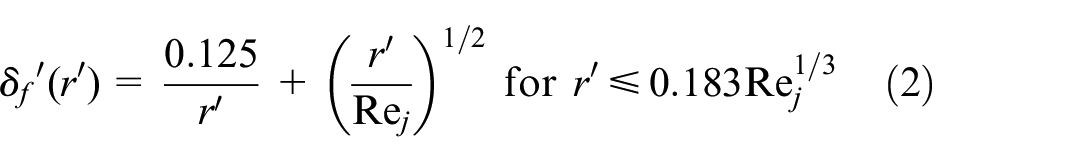
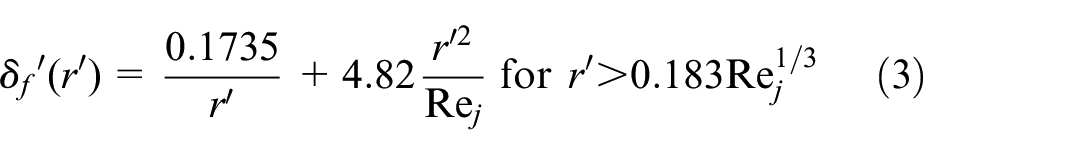
where δf denotes the liquid film thickness of the parallel flow. The non-dimensional δf′ and radial position r′ are calculated as δf/dj and r/dj. According to the mass conservation law, the moving distance of the wetting front during ta can be derived as equation (4).
The Δr calculated from equation (4) for uj = 7.97 and 9.60 m/s is dawn as gray solid lines in Figure 13. The Δr exhibits an order of magnitude of 1 mm and a decreasing tendency with rwf, which is consistent with the results calculated based on the visual observation. Since Watson’s model 41 is only applicable to the jet impingement process without boiling heat transfer, the theoretical calculation results are much larger than the experimental one at the beginning of the rewetting process. This is because the liquid film flow near the wetting front is significantly decelerated by the nucleate bubbles due to intense boiling heat transfer, thus decreasing the moving distance of the wetting front during ta. However, the bubble nucleation gradually weakens as the wet area becomes larger. Both results tend to be close to each other, which proves the reliability of the calculated Δr and the reasonability of assumptions in the present analysis. It should be noted that the difference is expected to decrease when the liquid film thickness on the boiling surface in jet quenching can be quantitatively characterized.
In this paper, the wetting front propagation behavior and its fluctuation characteristics was elucidated during the subcooled jet quenching process on a hot surface, specifically below the homogeneous nucleation temperature. However, the situations for the surface temperature exceeding the homogeneous nucleation point remain under-explored and necessitate further investigation. Additionally, future studies should endeavor to establish a comprehensive hydrodynamic model for the wetting front propagation, grounded in momentum and energy equations 45 or alternative methodologies, to advance our understanding of this phenomenon.
Conclusion
The experiments that an upward subcooled water jet impacted onto a hot surface below the homogeneous temperature were conducted with different jet velocities and subcoolings. The propagation behavior of the wetting front and its fluctuation characteristics during the quenching process were analyzed based on the visual observation and fast response surface temperature measurement technique. The conclusions are summarized as follows:
The wetting front propagates in the radial direction with high-frequency fluctuation. Its radial position behaves well as a power function of the elapsed time. The higher jet subcooling and velocity lead to the faster expansion of the central wet area.
At the commencement of quenching, the deflection angle of the splashing droplets near the wetting front fluctuates within a certain range accompanied by an increase in the boiling width. However, it gradually increases when the boiling width reaches stability.
The quenching is triggered with increasing duration of temporal liquid-solid contact associated with the major temperature drop. The contact period under the transition boiling regime is mainly limited to 1 ms. It is comparable with the period of the disturbance wave induced by the Plateau-Rayleigh instability of the jet, especially under the late transition boiling regime.
The fluctuation amplitude of the wetting front decreases with the expansion of the wet area and higher jet velocity results in a larger value. However, the influence of the jet subcooling is negligible.
Footnotes
Appendix
Notation

| Roman symbols | Tw | surface temperature | |
| dj | diameter of nozzle | W | width of boiling area |
| N | number of sampled data | ||
| Pt | tank pressure | Greek symbols | |
| qw | surface heat flux | τ | liquid-solid contact period |
| r | radius position | σ | standard error |
| rmax | maximum transient reachable location of wetting front | η | proportion of liquid-solid contact duration to contact period |
| rMHF | radial position of MHF point | α | deflection angle of splashing droplets |
| rONB | radial position of ONB point | δf | liquid film thickness of parallel flow |
| rwf | radial position of wetting front | λj | disturbance wavelength of jet |
| Re j | Reynolds number of jet | Δr | fluctuation amplitude of wetting front |
| t | time | ΔT | temperature drop during a liquid-solid contact duration |
| t* | characteristic time distinguishing early and late transition boiling regimes | ΔTsub | jet subcooling |
| uj | jet velocity | ||
| udr | radial velocity of splashing droplet | Subscripts | |
| tMHF | reaching time of maximum heat flux | avg | average value |
| twf | arrival time of wetting front | MHF | under late transition boiling regime |
| Tj | measured temperature at hot junction | wf | under early transition boiling regime |
| Ts 0 | initial solid temperature | ||
Acknowledgements
The authors acknowledged Mr. Hiroshi Nakai for his help in building the experimental setup and conducting the experiments.
Handling Editor: Aarthy Esakkiappan
Declaration of conflicting interests
The author(s) declared no potential conflicts of interest with respect to the research, authorship, and/or publication of this article.
Funding
The author(s) disclosed receipt of the following financial support for the research, authorship, and/or publication of this article: This work was supported by the National Natural Science Foundation of China [grant number 52206057].