
Abstract
Five-axis machine tools are well-suited for processing complex surface parts. However, during the machining process, thermal error can have a significant impact on the machining accuracy. To propose an accountable on-line compensation method for five-axis milling, this paper developed a new experimental device for in-situ measurements of thermal-induced displacements in both X- and Y-axis directions. With the help of this self-developed device, a five-axis milling experiment was carried out to collect the temperature change of key thermal points and thermal-induced error during continuous impeller milling. A thermal error prediction model was established with collected data and a thermal error compensation system was developed for the five-axis milling accordingly. The following validation experiment showed that the surface profile error of the blades of milled impeller can be stabilized within the range of 0.1 mm with the help of proposed the thermal error compensation system. The results of the validation experiment proved the effectiveness of the proposed method for the reduction of thermal error during the five-axis milling.
Introduction
There are many different types of manufacturing errors affecting the geometric accuracy in the machining process of any complex surface parts and therefore their application performance and service life. Among these errors, thermal error contributes more than 50%–60%.1–4 Many researches, which tried to estimate and compensate the thermal-induced error by developing precise error model, had been reported in the literature. By placing two capacitive sensors at the worktable, Liu et al. 5 quantified the thermal error by measuring the distance variation between two capacitive displacement sensors. To increase the thermal stability of a five-axis machine tool, Mayr et al. 6 installed touch probes on the spindle and worktable respectively and accordingly measured the thermal-induced displacement of relevant thermal key points on both the B-axis and C-axis. With help of measured data, corresponding thermal error compensation model was developed. For a better machining process of a 3-P(Pa)S parallel-type spindle head, Li et al. 7 measured the position and orientation of the end effector as well as the temperature change of the thermal key points being selected using global temperature sensitivity index (GTSI) and accordingly a thermal error compensation model was presented. Ibaraki et al. 8 built a non-contact laser light barrier system to measure the thermal-induced rotary axis location error and hence the thermal error of the machine tool. Based on thermal adaptive learning control methodology, Zimmermann et al. 9 presented a new thermal error compensation model with the inputs to this model being automatically adapted. With this setting, the robustness of the thermal error compensation model can be improved. To curb the thermal error of diamond turning machine, Narendra Reddy et al. 10 used three capacitive sensors to simultaneously measure thermal-induced displacements in three different directions and according developed a thermal error compensation model based on feed-forward backpropagation neural network and regression analysis. Mareš et al. 11 used built-in probes to monitor the thermal-induced displacements of selected thermal key points. With collected data, they developed a thermal error model to compensate thermal error during the machining process. Liu et al. 12 introduced a digital twin system into spindle thermal error modeling to achieve thermal error modeling and compensation across varied operational conditions. Based on the experimental data of thermal error measurements of Leaderway-V450 CNC machine tools at different times of the year, Liu et al. 13 proposed a principal component regression (PCR) modeling algorithm to eliminate the effect of covariance and established a model for thermal error compensation of the machine tools. To achieve thermal error compensation, Yao et al. 14 proposed a thermal error prediction composite model combining the grey model and the least squares support vector machine (LS-SVM), which demonstrated high accuracy and robustness under complex machining conditions. By combining particle clustering and grey correlation analysis for temperature measurement point selection, Dai et al. 15 employed a deep extreme learning machine to build a thermal error prediction model, which showed excellent performance in thermal error compensation tests. Yan et al. 16 proposed a novel thermal error modeling method that took into account the variation of the machine tool’s temperature field, and experimentally verified the accuracy and robustness of the prediction model. Tan et al. 17 proposed a segmented fused least squares support vector machine (SF-LSSVM) thermal error modeling method, which considers the time-varying characteristics of critical temperature points.
Although many studies had made great contributions to the research field of thermal error compensation, there are some uncertainties in their experimental designs: instead of introducing cutting heat by actual part machining, the machine tools were gradually heated by spindle idling until it reached to the heat equilibrium. That would cause the temperature changing trend of machine tool in the experiment was obviously different from the real case as well as the thermal error developing trend. Hence, data collected in the spindle idling experiments may introduce error in the modeling of thermal error therefore the robustness of corresponding compensation method.
The goal of this study was to: (1) build a new data acquisition platform capable to in-situ measure the thermal-induced displacement during the five-axis machining; (2) develop a mapping model between temperature change and thermal error of the five-axis machine tool; (3) propose a novel thermal error compensation system for the KMC600SU five-axis machine tool; (4) verify the effectiveness of the newly proposed thermal error compensation system through validation cutting experiment.
Platform construction and experimental data collection
In order to build the mapping relationship between the temperature change of key thermal points and thermal-induced displacements in different directions, an experimental platform was built up with a KMC500SU-type five-axis machine tool to collect relevant data. The hardware of the experimental platform was shown in Figure 1. In order to avoid the cable winding due to the rotational movements of A-axis and C-axis during the five-axis machining, a self-developed direct measurement device, which can measure the thermal-induced displacement between the workpiece and cutting tool in semi-real-time during milling, was introduced in the experiment. The parameter configuration of this device is shown in Table 1. Eight PT100 thermometers with a sampling rate of 30 Hz were adopted to monitor the status of eight pre-selected points. During the milling process of the impeller, the machine tool spindle performed linear motion in the X, Y, and Z directions to achieve longitudinal and transverse machining, while the A and C rotational axes rotate in space to process opposing surfaces, side surfaces, and inclined surfaces. Therefore, the key temperature measurement points were distributed around the spindle of the machine tool and near the C-axis rotational axis. The distribution of selected points is shown in Figure 2 and Table 2. Note that in the experiment, as typical complex surface workpieces, impellers with same specifications were continuously machined in this experiment.

Construction of the experimental platform.
Parameterization of the in-situ thermal displacement direct detection device.


Arrangement of temperature sensors.
Installation position of the temperature sensor.

Table 3 listed the main processing parameters used in the data acquisition experiment. The experiment cycle included both the rough and finish machining. It takes about 30 min for the machine tool to finish machining one blade each time and each direct measuring process took around 30 s. The experiment procedure was detailed as below (as shown in Figure 1: HL-G1 Displacement Sensor): the milling cutter moved to the pre-cutting position; milling cutter cut the blade; after each blade was processed, the milling cutter moved to pre-set position; the upper computer sent instruction to open the lubricator-proof door of data collection module and activate two laser displacement sensor to measure the distance between the tool and the sensor in both X- and Y-axis directions. As shown in Figure 1: structure of data acquisition tool, the collected data was sent to the STM32 through the RS-485 and then sent back to the upper computer through Bluetooth; the milling cutter moved to the pre-cutting position; the procedure repeated until all six blades were finished. Meanwhile, the thermometers continuously recorded the temperature change of eight key thermal points and the temperature data was sent back to the upper computer as well. With this procedure, the experimental database was established (Figure 3).
Major machining parameters used in the experiment.


Data acquisition flowchart.
In order to establish the mapping relationship between the temperature change and the offset distance, the offset distance and the temperature data of the thermal key points should be synchronized at first.
Sensitivity analysis of pre-selected temperature point
Figure 4 showed the temperature data received by eight thermometers in an impeller finishing process. As shown in Figure 4, in the machining period, the machining process would be suspended five times to ensure that the tool moved to the preset measurement position, hence there were some points where the temperature had a downward trend during the blade processing, and the temperature returned to normal when the subsequent processing continued.

The temperature change of eight key thermal points during blade finishing.
For the better modeling of thermal error, a sensitivity analysis of eight pre-selected points was conducted first, in which the offset distance was set as the dependent variable in the correlation analysis of eight key thermal point. Before the sensitivity analysis based on the collected temperature data, it was necessary to verify whether the data conformed to normal distribution. The Shapiro-Wilk test method 18 was used to check the data collected at eight points, in which once the p-value was greater than 0.05, it indicated that it conformed to the normal distribution. The test results are shown in Table 4.
Shapiro-Wilk test results.

The multiple linear regression algorithm then was used here to regress the independent variable and dependent variable. The objective function is shown in equation (1):

In the formula, y t is the dependent variable, x1, x2, x3, x4, x5, x6, x7, x8 were the independent variables, and b was the constant term. The mapping function between the input data and the target data can be constructed using ordinary least square (OLS), which can be formulated as:

When the value of RSS was minimum, the sum of squares of the distance from the fitting curve to each point would the minimum accordingly. The parameter estimation and test results were shown in Table 5.
Parameter estimation and test results.

It can be seen from Table 5 that only the p-value of the independent variables Tem2, Tem5, and Tem6 are less than 0.05. Therefore, in the subsequent establishment of the model, only the key thermal points (Tem2) on the spindle and other two points near the A-axis and C-axis (Tem5, Tem6) were adopted in the following modeling.
Development of thermal error prediction model
After the locating the key thermal points, the mapping model between the temperature change of selected key thermal points and the thermal-induced deviations in X- and Y- axis direction was developed by using the support vector regression (SVR) algorithm,19,20 as shown in Figure 5. In the modeling, the SVR model used the RBF (Radial Basis Function) neural network as a specific kernel function.

RBF neural network.
RBF neural network was trained to learn the mapping from input space to kernel space, while SVR were trained with kernel space data. This allowed SVR to efficiently deal with non-linear data by transforming the data into a higher dimensional space, resulting in model fitting curves in the X-axis and Y-axis directions. To use the SVR learning algorithm to fit the thermal offset, follow the steps below were performed sequently:
(1) Both the temperature data of selected key thermal points and the measured corresponding offset data were imported into the model as training data.
(2) Using the proposed SVR learning algorithm combined with the RBF neural network to train synthetic mathematical structures.
(3) After a series of iterations, using the test dataset to judge the predictive performance of the model.
(4) Based on the performance evaluation results, the parameters such as regularization parameters and kernel coefficients of the error term used in SVR were adjusted accordingly.
(5) Repeating the procedures above until the model prediction accuracy can be accepted.
The prediction results of post-trained model were shown in Figure 6.

Model fitting results: (a) X-axis offset fitting curve and (b) Y-axis offset fitting curve.
The Mean Squared Errors (MSE) of the X-axis prediction model and the Y-axis prediction model were
Development of thermal error compensation model
To effectively compensate the thermal error, the mapping relations between the respective offsets required in both the A and C axes and those from the model needs to be built first by using the multi-body system kinematics theory. 21 The offsets on the tool can be reflected to the machine tool through homogeneous coordinate transformation to compensate the error (Figure 7).
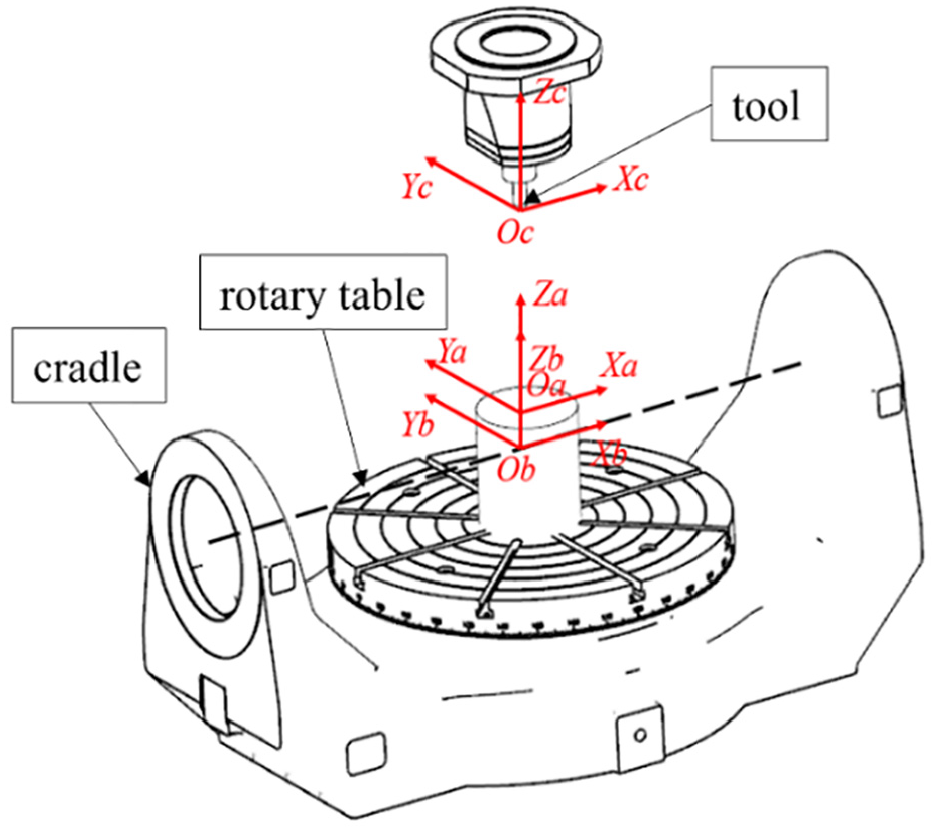
Schematic diagram of multiple coordinate systems of the five-axis machine tool.
The machine tool used in the experiment was a double turntable machine tool with A–C structure, and its structure was shown in Figure 8, wherein, OaXaYaZa, ObXbYbZb, OcXcYcZc were the machine tool system, machine tool coordinate system and tool coordinate system respectively. As shown in Figure 9, L was the vector direction of the tool axis. Under normal conditions, the tool axis vector direction L was supposed to be parallel to Z c axis. When the thermal-induced offset occurred, to be consistent with Zc direction, two-step coordinate transformation can be made as follows: the tool axis vector L was rotated counterclockwise around Z c axis by the angle of C to obtain the vector L’; the vector L’ was rotated counterclockwise around X c axis by the angle of C. To realize this coordinate transformation, the rotary table needed to rotate counterclockwise by the angle of C around the rotary axis, and then the cradle rotated by the angle of A around its axis. The rotation angles A and C can be formatted as follows:


where, Lx, Ly, and Lz were the offsets generated in the X, Y, and Z direction respectively.

Angle of tool axis vector in the rotation motion.

Hardware design of thermal error compensation system.
When the thermal-induced deformantion of machine tool occurred, it can be understood that the tool center point was offset relative to the workpiece coordinate system. Therefore, it was necessary to find out the coordinates of the tool center point O c in the machine tool coordinate system ObXbYbZb after the rotation of the turntable. The respective rotation angles of the rotary table and the cradle can be calculated by equations (6) and (7), where the Lz was assumed as 10 μm. This was because measured thermal-induced offset in the Z direction quickly stabilized at 10 μm in the experiment.
The workpiece coordinate system OaXaYaZa was transformed to the machine coordinate system ObXbYbZb, and the distances between the origin of workpiece coordinate system and that of machine coordinate system were defined as

When the machine tool workbench was used as a reference, the cutter rotating by the angle of C around the Z axis can be represented by the following transformation matrix

Since the rotation angle A of the tool around the X axis was equivalent to the rotation angle A of the machine tool workbench in the opposite direction, corresponding rotation transformation matrix was:


where
The hardware of the compensation system were shown in Figure 9. The communication service based on XML string can be provided through the socket interface of TCP/IP protocol.
The operation process of thermal error compensation was: (1) PT100 collected temperatures of three key thermal points; (2) Inputting the data into the thermal error prediction model and calculating the offset values; (3) calculating corresponding compensation values by using proposed thermal error compensation model; (4) After each blade being finished, sending compensation values to the CNC system to realize the coordinate offset thereby reducing the thermal-induced displacement between the tool and workpiece.
Verification of thermal error compensation model for five-axis machining
To verify the proposed thermal error compensation method, two identical impellers were machined with same cutting parameters but without and with compensation operation, which were named as impeller A and impeller B respectively. To measure the geometric accuracies of machined impellers, the HEXAGON100201662CA-type three-coordinate measuring machine was used to scan the surface profile of blades of machined impellers, as shown in Figure 10. The measured results were shown in Table 6.

Measuring the surface profile of impeller blades.
Surface profile data of blades (mm).

It can be seen from the data that without the thermal error compensation, the geometric deviation gradually appeared in the continuous process, in which deviations for fifth and sixth blades were relatively large. Comparatively, the deviation values of the impeller B were smaller. The PC-DMS software was used to generate the diagram of the deviation value from the data in Table 6, as shown in Figure 11. The red part indicated that the deviation was out of acceptance range. Compared with the uncompensated impeller, the compensated one has smaller deviation value and more uniform deviation data.

Measurement results of impeller blades: (a) uncompensated impeller and (b) compensated impeller.
To prove the robustness of proposed thermal error compensation method, seven other identical impellers were machined, during which the processing parameters, processing environment and compensation scheme were set to the same. After each impeller was processed, its contour index was measured instantly, and the measurement results were shown in Figure 12. As can be shown in Figure 12, the number of blades within the defined error range of 0.1 mm accounted for 97.62% of all blades. Therefore, the reliability of our newly proposed thermal error compensation method was proved.

Surface profile accuracies of blades of machined impellers.
Conclusion
In order to reduce the influence of thermal error for five-axis machining, a new thermal error compensation method was proposed and its reliability was experimentally verified. The main contributions of this study were as follows:
(1) A in-situ thermal-induced displacement direct detecting device suitable for five-axis machining was proposed, which was capable to measure the relative position deviation between the tool and the worktable.
(2) With the help of the self-developed thermal displacement detecting device, a thermal error prediction model was established for impeller five-axis machining based on the temperature change of selected thermal key points and the measured values of thermal-induced displacements in different directions.
(3) A kinematics analysis was conducted to model the relationship between the predicted thermal error and the compensation amount needed.
(4) Based on this mapping model, a new thermal error compensation system, which coupled with the GNC60 machine tool operating system through Ethernet, was established. By equipping with this system, the KMC500SU-type five-axis tool can compensate thermal error during the continuous machining process of impellers.
(5) The results of subsequent impeller milling experiments showed that with the help of the compensation system, the surface profile deviation of the impeller blade can be limited to the error range of less than 0.1 mm.
In conclusion, the new thermal error compensation model and the corresponding compensation system can reduce the impact of thermal in the five-axis machining. This method can contribute to maintain the geometric quality of the complex surface parts.
Footnotes
Handling Editor: Jinting Xu
Declaration of conflicting interests
The author(s) declared no potential conflicts of interest with respect to the research, authorship, and/or publication of this article.
Funding
The author(s) disclosed receipt of the following financial support for the research, authorship, and/or publication of this article: This research was financially supported by the Natural Science Foundation of Chongqing (No. CSTB2023NSCQ-LZX0068); Chongqing Talent Program (No. CQYC20210305206); National Natural Science Foundation of China (No. 52205144).