
Abstract
To address the critical challenges impeding the progress and utilization of electromechanical suspensions, this paper examines the negative consequences of inertial mass on the acceleration of the sprung mass and structural reliability issues. It then introduces and optimizes two novel suspension configurations featuring a series buffering and damping structure (SBDS). Subsequently, a two-degree-of-freedom electromechanical suspension model with SBDS is proposed and formulated. Utilizing the probability method, the paper also derives the vibration transmission characteristic formulas for the SBDS-integrated suspension. Theoretical analysis suggests that the integration of SBDS is advantageous in reducing the inertial force generated by the inertial mass in electromechanical suspensions. Additionally, the impact of parameter variations in SBDS on suspension characteristics is examined, providing theoretical guidance for the design of this structure. Building upon the proposed suspension theory incorporating the novel SBDS configuration, a butterfly spring buffer is employed to replace the connecting rod in the traditional electromechanical suspension design. Bench tests validate that the new electromechanical suspension configuration with SBDS addresses the issue of performance degradation in the high-frequency range due to inertial mass, thereby enhancing the overall performance of electromechanical suspensions and facilitating their further development and application.
Introduction
The primary function of vehicle suspension is to reduce disturbance to the chassis from road roughness, vehicle acceleration, deceleration, and steering, in order to achieve better ride comfort and maintain good handling. With the development of new energy vehicle technology, electromechanical suspensions that can achieve energy recovery have become a research hotpot to improve energy utilization efficiency. The application of electromechanical suspension in the civilian field began with BOSE company. In 2004, BOSE successfully developed a linear motor based energy feedback suspension. 1 When working in the energy feedback state, the electromagnetic damping force can be adjusted to adapt to different road conditions. During acceleration, braking, or steering, the vehicle can be controlled to resist pitch and roll.
The early research on the electromechanical suspension of military vehicles began in the 1990s, 2 and experimental verification was completed in the early 20th century.3–5
The difference between electromechanical suspension and traditional suspension is that it can achieve the recovery of random vibration energy.6,7 Therefore, this type of suspension that can achieve energy recovery is called regenerative suspension, which can achieve semi-active control; On the other hand, active control of the suspension can be achieved through the control of the electric motor.
The researches on the electromechanical suspensions mainly focused on three aspects: actuator structure design,8,9 energy harvesting performance,6,10–13 and suspension control.7,14 The actuator is the core component of electromechanical suspension, which can be divided into two categories from the perspective of energy conversion: electromechanical actuator 15 and electro-hydraulic actuator.16–18
Electromechanical actuators use motors as energy conversion components. According to the type of motor, electromechanical actuators can be classified into two types: linear motor actuators 19 and rotating motor actuators. 20
Shock absorbers based on linear motors generally do not have transmission devices, and the damping force generated by linear motors directly acts on the suspension, so the inertial mass of such suspensions is basically negligible. In contrast, shock absorbers using rotating motors generally have transmission devices, which mainly include ball screw, rack-pinion, hydraulic transformation system, link mechanism, etc. Therefore, the larger inertial mass generated by the transmission device. Furthermore, under the excitation of random road surfaces, the wheels generate relative acceleration of the suspension, resulting in a larger inertial force due to the larger inertial mass. After more than 20 years of research, electromechanical suspension products have rarely been applied. Linear motor electromechanical suspension has a large volume, weight, and high cost, making it difficult to be practical. The difficulty in productization of electromechanical suspensions for rotating motors lies in the fundamental reason for the difficulty in solving the problem of inertial force caused by inertial mass.
Many scholars have recognized the harm of large inertial forces on suspension performance. Li et al. 21 experimentally demonstrated that the inertial mass causes significant fluctuations in the indicator curve of the shock absorber. Liu et al. 22 and Peng et al. 23 have shown that inertial mass improves the performance of the suspension in the low-frequency region, while it deteriorates in the high-frequency region. Many scholars have conducted research on how to reduce inertial forces and proposed structural solutions.
One type of solution is the motor unidirectional rotation scheme. Considering the large inertia force during motor commutation, mechanisms such as one-way bearings or one-way clutches are applied. When the suspension is in motion, the motor only rotates in one direction, which can eliminate the inertial force generated by motor commutation. Wang et al. 24 developed a double screw rotary motor linear electromechanical actuator, with both the left and right screw equipped with one-way clutches, allowing the motor to only rotate in one direction. Yu et al. 25 proposed a ball screw type energy feedback damper, which not only achieves unidirectional rotation of the motor but also optimizes asymmetric damping characteristics by adjusting the transmission ratio through the combination of two unidirectional clutches and planetary gear mechanisms. Although the above research has eliminated the inertial force generated by motor commutation, it cannot fundamentally solve the problem of inertial force, as it still generates inertial force when accelerating or decelerating in a unidirectional rotation of the motor.
Another type of solution is to add a damping and buffering structure to the existing electromechanical suspension configuration to attenuate the motor’s motion acceleration, thereby reducing the inertial force. Montazeri-Gh and Kavianipour 26 proposed a scheme of regenerative shock absorber with series spring to isolate the absorber from high-frequency disturbances. Zhao et al. 27 proposed a new active suspension dual damping structure to address the issue of excessive equivalent inertial mass of actuators. Chen et al. 28 proposed a dual vibration reduction structure with additional springs and dampers connected in series to reduce the impact of inertial mass in the energy feedback suspension system. The above research work, through simulation research, has proven that adding damping and buffering structures in electromechanical suspension is effective. This solution requires further in-depth theoretical analysis, establishment of a theoretical model, and integration of simulation and experimental verification to fully validate the effectiveness of this solution.
This paper takes the electromechanical suspension for tracked vehicles as the research object. Firstly, the electromechanical suspension model is established to analyze the adverse effects of inertial force on suspension performance and the frequency domain characteristics of inertial force. The influence of inertial force generated by inertial mass on structural components has been verified through experiments.
Then, two new suspension configurations are proposed, of which is adding a series buffering and damping structure(SBDS) to the existing suspension, and the implementation of the two schemes are analyzed. Based on the probability method, some innovative frequency domain characteristic calculation formulas for the electromechanical suspension with SBDS are proposed. The analysis proved that the SBDS scheme can significantly reduce the impact of inertial force on the suspension characteristics. Subsequently, the impact of SBDS parameter changes on suspension is analyzed.
Finally, the SBDS component is designed and applied in the electromechanical suspension test. The stiffness and damping coefficients of SBDS are obtained through experiments, and the equivalent stiffness and damping coefficients of the suspension SBDS are calculated. The effectiveness of the SBDS scheme is demonstrated through the test. Through the analysis of the test data, it is proved that the calculation formulas for the frequency domain characteristics of vibration transmission are correct. At the same time, it has been verified that adding SBDS to the configuration of electromechanical suspension can solve the problem of performance degradation in the high-frequency range caused by inertial mass, which helps to improve the performance of electromechanical suspension and is conducive to the development and application of electromechanical suspension.
Two degree of freedom suspension model for tracked vehicle
The inertial mass of the electromechanical suspension
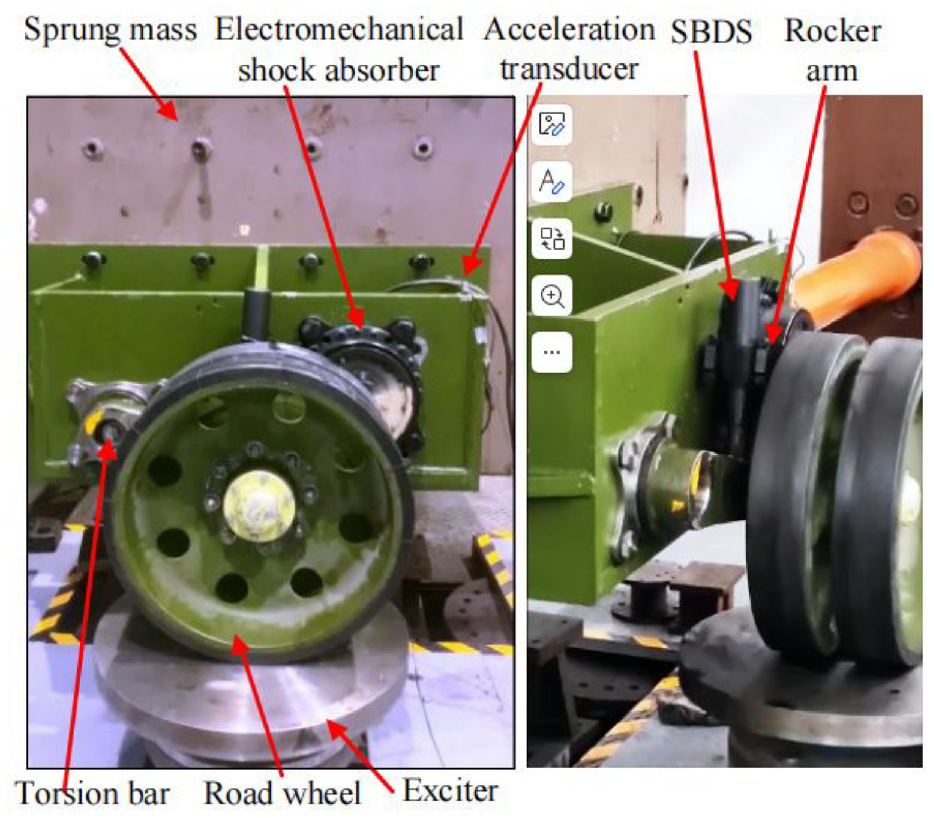
The electromechanical suspension of the tracked vehicle is shown in Figure 1.

The electromechanical suspension assembly.
The suspension comprises of tracks, load-bearing wheels, balance elbows, torsion bars, connecting rods, rocker arms, electromechanical shock absorbers, and stopper. The balance elbow, torsion bar, and electromechanical shock absorber of the suspension are fixed to the spring loaded mass at one end. The balance elbow is connected to the load-bearing wheel through a rotating pair. One end of the connecting rod is connected to the balance elbow through a rotating pair, and the other end is rotationally connected to the rocker arm. The other end of the rocker arm is connected to the electromechanical shock absorber. The torsion bar is an elastic component, and the electromechanical shock absorber is a damping component.
The electromechanical shock absorber’s structure is depicted in Figure 2, with the angle measurement assembly employed for gauging the rocker arm’s rotation angle. The rocker arm engages with the gear ring through splines. The gear ring and planetary gear assembly mesh through tooth profile, and the planetary gear assembly meshes with the sun gear on the motor shaft assembly, while also meshing with the fixed gear ring, achieving amplification of the input motion of the rocker arm and achieving the effect of increasing speed and reducing torque. The sun gear is connected to the motor rotor assembly through a flat key.
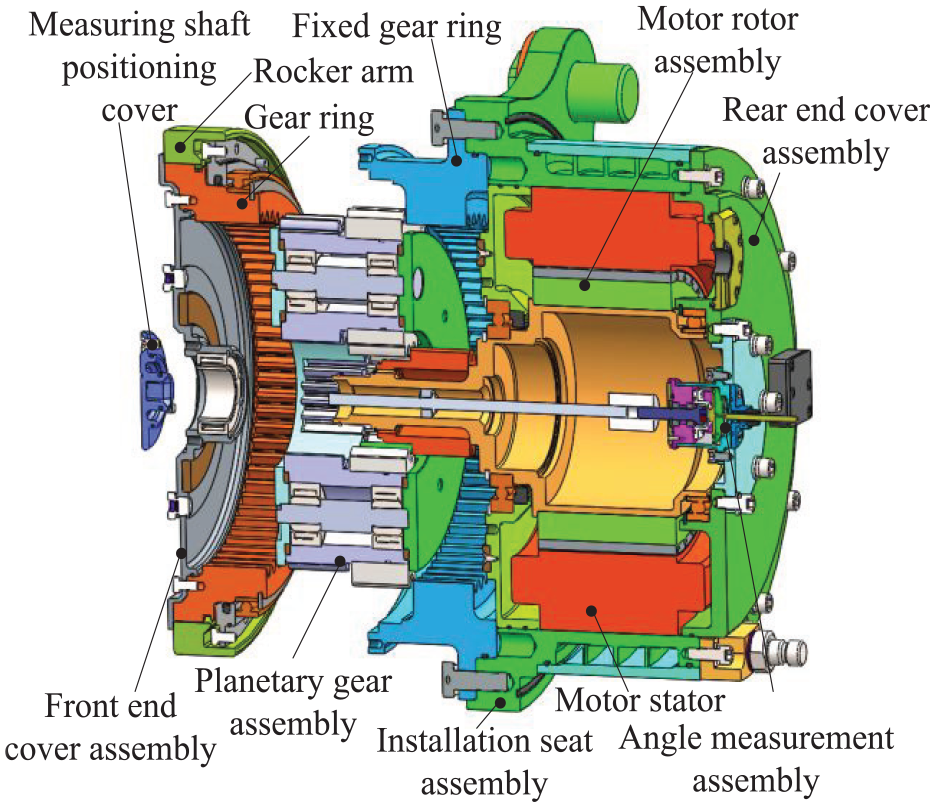
Internal structure of electromechanical shock absorber.
Meanwhile, the motor stator assembly is securely affixed to the installation seat assembly via the rear end cover assembly. The front cover assembly serves to seal the oil, and the measurement axis positioning cover ensures the proper alignment of the angle measurement assembly’s axis, being fixedly attached to the front end cover assembly.
The rotation of the rocker arm is amplified by the planetary gear assembly, causing the motor rotor to rotate, thereby generating a damping force for the motor to rotate.
Inertial mass
The electromechanical actuator adopts two-stage transmission, with a rotational inertia of
The parameters of the electromechanical actuator are shown in Table 1.
Electromechanical shock absorber parameters.

The complexity of the damping generation process and motion relationship arises from the linkage mechanism connecting the electromechanical actuator to the balance elbow.
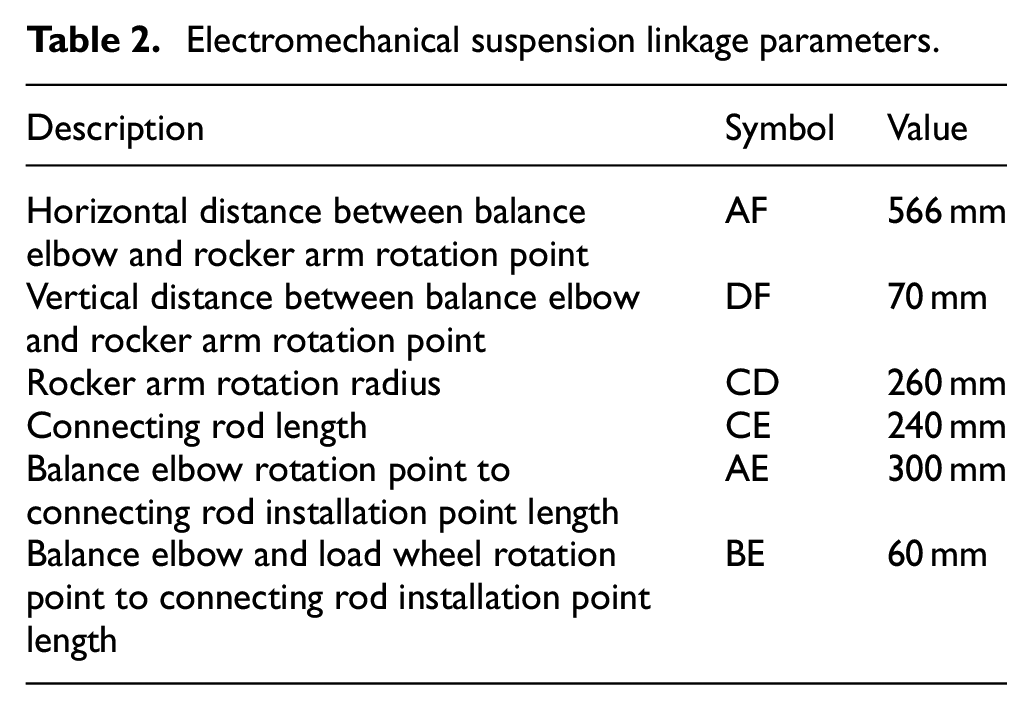
To streamline the model while maintaining its precision, an analysis of the linkage motion relationship has been conducted, depicted in Figure 3, with the relevant parameters outlined in Table 2.

Analysis diagram of linkage motion relationship.
Electromechanical suspension linkage parameters.
The correlation between the suspension’s relative displacement and the rocker arm’s rotation angle has been calculated across the full stroke.
In Figure 3, the symbols representing the balancing elbow angle
This article examines diverse scenarios involving changes in linkage, utilizing trigonometric functions to derive the correlation between suspension displacement and rocker arm angle, depicted in Figure 4. As observed in the figure, when the suspension displacement ranges from 0 to 400 mm, the relationship between these two variables exhibits a near-linear trend. A linear equation, representing this relationship, is determined through fitting, as presented in equation (1). Figure 4 further illustrates the comparison between the fitted line and the actual curve.


Corresponding relationship between suspension displacement and rocker arm angle.
The vertical displacement of the suspension sprung mass is

It can be calculated from equation (2) that,

In a rotational inertial frame, the moment of inertia is analogous to the inertial mass in a translational inertial frame, as both factors impede the movement of an object.
Specifically, inertial mass impedes translational motion, while rotational inertia obstructs rotational motion. For the purpose of simplifying the analysis of electromechanical suspension performance, 29 it is crucial to translate the moment of inertia J within the electromechanical shock absorber into an equivalent inertial mass mr.
Assuming that the inertia force of the suspension is balanced with the inertia force generated by the actuator, equation (4) is obtained.

The calculation formula for the inertial mass of the suspension can be obtained from equations (2)–(4) as equation (5).

By using equation (5), the value of inertia mass can be calculated,
Mathematical model of the electromechanical suspension
To facilitate the analysis of the vibration transmission characteristics of an electromechanical suspension, the suspension stiffness corresponding to the static equilibrium position is adopted as the model’s suspension stiffness. Subsequently, a two-degree-of-freedom suspension model is constructed, as depicted in Figure 5.

Two degree of freedom suspension model.
The predefined conditions for this model are: The stiffness coefficient of the suspension remains constant, while the damping coefficient, wheel stiffness coefficient, and wheel damping coefficient are all assigned fixed values. The variable shape of the suspension does not exceed the base stroke. Frictional force is assumed to be zero.
Based on the model diagram in Figure 5, the dynamic equation of the suspension is derived, as presented in equation (6).
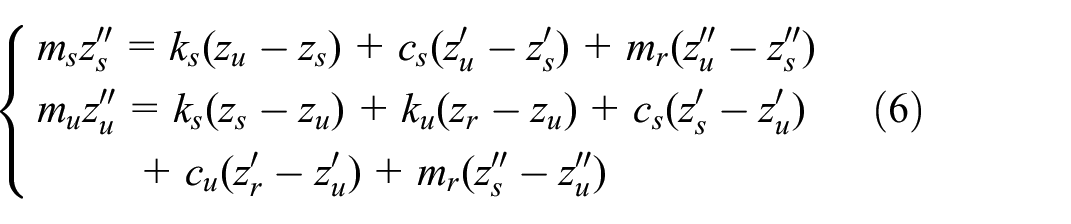
ms is the sprung mass, mu is the unsprung mass, mr is the equivalent inertial mass, ks is the suspension spring stiffness, ku is the wheel stiffness, cs is the suspension damping coefficient, cu is the wheel damping coefficient, z s is the displacement of the sprung mass, zu is the displacement of the unsprung mass, zr is the displacement of the excitation of the road surface.
By performing Fourier transform on equation (6), the amplitude frequency characteristics of the sprung mass acceleration


The ratio of wheel damping coefficient to suspension damping coefficient ε = cu /c
s
; The ratio of wheel stiffness coefficient to suspension stiffness coefficient γ = ku/ks; Unsprung mass to sprung mass ratio μ = mu/ms; Inertial mass to unsprung mass ratio β = mr/mu; Suspension damping ratio
The parameters of the two degree of freedom electromechanical suspension model are shown in Table 3.
Suspension simulation parameters.

Inertial force impact analysis
Suspension characteristics in time domain
To analyze the adverse effects caused by inertial mass, different levels of road inputs are used as excitation for the two degree of freedom suspension model. Root mean square values of the inertial force
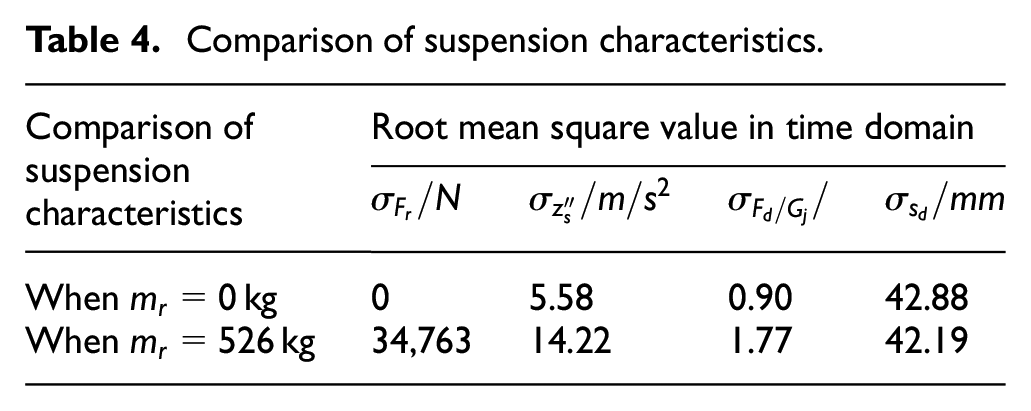
When the road surface level is E, and the driving speed is 30 km/h, the simulation duration is 20 s, the data is shown in Table 4.
Comparison of suspension characteristics.
The power spectral density of sprung mass acceleration is shown in Figure 6. The power spectral density of inertial force is shown in Figure 7.

Power spectral density of sprung mass acceleration.

Power spectral density of inertial force.
From Table 4, it can be seen that the root mean square value of the inertial force caused by the inertial mass reaches 34,763 N.
At the same time, the acceleration of the sprung mass and the relative dynamic load both increase significantly, while the relative dynamic deflection slightly decreases.
From Figure 6, it can be seen that on the left side of the turning frequency fz (4.06 Hz in the figure), the acceleration of the sprung mass of the suspension with an inertial mass of 526 kg is smaller than that of the suspension without an inertial mass, This indicates that in the (0, fz] frequency band, the inertial mass is beneficial for reducing the acceleration of the sprung mass.
however, on the right side of the turning frequency fz, the acceleration of the sprung mass of the suspension with an inertial mass of 526 kg is much greater than that of the suspension without an inertial mass.
This indicates that in the (fz,100] frequency band, the inertial mass increases the acceleration of the sprung mass.
As shown in Figure 7, when the inertial mass is 526 kg, the power spectral density of the inertial force is relatively high, indicating that the inertial mass causes severe vibration in the second main frequency region.
Therefore, in order to solve the impact problem of inertial mass, the inertial force above the turning frequency fz should be reduced.
Inertial force causes a decrease in component reliability
For electromechanical suspensions, large transmission ratios are generally used to achieve better damping characteristics or greater active power generation capabilities. Inertial mass improves the performance of the suspension in the low-frequency region, while it deteriorates in the high-frequency region. The inertial force caused by inertial mass reduces the reliability of the components. For example, during the bench test of the electromechanical suspension in the paper, there was a phenomenon of tooth breakage, as shown in Figure 8.

Broken teeth of planetary gear meshing with gear ring.
The planetary gear teeth broke under the action of excessive inertial force. Although a simple method of improving gear strength can temporarily solve reliability issues, the acceleration of the sprung mass deteriorates compared to the suspension without inertial mass. Therefore, in order to improve the performance and reliability of electromechanical suspension, it is necessary to solve the problem of inertial force.
To deeply analyze the influence of inertial mass on suspension characteristics in the frequency domain, it is necessary to establish a suspension system model and analyze the frequency domain characteristics.
Measurement of Inertial Force
To test the inertial force generated by the inertial mass, this paper tests the force situation of the fixed gear ring in the actuator. This paper selects the fixed gear ring that meshes with the planetary gear in the experiment as the stress testing object, because the fixed gear ring is fixedly connected to the sprung mass, which is more conducive to measurement in suspension motion.
In order to obtain the magnitude of the dynamic meshing force of the fixed gear ring during road simulation on the experimental platform, in the electromechanical actuator, the fixed gear ring meshes with four sets of planetary gears and is uniformly distributed in the circumferential direction. Therefore, strain gauge measuring points are arranged as shown in Figure 9. The measuring points are distributed on the fixed gear ring, and 4 sets of strain gauges are evenly distributed along the gear ring, with 6 pieces in each group; Arrange 2 pieces along the tooth direction at the root of adjacent 3 teeth, in order to obtain the root strain and stress magnitude in the circumferential and tooth directions.

Distribution of measuring points for fixed gear ring.
The experimental testing plan for the stress of the fixed gear ring is shown in Figure 10. The test uses TML Company’s DRA-30A multi-channel dynamic and static strain gauge, combined with a computer for online measurement. Its feature is that it can be used as both a small dynamic strain gauge and a multi-channel static strain gauge for simultaneous sampling.

Fixed gear ring stress test.
The hydraulic exciter in Figure 10 outputs the vertical vibration displacement of the D-level road surface at a driving speed of 40 km/h, and the stress of one group of fixed gear rings obtained is shown in Figure 11, indicating a maximum stress of 519.9 MPa. Analysis shows that the inertial force generated by the equivalent inertial mass is the fundamental reason for the poor reliability of current electromechanical actuators.
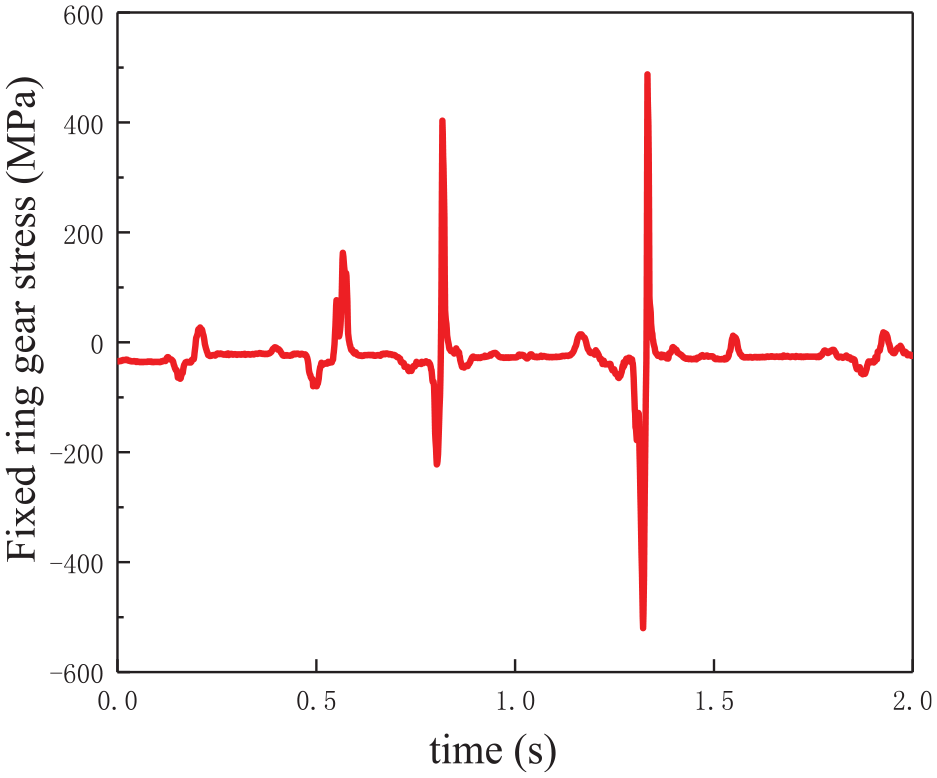
Fixed gear ring stress test curve.
Suspension characteristics with SBDS
Analysis of configurations with SBDS suspension
To reduce inertial force, a Series buffering and damping structure (SBDS) composed of a spring and a damper is added into the suspension, forming two new suspension configurations, as shown in Figure 12. In Figure 12, mh is the mass of SBDS, kh is the stiffness coefficient of SBDS, ch is the damping coefficient of SBDS, and zh is the displacement of SBDS.

Two suspension configurations with SBDS: (a) SBDS connected in series with the shock absorber and (b) SBDS connected in series with the original suspension.
Configuration 1 is shown in Figure 12(a). The SBDS is connected in series with the shock absorber.
Configuration 2 is shown in Figure 12(b). The SBDS is connected in series with the original suspension.
The spring is different in two different configurations. In configuration 1, the spring three states, as shown in the Figure 13. After the suspension is statically balanced, the spring component is not subjected to force and is in a free state. This spring is divided into two parts in scheme. When the suspension is compressed, it compresses between b and a1. When the suspension is extended, it compresses between b and a2. a1 and a2 are both connected to the point a of the shock absorber.

Three states of SBDS in series with the shock absorber: (a) static balance, (b) upward compression, and (c) downward compression.
In configuration 2, the spring has four states, as shown in the Figure 14. When the suspension is not under force, the spring is in a free state. After the suspension is statically balanced, the spring is compressed to bear the sprung mass, and its force is much greater than that of the spring in configuration 1. When the suspension is compressed, the spring is further compressed from point b to point a. When the suspension is extended, the spring stretches from point b relative to point a.

Four states of SBDS in series with the suspension: (a) free state, (b) static balance, (c) upward compression, and (d) downward compression.
In terms of engineering implementation, Configuration 2 is difficult to achieve. In this paper, the torsion bar spring is applied. If SBDS is to be connected in series with the torsion bar spring, the balance elbow structure needs to be changed.
Compared to configuration 2, the spring in SBDS of configuration 1 does not need to bear the sprung mass and is not subjected to force during suspension static balance, making it easy to implement in engineering. Therefore, configuration 1 is chosen.
Suspension theoretical model with SBDS
According to the model in Figure 12(a), when SBDS is within its travel range, SBDS takes effect, and the suspension motion equation is shown in equation (11); When the SBDS stroke is exceeded, it is equivalent to no SBDS, and the suspension motion equation is as shown in equation (6).

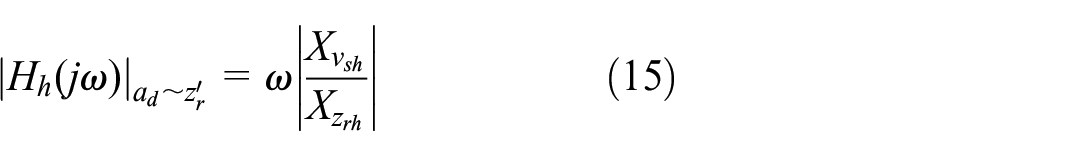
By performing Fourier transform on equation (6), the frequency domain characteristic calculation formula of the suspension can be obtained, as shown in equations (12)–(15). By using equations (12)–(15), the transmission characteristics such as sprung mass acceleration, relative dynamic load, suspension dynamic deflection, and inertial mass acceleration relative to the road excitation speed can be calculated.

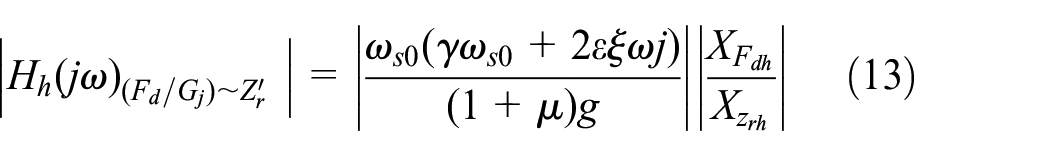
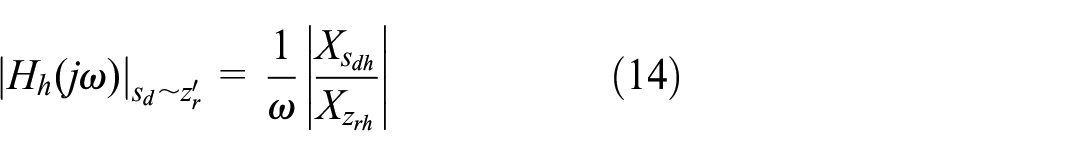


The ratio of SBDS damping coefficient to wheel damping coefficient is χ = ch/cu; The ratio of SBDS stiffness to suspension stiffness is δ = kh/ks; The ratio of SBDS mass to unsprung mass is
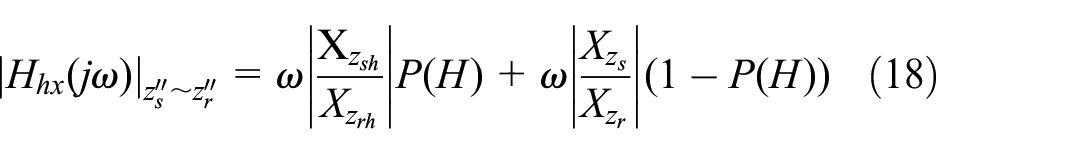
Set the amplitude of the deformation displacement of the SBDS as Sh, when Sh≤Mh, the SBDS is fully functional, the SBDS probability is 100%, which can be obtained as equation (16). 29 When Sh>Mh, the SBDS is not fully functional, and the buffering probability is as shown in equation (17). 29


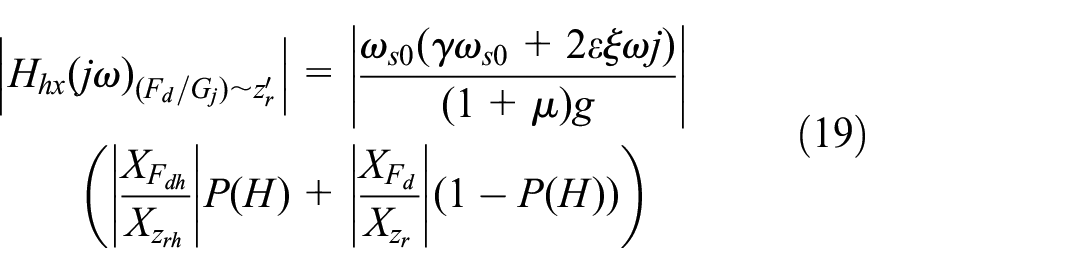
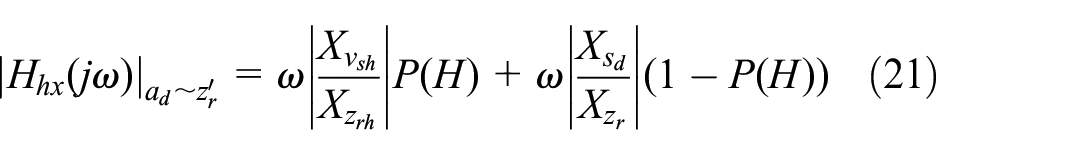
The amplitude of unsprung mass acceleration, relative dynamic load, dynamic deflection, inertial mass acceleration, at any frequency point on the suspension amplitude frequency characteristic curve is the sum of the amplitude with SBDS multiplied by probability and the amplitude without SBDS multiplied by probability, as shown in equations (18)–(21). 29

Frequency domain characteristics with SBDS
The simulation parameters are listed in Table 5. Equations (18)–(21) are used to calculate and compare the amplitude-frequency characteristics of the suspension with and without SBDS. The results are presented in Figures 15 to 18.
SBDS parameters.


Comparison of sprung mass acceleration amplitudes.

Comparison of relative dynamic load amplitudes.

Comparison of dynamic deflection amplitudes.

Comparison of inertial mass acceleration amplitudes.
In Figures 15 to 18, for the electromechanical suspension without SBDS, fsm is the first main frequency and fum is the second main frequency.
For electromechanical suspensions with SBDS, fsb is the first main frequency and fub is the second main frequency.
For the two suspensions, fsy is the right intersection point of the first main frequency, fuz is the left intersection point of the second main frequency, and fuy is the right intersection point of the second main frequency.
Upon analyzing Figures 15 to 18, it is evident that the amplitudes of the sprung mass acceleration, relative dynamic load, and inertial mass acceleration exhibit a slight decline in the first main frequency region when compared to the suspension without SBDS. However, in the second main frequency region, these amplitudes demonstrate a significant reduction.
Observing Figures 15 to 18, it becomes evident that the inertial mass plays a significant role in reducing the sprung mass acceleration, relative dynamic load, and dynamic deflection in the first main frequency region. However, in the second main frequency region, the inertial mass introduces a marked increase in these parameters, posing a key challenge in the development of electromechanical suspension systems.
Furthermore, when comparing the electromechanical suspension with and without inertial mass, it is apparent that the inclusion of inertial mass reduces the main frequency value. In contrast, when an SBDS is introduced to the electromechanical suspension system with inertial mass, it elevates the second main frequency value while the first main frequency value remains largely unchanged.
According to the analysis of Figures 15 and 16, it can be seen that in the frequency band (0.1, fsb), the amplitude of the sprung mass acceleration and relative dynamic load of the electromechanical suspension with SBDS is basically the same as that of the electromechanical suspension without SBDS. In the frequency band (fsb, fsy), the amplitude of the sprung mass acceleration and relative dynamic load of the electromechanical suspension with SBDS is slightly greater than that of the electromechanical suspension without SBDS. In the frequency band (fsy, fuz), the amplitude of the sprung mass acceleration and relative dynamic load of the electromechanical suspension with SBDS is significantly reduced compared to the amplitude of the sprung mass acceleration and relative dynamic load of the electromechanical suspension without SBDS.
As shown in Figure 15, in the frequency band (fuz, fuy), the sprung mass acceleration of the electromechanical suspension with SBDS slightly increases compared to the electromechanical suspension without SBDS. When the frequency is greater than fuy, the sprung mass acceleration of the electromechanical suspension with SBDS is smaller than that of the electromechanical suspension without SBDS.
As shown in Figure 16, when the frequency is greater than fuz, the relative dynamic load of the electromechanical suspension with SBDS increases compared to the electromechanical suspension without SBDS, and its amplitude reaches its maximum value when the frequency is equal to fub. However, when the frequency is greater than fub, its value gradually decreases, and finally it is basically the same as the electromechanical suspension without SBDS.
As depicted in Figure 17, for frequencies below fsb, the dynamic deflection remains largely similar for both suspension configurations. However, when the frequency surpasses fsb and falls within the range below fsy, the suspension equipped with SBDS exhibits a slightly higher dynamic deflection compared to the one without SBDS. Notably, the suspension without SBDS attains its peak deflection at the second main frequency fum, whereas the suspension with SBDS reaches its peak deflection at the second main frequency fub.
As depicted in Figure 18, for frequencies below fsy, the inertial mass acceleration remains virtually identical between the two suspension configurations. However, when the frequency exceeds fsy, the inertial mass acceleration of the suspension with SBDS undergoes a significant reduction compared to the one without SBDS, exhibiting only a slight increase near the second main frequency fub.
Therefore, based on the frequency domain analysis, the incorporation of SBDS into the electromechanical suspension structure effectively addresses issues arising from the inertia mass of the electromechanical suspension.
To quantitatively evaluate the enhancement in suspension frequency domain performance enabled by SBDS, the average characteristic amplitude is determined for excitations spanning 0.1–100 Hz, as detailed in Table 6.
Comparison of suspension characteristic.
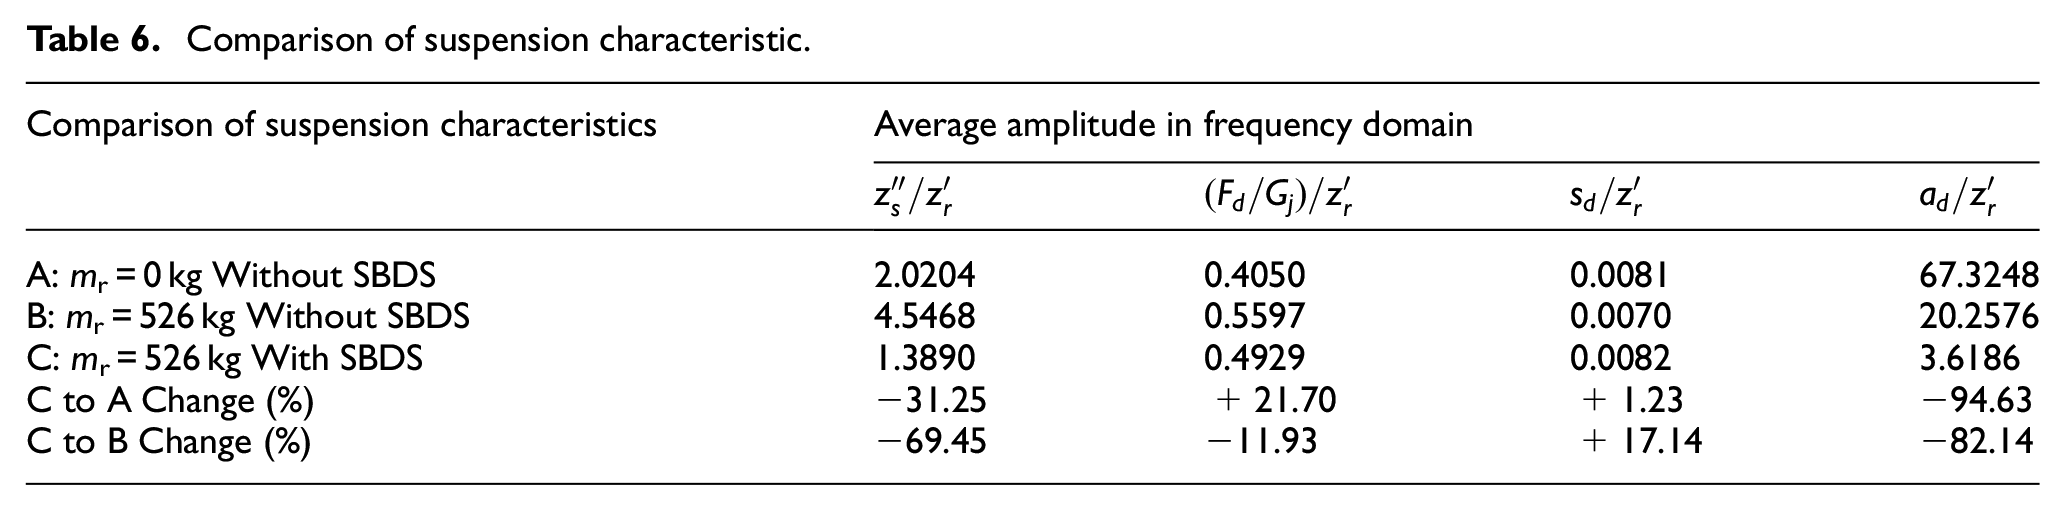
In the frequency domain, compared to the suspension without SBDS, the inertial mass acceleration of the suspension with SBDS decreases by 82.14%, and the sprung mass acceleration decreases by 69.45%. This indicates that SBDS is beneficial for reducing the inertial force generated by the inertia mass and reducing the adverse effect of inertial force on the sprung mass acceleration. The dynamic load of the suspension with SBDS decreased by 11.93% compared to the suspension without SBDS, while the dynamic deflection of the suspension increased by 17.14%.
Compared to the suspension without inertial mass, the inertial mass acceleration of the suspension with SBDS decreased by 94.63%, and the sprung mass acceleration decreased by 31.25%. This indicates that the suspension with SBDS is more conducive to improving smoothness compared to the suspension without inertial mass. On the other hand, the suspension with SBDS increased the relative dynamic load by 21.70% compared to the suspension without inertial mass. The dynamic deflection of the suspension increased by 1.23%.
The influence of SBDS parameters on suspension characteristics
As previously stated, the suspension system with SBDS effectively diminishes inertial force, lessens the acceleration of the sprung mass, and minimizes the relative dynamic load.
To achieve optimal comprehensive performance, it is necessary to comprehensively analyze the impact of changes in stroke, stiffness, damping, and inertial mass of SBDS on suspension characteristics to determine the optimal parameters of SBDS.
To improve the reliability of SBDS, it is necessary to reduce the number of times it is over-compressed. The greater the stroke and stiffness, the less likely SBDS is to be over-compressed. When the stroke is determined, the stiffness must meet the requirement of transmitting the maximum damping force Fcmax of the electromechanical shock absorber. Therefore, equation (22) needs to be met to reduce the probability of over compression. To further improve the reliability of SBDS, its stiffness can be set to variable stiffness, that is, the closer it is to the end, the greater the stiffness. At this point, the stiffness satisfies equation (23). And the variable stiffness spring used can be oil gas spring, gas spring, or variable diameter spiral spring, etc.


The purpose of optimizing SBDS parameters is firstly to reduce the probability of over compression of spring, and secondly to achieve the optimal combination of sprung mass acceleration, dynamic deflection, and relative dynamic load. For the convenience of analyzing suspension performance, it is assumed that the stiffness is linear. When the stiffness ratio of SBDS to suspension

Comparison of SBDS displacement under different SBDS to suspension stiffness ratios.
Analysis shows that the stiffness of SBDS is greater, the displacement of SBDS is smaller, which is more obvious in the first main frequency region and less likely to be over-compressed, which is beneficial for improving the reliability of SBDS.
When the stiffness of SBDS is different, the variation of the sprung mass acceleration is shown in Figure 20. Analysis shows that the larger the SBDS stiffness, the smaller the sprung mass acceleration in the first main frequency region but it increases the sprung mass acceleration in other frequency regions.

Comparison of sprung mass acceleration under different SBDS to suspension stiffness ratios.
The comparison of suspension frequency domain characteristic amplitudes under different stiffness ratios
Comparison of frequency domain characteristic amplitudes of suspension under different

Therefore, the determination of SBDS stiffness value should be based on the premise of meeting equation (22) and the optimal value should be selected through comprehensive comparison.
When the damping ratios of SBDS and wheels are taken as 0, 1, and 2, and other parameters are the same as Tables 1 and 3, the amplitude characteristics of the spring loaded mass acceleration in the frequency domain are shown in Figure 21 and the suspension characteristics are also obtained as shown in Table 8.

Comparison of sprung mass acceleration under different SBDS to wheel damping ratios.
Comparison of frequency domain characteristic amplitudes of suspension under different
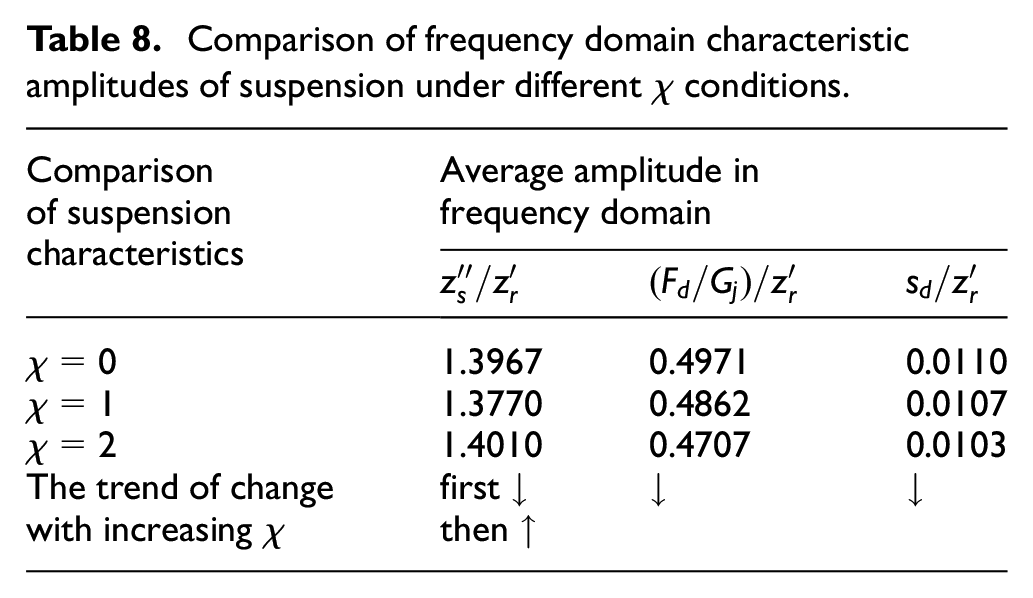
Analysis shows that when the ratio of SBDS damping coefficient to wheel damping coefficient is different, the larger its value, the greater the acceleration of the sprung mass in the first main frequency region, the smaller the sprung mass acceleration in the second main frequency region, and the greater the acceleration of the sprung mass in the high frequency region.
According to Table 8, as the damping value of SBDS increases, both the relative dynamic load and suspension dynamic deflection decrease, but the sprung mass acceleration first decreases and then increases.
When the ratio of SBDS mass
Comparison of frequency domain characteristic amplitudes of suspension under different

Analysis shows that as the mass of SBDS increases, the sprung mass acceleration decreases, the relative dynamic load increases, and the dynamic deflection of the suspension remains basically unchanged. Considering the mass increases to 100 times, the changes in sprung mass acceleration and suspension dynamic deflection caused by SBDS mass can be basically ignored. Therefore, the mass of SBDS has no effect on suspension characteristics. In practical applications, to reduce non sprung mass, the mass of SBDS should be as small as possible.
Electromechanical suspension system with improved configuration
The original suspension configuration is shown in Figure 1. Through theoretical analysis, the inertial mass of the electromechanical shock absorber results in a large inertial force and a large Sprung mass acceleration.
A theoretical analysis is conducted on the principle of the new suspension configuration with SBDS (as shown in Figure 12(a)), and it is found that the new configuration can effectively solve the adverse impact of the inertial force of the electromechanical shock absorber.
In engineering practice and verification, a buffer composed of butterfly springs, as shown in Figure 22, is used to replace the connecting rod in the original suspension, forming a new configuration of electromechanical suspension with SBDS, as shown in Figure 23. SBDS stiffness coefficient kh = 1.5 ks, SBDS damping coefficient of ch = 0.5c u . The damping of butterfly springs comes from the mutual compression and friction between adjacent springs.

Butterfly spring buffer structure.

Electromechanical suspension with SBDS installed on the bench.
As shown in Figure 22, SBDS consists of an upper mounting shaft, a lower connection joint bearing, a piston rod, some butterfly springs, and a cylinder barrel. Some butterfly springs are installed on the piston rod, and when the piston rod moves up and down, the butterfly springs are compressed. The set of butterfly springs in SBDS are connected in series to form elastic elements for buffering, and the stiffness coefficient of SBDS is related to the number and parameters of the butterfly springs. The damping of SBDS is formed by the friction between the butterfly spring and the friction between the butterfly spring and the cylinder.
The output force characteristic curve obtained by installing the butterfly spring SBDS on a single degree of freedom shock absorber test bench, with a stroke of ± 30 mm and a sine excitation frequency of 1 Hz, is shown in Figure 24. Define the displacement of SBDS as shb, the velocity vhb, and the output force as Fhb.

The output force curve of SBDS.
The stiffness coefficient of SBDS is obtained through bench tests to be 386 N/mm and the damping coefficient to be 603 N·s/m. However, the stiffness and damping of individual SBDS are different from that of SBDS in suspension model, and there is a certain conversion relationship between the two. The motion relationship between SBDS and suspension is shown in Figure 25.

The motion relationship between SBDS and suspension.
In order to calculate the stiffness and damping of the SBDS of the suspension, it is necessary to obtain the corresponding relationship between the individual SBDS and the SBDS in the suspension. The displacement of SBDS equivalent to the suspension model is defined as sh, and the output force is Fh.
According to torque balance, equations (24) and (25) can be obtained by equating the elastic force and damping force separately. The relationship between sh and shb is shown in equation (26). Therefore, the stiffness coefficient kh and damping coefficient ch of the equivalent suspension SBDS can be calculated as equations (27) and (28).


By defining hb as the equivalent conversion coefficient, equation (29) can be obtained. According to Figure 25, the variation of the equivalent conversion coefficient can be obtained when the suspension displacement sd is between 0 and 400 mm, as shown in Figure 26.

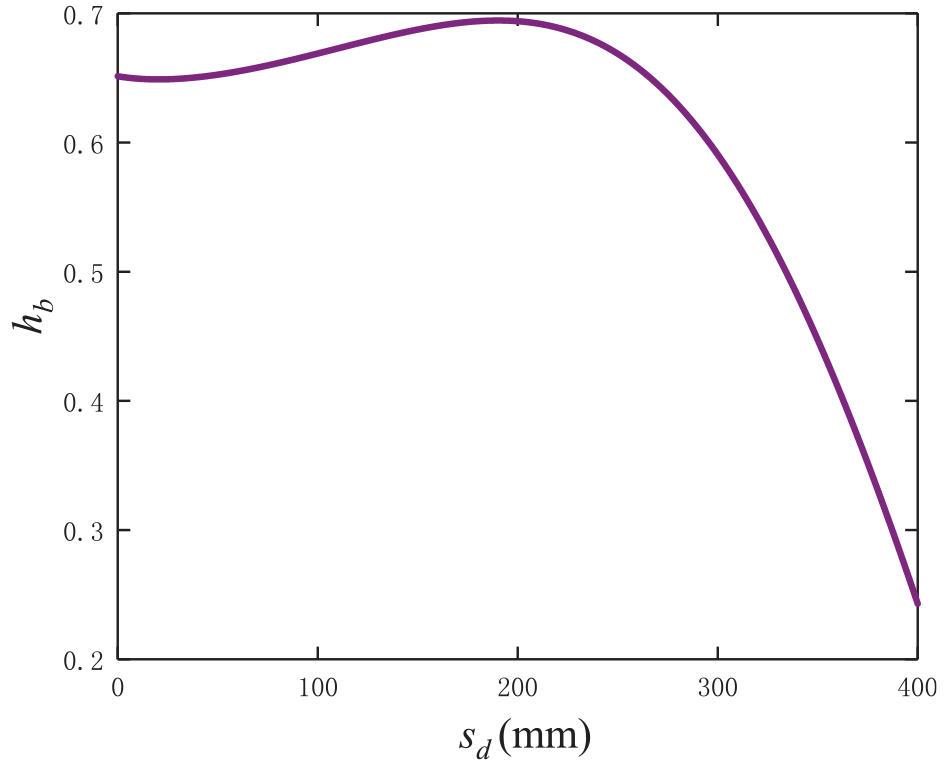
The variation of equivalent conversion coefficient.
The average value of the equivalent conversion coefficient calculated is 0.61, resulting in a stiffness coefficient of 235 N/mm for the SBDS of the suspension. The ratio of SBDS stiffness to suspension stiffness is 1.5,
Damping coefficient adjustment and control
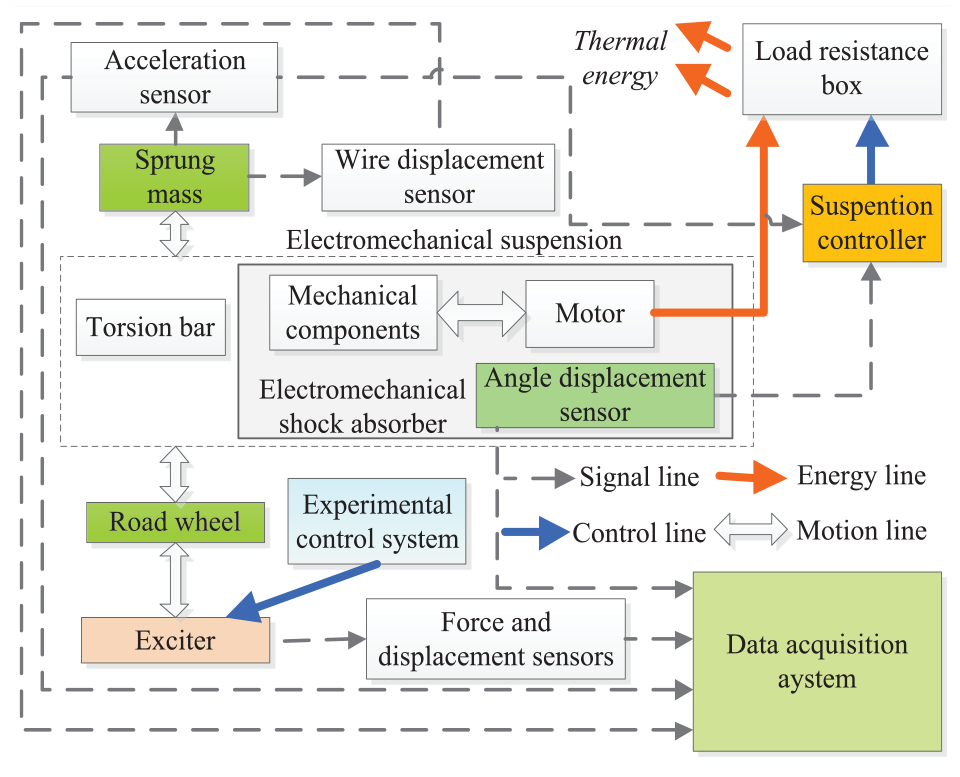
The control system of electromechanical suspension mainly consists of suspension controller, three-phase rectifier bridge, voltage converter, energy storage tank, control switch, resistor, etc., as shown in Figure 27.
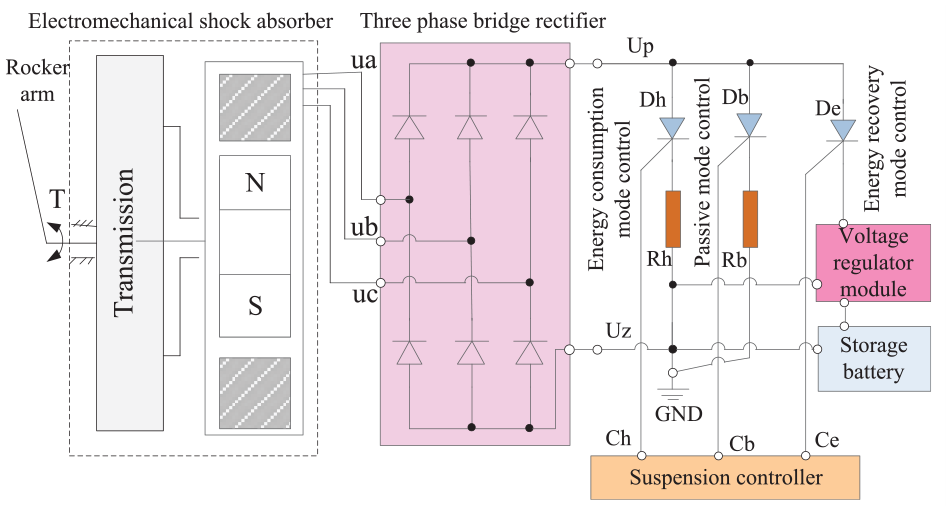
The working mode of electromechanical suspension.
In Figure 27, the motor output three-phase lines in the electromechanical actuator are ua,ub,uc. Connect the three-phase terminals of the three-phase rectifier bridge to ua,ub,uc. The energy consumption mode control switch is Dh, the passive mode control switch is Db, the feedback mode control switch is De, the load resistance of the energy consumption mode is Rh, the load resistance of the passive mode is Rb, and the control terminal of the suspension controller is Ch Cb and C respectively control the electronic switch Dh, Db, De.
The three-phase rectifier bridge is connected to the three-phase cable of the suspension motor, so that the three-phase alternating current generated by the motor is converted into direct current after passing through the three-phase rectifier bridge.
The positive pole of the direct current is Up and connected to the electronic switch Dh The positive pole connection of Db and De, the negative pole Uz of DC and the resistance Rh Rb connection, and connect to voltage converter, battery, and control system ground wire GND.
Electronic switch Dh The control terminals of Db and De are connected to the suspension controller Ch Cb and Ce connections. The output of the voltage converter is connected to the positive electrode of the stored energy.
This paper adopts the control of dissipation resistance Rh to achieve damping coefficient adjustment. The suspension controller sends a pulse width modulation (PWM) signal to the electronic switch tube Dh through the control line Ch, The duty cycle of the PWM signal determines the conduction time of the load resistance Rr. Set the duty cycle of PWM to du, The value range of du is from 0% to 100%. When du = 0, the load circuit of the electromechanical damper is equivalent to being disconnected, and the load resistance Rd is infinite. When du = 1, the load resistance of the energy feedback damper is Rd = Rh.
Therefore, the calculation formula for the dissipation resistance value Rd of the shock absorber under PWM control is equation (30). 29

Combining equation (2), the damping coefficient of the electromechanical suspension can be obtained as equation (31), 29 where ke is the back electromotive force voltage constant of the motor, kt is the torque constant of the motor, Rm is the internal resistance of the motor.

Using the parameters in Table 10, according to equations (24) and (25), the variation curve of suspension damping coefficient is shown in Figure 28.
Parameters of shock absorber motor.


Damping coefficient varies with duty cycle.
As shown in Figure 28, The PWM duty cycle can adjust the damping coefficient of the suspension, and it basically varies linearly, which is very beneficial for the control of semi-active suspension. By adjusting the PWM duty cycle, the damping coefficient can be quickly adjusted to the desired value.
Verification of suspension with SBDS
To verify the improvement level of the new configuration suspension compared to the original configuration suspension, bench validation was conducted. The parameter values of the suspension are shown in Tables 3 and 5. The testing system of the test bench is shown in Figure 29.

Bench testing and acquisition system.
The suspension test uses an acceleration sensor to measure the sprung mass acceleration, and a wire type sensor to measure the displacement of the sprung mass. The MTS hydraulic actuator is used and equipped with force and displacement sensors, and the DH5929N data acquisition system is used with a sampling frequency of 10k. Connect the electromechanical shock absorber to the load resistance box.
Figure 29 represents the connection between the various parts, and represents the transfer of data from the various parts in Figure 30.
Bench experimental system schematic diagram.
In Figure 30, signals from sprung mass acceleration sensor, linear displacement sensor, and force and displacement sensors of the exciter are collected by the data acquisition system. The suspension controller controls the load resistance of the load resistance box. The electrical energy generated by the electromechanical shock absorber is absorbed by the load resistance and converted into thermal energy for dissipation.
The acceleration sensor measures the acceleration of the sprung mass, that is,
The linear displacement sensor measures the displacement zs of the sprung mass, and the displacement sensor inside the exciter measures the road displacement signal zr input to the suspension. Therefore, the suspension dynamic deflection signal sd is the difference between the sprung mass displacement and the road input displacement, that is, sd = zr-zs.
The angular displacement signal measured by the angle sensor can be differentiated twice to obtain the acceleration of the inertial mass, that is, as.
Comparison of force-displacement curve
After adding SBDS to the electromechanical suspension, the butterfly spring is used instead of the connecting rod. Due to the increase in degrees of freedom, it is not possible to test the shock absorber with added SBDS using a single degree of freedom test bench. Therefore, a two degree of freedom test bench, as shown in Figure 29, was applied, and the spring-loaded mass of the bench was fixed. At the same time, the torsion bar was disconnected from the balance elbow. Therefore, using a test bench with test suspension can better test the shock absorber characteristics with added SBDS.
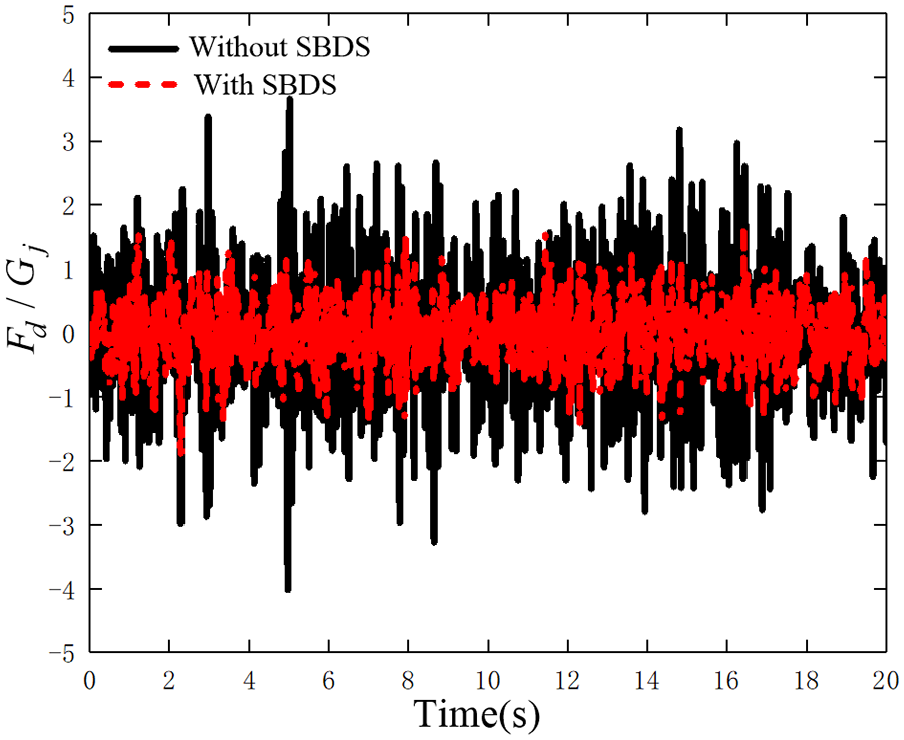
Using a sine signal with a frequency of 1H and an amplitude of 80 mm as the suspension input, the damping force Fc and displacement s curve with and without SBDS are obtained, as shown in Figure 31.

Comparison of suspension force-displacement curve diagrams with different configurations.
The damping Fc of the shock absorber is composed of the damping force of the shock absorber and the inertial mass resistance. The damping force of the shock absorber is determined by the damping coefficient and the speed of the shock absorber. Inertial mass resistance is determined by the inertial mass and inertial mass acceleration.
From Figure 31, it can be seen that increasing the SBDS suspension reduces the fluctuation of the damping force Fc curve in the force-displacement diagram compared to non SBDS suspension. Generally speaking, when a shock absorber without SBDS changes direction, the acceleration is greater and the damping force Fc fluctuates more significantly. After adding SBDS, the damping force Fc of the diagram changes smoothly, reducing the acceleration of the sprung mass and improving the reliability of the suspension.
Comparative testing of specific frequency points
In order to verify the filtering effect of SBDS suspension on inertial force, bench tests were conducted, as shown in Figure 32. Specific frequency points were selected for testing, and the test results are shown in Table 11.
Bench test of electromechanical suspension.
Comparison of suspension characteristics in multi frequency bench test.

From Table 11, it can be seen that at frequencies of 2, 10, and 30 Hz, the acceleration value of the sprung mass decreases, with a decrease of 89.78% at 10 Hz. This indicates that adding SBDS to the electromechanical suspension can better reduce the adverse impact of inertial mass compared to the original electromechanical suspension, and greatly improve the smoothness of the suspension.
At the frequency point of 1 Hz, the sprung mass acceleration of the suspension with or without SBDS is basically the same; At the 5 Hz frequency point, the sprung mass acceleration of the suspension with SBDS increases by 28.65% compared to the suspension without SBDS; At the 20 Hz frequency point, the sprung mass acceleration of the suspension with SBDS increases by 9.02% compared to the suspension without SBDS. The characteristics of these frequency points are consistent with those shown in Figure 15.
The experimental data in Table 11 also confirms that the characteristics of the two different suspension configurations in Figure 15 are correct.
Comparative testing of random road excitation
Comparative data with and without SBDS suspension were obtained through different road surface excitations. The three random road surfaces used are D-level road 60 km/h, E-level road 40 km/h, and F-level road 20 km/h. comparative data as shown in Table 12. under D-level road 60 km/h excitation, the comparison of sprung mass acceleration is shown in Figure 33, the comparison of relative dynamic load is shown in Figure 34, the comparison of dynamic deflection is shown in Figure 35.
Comparison of suspension test data.


The comparison of sprung mass acceleration.
The comparison of relative dynamic load.

The comparison of dynamic deflection.
Based on bench tests conducted using Table 12, it has been confirmed that the suspension configuration with an enhanced SBDS effectively mitigates inertial force. Specifically, under varying degrees of road surface excitation, the root mean square value of acceleration is reduced by 58.86%, 55.35%, and 47.38% compared to a suspension without SBDS. Additionally, the root mean square value of wheel relative dynamic load also demonstrates reductions of 55.34%, 58.80%, and 56.19% under varying degrees of road surface excitation.
On the other hand, the root mean square value of suspension dynamic deflection experiences an increase of 1.00% under D-level road excitation at 60 km/h, while it is reduced by 4.33% and 3.66% under E-level and F-level road surface excitation, respectively.
The experimental data curves presented in Figures 33 to 35, derived from bench tests, highlight the crucial role of SBDS in mitigating the negative influence of inertial mass in electromechanical suspensions. This reduction is instrumental in enhancing the overall performance of these suspensions.
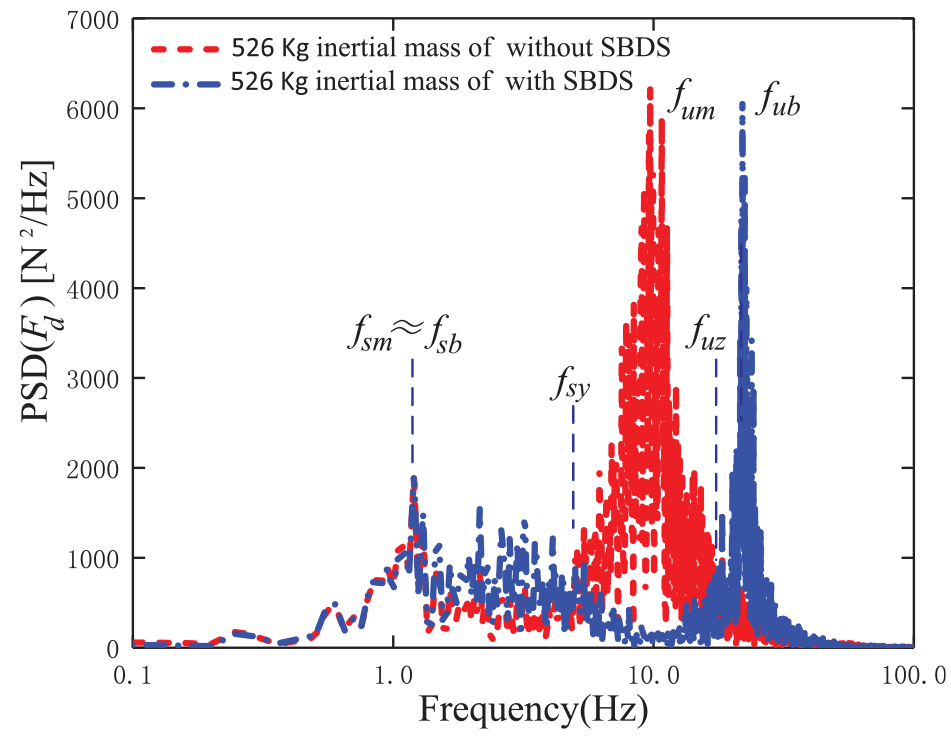
In order to further verify the correctness of the suspension configuration with SBDS, the collected suspension data is subjected to spectral density analysis to obtain the sprung mass acceleration, wheel dynamic load, suspension dynamic deflection, and inertial mass acceleration spectral density, as shown in Figures 35 to 38.

Sprung mass acceleration spectral density.
Wheel dynamic load spectral density.

Suspension dynamic deflection spectral density.
By comparing the frequency domain characteristic Figures 36 to 39 with the frequency density Figures 15 to 18, it can be found that the changes in the test data frequency density figures are very consistent with those in the suspension frequency domain characteristic figure. This also proves that the formulas for frequency domain suspension proposed in this paper are correct.

Inertial mass acceleration spectral density.
From Figures 36 to 39, it can be seen that the integration of SBDS suspension elevates the second main frequency of the electromechanical suspension, yet the first main frequency remains largely unchanged.
From Figures 36 to 39, it can be seen that compared with the electromechanical suspension without SBDS, the amplitude of the sprung mass acceleration, relative dynamic load, and inertial mass acceleration of the electromechanical suspension with SBDS slightly increases in the first main frequency region, while significantly decreases in the second main frequency region.
From Figures 36 to 39, it can be seen that in the frequency band (fsy, fuz), the amplitude of the sprung mass acceleration, relative dynamic load, and inertial mass acceleration of the electromechanical suspension with SBDS is significantly reduced compared to the amplitude of the spring-loaded mass acceleration and relative dynamic load of the electromechanical suspension without SBDS.
The conclusions drawn above are consistent with those mentioned in Figures 15 to 18, therefore the power spectral density curve of the experimental data is basically the same as the curve in the frequency domain.
By comparing Figures 36 to 39 with Figures 15 to 18, the key frequency points calculated in the frequency domain and analyzed in the experimental data spectrum are obtained, as shown in Figures 40 and 41.

Comparison of key frequency points.
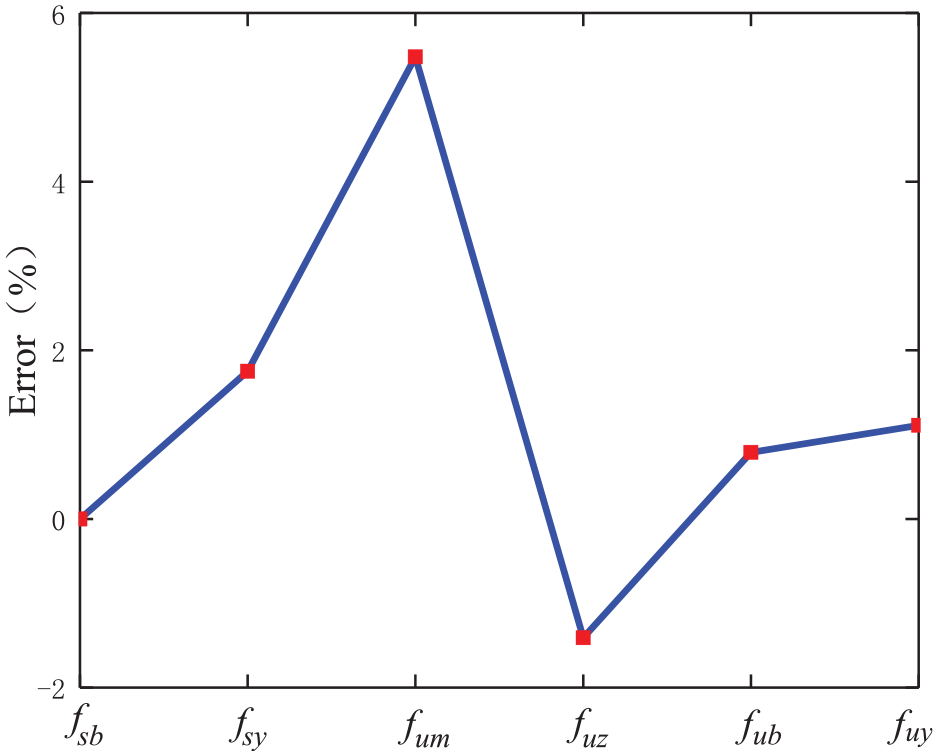
comparison of differences in key frequency points.
From Figure 41, it can be seen that the frequency points are basically the same, thus proving that equations (18)–(21) are correct. The key frequency points are basically consistent, and the error range is within [−1.41%, +5.48%], showing high accuracy. This result verifies the correctness of the frequency domain formula for the vibration transmission characteristics of the SBDS configuration electromechanical suspension with series shock absorber, providing a solid foundation for further in-depth research on the dynamic characteristics of electromechanical suspension.
Conclusion
This paper analyzes the adverse effects of inertial mass on the second main frequency region of the suspension, and proposes and establishes a new configuration of a two degree of freedom electromechanical suspension with added SBDS. Based on the proposed suspension theory based on the new SBDS configuration, replace the connecting rod in the original configuration of the electromechanical suspension with a butterfly spring buffer. Through bench tests, it has been verified that the new configuration of electromechanical suspension with SBDS can solve the problem of performance degradation in the high-frequency region caused by inertial mass. The main conclusions obtained through theoretical analysis and experimental verification are as follows:
(1) The new configuration of electromechanical suspension with SBDS significantly reduces the adverse impact of inertial mass in the high frequency domain.
(2) The increase in stiffness of SBDS results in an increase in the acceleration amplitude of the sprung mass, a decrease in the relative dynamic load amplitude, and a decrease in the dynamic deflection amplitude of the suspension.
(3) The new configuration of electromechanical suspension with SBDS reduces the fluctuation of the damping force curve.
(4) The new configuration of electromechanical suspension with SBDS elevates the second main frequency of the electromechanical suspension, yet the first main frequency remains largely unchanged.
(5) Bench tests have shown that SBDS plays an important role to address the key issues hindering the development and application of electromechanical suspensions.
This paper proposes a new configuration theory that adds SBDS to solve the problems caused by the inertial mass of electromechanical suspension, which is beneficial for the development of electromechanical suspension technology and the practicality of products.
This paper has been verified through simulation and experiments that adding SBDS can solve the key problems of electromechanical suspension. However, this first increases the complexity of the system, increasing the volume and mass of the original system. How to reduce the volume of the mass of the electromechanical suspension with the new configuration of SBDS will become a future research focus. On the other hand, the reliability of the elastic and damping components in SBDS has become the key to ensuring the performance of electromechanical suspensions. How to improve the reliability of SBDS is an important issue faced by new configurations of electromechanical suspensions. The integration of nonlinear stiffness elastic components, such as variable diameter spiral springs, gas springs, oil gas springs, etc., into electromechanical suspensions will be an important research topic.
Footnotes
Handling Editor: Aarthy Esakkiappan
Declaration of conflicting interests
The author(s) declared no potential conflicts of interest with respect to the research, authorship, and/or publication of this article.
Funding
The author(s) disclosed receipt of the following financial support for the research, authorship, and/or publication of this article: This work was supported by China National Basic Research Project (Project no. MKS20210070).