
Abstract
The safety barrier is often positioned at the entrance of the inlet passage in large and medium-sized low-lift pump stations, to ensure the safety of people and animals. To elucidate the blocking effect of the safety barrier and its influence mechanism on the internal flow of the inlet passage, numerical simulation combined with the physical model test were employed to investigate the impact of the cross-section and bar spacing of the safety barrier on the head loss, and the impact mechanism was clarified. The results showed that the optimal cross-section form of the safety barrier was found to be circular from the standpoint of head loss. When the blockage ratio of the safety barrier exceeds 0.3; prompt clearance of the blockage is recommended.
Introduction
VAFP (vertical axial flow pump) stations are widely employed in inter-basin water transfer projects in China, urban flood control, agricultural irrigation and drainage and among other fields, due to their large flow and low head. For example, in the eastern route of the South-to-North Water Diversion Project in China, VAFP stations accounted for more than 60%. 1 The safety barrier is a crucial hydraulic safety facilities for large and medium-sized VAFP stations, composed of metal bars arranged at equal intervals perpendicular to the direction of flow. It is usually positioned at the entrance of the inlet passage, ensuring the safety of personnel and units during normal operation. Figure 1 illustrates the arrangement of the safety barrier and trash rack. If the design of the safety barrier is not reasonable, the flow through the safety barrier can reduce the hydraulic performance of the pump device. The principle of safety barrier is similar to that of trash rack. When the dirt accumulates in front of the bars, the head loss behind the bars increases. Currently, most research focuses on the influence of the flow resistance effect of the trash rack on head loss. Erpicum et al. 2 found that setting a trash rack at the entrance of the downstream fish channel will affect the behavior of Atlantic salmon and reduce the effectiveness of the channel through comparative studies. Sarkardeh et al. 3 investigated how the type and strength of vortex were affected by the intake head wall slope and the placement of a trash rack, establishing the relationship between intake critical submerged depth and vortex strength, vortex strength and type. Latif et al. 4 investigated the head loss in hydraulic power generation by using computational fluid dynamics, and found the influence of water inlet velocity, bar inclination and blockage ratio on the head loss, provided the optimal design parameters for the design of trash rack. Zayed et al.5–7 took the trash rack in open channel as the research object, scrutinized the flow velocity distribution of trash rack under different blockage ratio through experiments, and proposed an average velocity equation considering blockage rate and Froude number. Lemkecher et al. 8 studied four new bar shapes and two supports, and found the head loss of inclined trash racks in hydropower plants can be significantly reduced by using specific shape bars and supports. Meister et al. 9 studied the rack head loss, and proposed a new equation to forecast the head loss of horizontal bars. Miltenovic et al. 10 presented a creative way for horizontal fine trash rack with cleaning function for small hydropower station stations. Aghajani et al. 11 revealed that the presence of trash rack has a great impact on lowering the strength on the water surface and vortex velocity through experimental tests. According to Odinets’s 12 experiments, the blocked range of the trash rack is more important than the position of blocked part of trash rack, which has minimal bearing on head loss. Salah Abd Elmoaty 13 studied how the presence of trash rack affected the water surface profile, and found the extension length of weed upstream and blocked area of trash rack screen greatly impacted the head loss. Szabo-Meszaros et al. 14 investigated the effect of six different types of trash racks on hydraulic performance and head loss through experiments, and found the head loss of the vertical angled trash rack was 3–8 times that of other types of trash racks. Yan et al. 15 presented the local head loss equation of trash rack blockage according to measured velocity distributions, and found the upshot that the difference of water level is associated with approach velocity and trash rack. Walczak et al. 16 scrutinized the influence of different forms of the debris on the trash racks and its degree and weight of submergence and on the force value of trash rack under the action of water pressure, and found that with the change of the submergence degree of debris, the resistance increases, which has a negative impact on the head loss and productivity of hydropower station. Zhang et al. 17 focused on a hydrodynamic noise study of the trash rack placed on the inlet passage to evaluate the noise generated by the turbulent flow, and proposed a low noise type of trash rack. Zhou et al. 18 focused on flow pattern around trash rack of inlet of a pump station project, and recognized how the flow pattern altered under different operating conditions. Lučin et al. 19 employed numerical simulation to explore the impact of different cross-sections on the head loss, and the design of the trash rack was optimized to reduce the head loss. Zhu et al.20,21 used numerical simulation of the velocity field inside the discharge passage to explain the large fluctuation velocity and high turbulence intensity at the trash rack section.

Arrangement of trash rack and safety barrier.
In summary, the research of domestic and foreign scholars currently primarily focuses on the structure of the trash rack, head loss, and the flow characteristics of the flow field around the trash rack. Significant research outcomes have been achieved in these areas. However, there is a slight deficiency in the current research regarding the safety barrier connected to the inlet passage of the VAFP device. In this paper, the impact of the geometric structure size and blockage ratio of the safety barrier on the head loss is compared and scrutinized by numerical simulation and physical model test. The optimal cross-section form of the safety barrier, the bar spacing, and the critical blockage ratio of the safety barrier are determined. This aims to provide a conceptual framework for the ideal design of the safety barrier.
Research objects and test bench
Object of calculation
In this paper, the VAFP device was selected as the subject of study, as depicted in Figure 2. The calculation domain includes six parts: safety barrier, ESIP (elbow-shaped inlet passage), impeller, guide vane, 90° elbow, and straight outlet passage. The impeller model is ZM55, and the primary parameters are shown in Table 1. The outlet passage is straight, the equivalent diffusion angle is 2.41°, and the horizontal diffusion angle is 4.73°. The vertical diffusion angle is 4.73°. The inlet cross-section is circular, with an area of inlet cross-section is 1.07D2, and the outlet cross-section is rectangular. Both the outlet cross-sectional area of the straight passage and the ESIP is 0.785D2.

3D model of VAFP device.
Primary design parameters of VAFP device.

Calculation scheme of safety barrier
The rationality of the safety barrier design is a critical aspect to ensure the efficient and stable operation of the pump station. Similar to the trash rack, the characteristic parameters of safety barrier mainly include the bar cross-sections and the bar spacing. The bar cross-sections mainly includes square, circular, and rectangular shapes. 22 Since the safety barrier is mainly placed at the location of entrance of the inlet passage and its placement is mainly vertical, there is no need to consider the arrangement angle of the safety barrier. Currently, there is no safety barrier design specification domestically or internationally. The geometric structure size of the safety barrier mainly refers to the design specification of the trash rack “Design code for steel gate in hydropower projects (NB 35055-2015)” and “Mechanical and electrical design manual of hydropower station” clearly stipulates that the bar spacing of the VAFP units should not exceed D/20.23,24 The nominal diameter D of the VAFP impeller studied in this paper is 120 mm. If the specification are strictly followed, the maximum bar spacing of the safety barrier is only 6 mm, and the width of the upstream face of the bar is 2 mm, requiring at least 42 bars to be arranged. At this time (In such a scenario), the maximum flow area of the safety barrier is only 68.42%, while the actual flow area of the trash rack in practical projects is 86.40%. 25 If the guidelines of the “Mechanical and electrical design manual of hydropower station” are strictly adhered to, the bar spacing of the safety barrier becomes small, which is inconsistent with the actual project requirements. Gao et al. 25 and strive to provide reference for engineering practice. Based on the quantitative analysis of the bar spacing of the safety barrier 10 mm, the head loss analysis of three different cross-sections of the safety barrier is carried out. When the bar spacing is 10 mm, the number of bars is 23, and the flow area of the safety barrier is 83.34%. Figure 3 is the analysis flow chart of this paper.
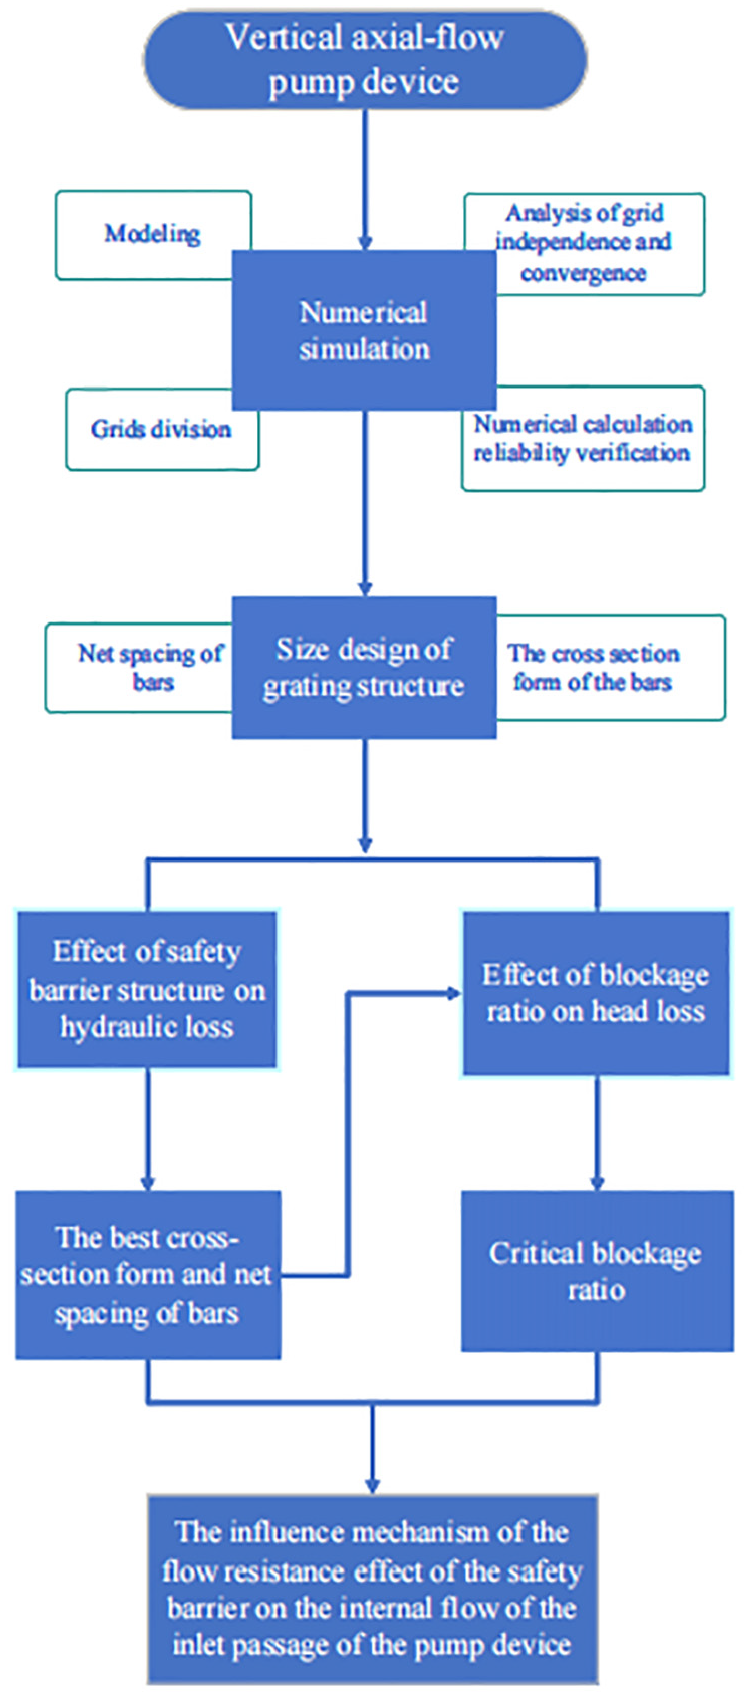
Flow chart of analysis.
Three different cross-section forms of safety barriers were selected for numerical analysis, which were circular, square, and rectangular. To better compare and scrutinize, the dimensions of the three different cross-section forms of safety barriers were kept consistent. The height of the safety barrier is 1.94D, the width is 2.06D, and the bar spacing is 1/12D. Using the research object of this paper as an example, where the spacing is 10 mm, and the width of the bar is 1/60D, the bar cross-section was modified accordingly. The cross-sectional forms of the bars are displayed in Figure 4. The cross-sectional diameter of the circular bar is 1/60D, the cross-sectional side length of the square bar is 1/60D, and the cross-sectional length of the rectangular bar is 1/30D, with a width is 1/60D.

The size diagram of bars of safety barrier with different cross-section forms: (a) rectangular cross-section, (b) circular cross-section, and (c) square cross-section.
Test equipment
The EPT (energy performance test) of the physical model of the VAFP device was carried out on the Φ120 mm closed cycle hydraulic mechanical test bench of the Hydrodynamic Engineering Laboratory of Jiangsu Province in China. The test bench is mainly comprised of VAFP device, closed water inlet tank, closed water outlet tank, ISWH125-100A centrifugal pump, and butterfly valve. The specific position of each component is displayed in Figure 5. The primary parameters of the test pump were consistent with the numerical simulation calculation objects.

3D model of VAFP device test bench: (1) closed inlet tank, (2) ESIP, (3) VAFP, (4) 90° elbow, (5) straight outlet passage, (6) main pump motor, (7) closed outlet tank, (8) PVC passage, (9) ISWH125-100A centrifugal pump, (10) electromagnetic flowmeter, and (11) butterfly valve.
The entire ESIP and the circular inlet section of the straight outlet passage are composed of transparent acrylic material, while the rectangular outlet section of the straight outlet passage is made of stainless steel metal. The guide vane is constructed from stainless steel, and the impeller is composed of brass. Figure 6 depicts the overall physical model of the VAFP device.

Physical model of VAFP device.
He 26 scrutinized the variation law between the head loss of the trash rack and the blocking ratio of bars surface in a prototype pump station. They found that when the blocking ratio of bars surface exceeded 0.4, the head loss of the trash rack increased sharply. To scrutinize the impact of the flow resistance effect of the safety barrier on the hydraulic performance of the VAFP device, based on the previous research conclusions, the study was conducted using the blockage ratio 0.3. Figure 7 shows the physical model of the safety barrier and the blocking plate. The bars of the safety barrier are made of stainless steel, with a circular cross-section, a diameter is 2 mm, a total number of bars is 16, and a bar spacing is 16 mm. The blocking plate is made of polypropylene (PP) plate with a length of 270 mm, a thickness of 10 mm, and a width of 89 mm, which is placed in front of the safety barrier.

Physical model of safety barrier and blocking plate.
EPT of pump device
The model test of VAFP device was conducted according to “SL140-2006, Code of practice for model pump and its installation acceptance tests” and “Hydraulic turbines, storage pumps and pump-turbines-Model acceptance tests (IEC60193:2019),”27,28 the external characteristics of the VAFP at 2200 rpm were tested. The EPT of the VAFP device mainly included head, flow, torque, and efficiency. The flow Q under the optimal condition was defined as Qbep. Starting from the small flow condition (0.6Qbep), 13 different flow conditions were taken, and 20 sets of data were averaged for each flow condition to reduce the error. Table 2 displayed the accuracy of the principal instruments and equipment of the test system. The magnetic flow meter, intelligent differential pressure transmitter, and speed and torque sensor employed to test flow, head, torque, and speed were all verified by the nationally recognized metrological calibration department, and the validity period was observed during the calibration time.

Accuracy of main instruments and equipment of test system.
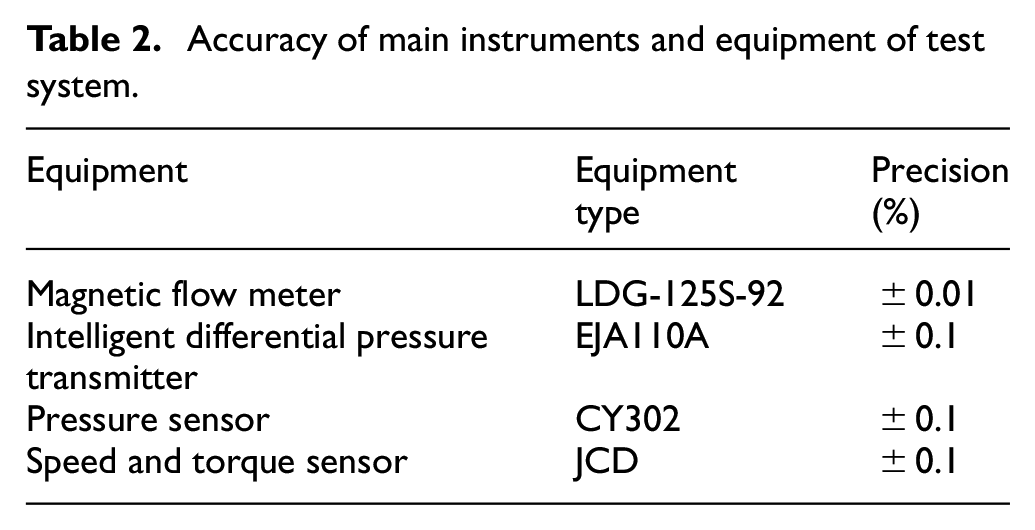
The uncertainty of flow measurement in this test is ±0.1%. The uncertainty of the head measurement is ±0.01%. The uncertainty of torque measurement is ±0.1414%. The uncertainty of the efficiency test system of the test bench is ±0.173%. The random uncertainty of the efficiency test of the pump device is ±0.266%. The uncertainty of the efficiency of the test bench is ±0.317%, which satisfied the requirements of “SL140-2006, Code of practice for model pump and its installation acceptance tests” and “IEC 60193-2019, Hydraulic turbines, pumps and pump-turbines-Model acceptance tests” for the comprehensive uncertainty of pump efficiency. This ensures the provision of reliable test data for this study.
Repeatability of EPT of pump device
To confirm that the test bench is reliable, according to the requirements in Li et al. 29 and Tan et al., 30 the EPT of the VAFP device was repeated at a rotation speed of 2200 rpm. The actual flow Q at each speed was compared with the flow Qbep of the optimal working condition. Figure 8 shows the Flow-Head performance curve of the VAFP device at a rotation speed of 2200 rpm. It is evident in Figure 8 that the data collected at similar flow conditions are very close. The Flow-Head curves of the pump device obtained by the three tests are in good agreement, indicating the validity of the pump device’s EPT upshots.

Repeatability of EPT of VAFP device.
Numerical calculation method
The fluid flow around the safety barrier and the fluid inside the pump device studied in this paper belongs to the 3D turbulent flow without decompression. When the fluid exchanges energy in each flow component, it must follow the principles of mass conservation, the energy conservation law, and the law of conservation of momentum. Since this paper mainly scrutinized the flow field around the safety barrier and the impact of the flow resistance effect on the hydraulic performance of the pump device, the fluid of the research object is liquid water at room temperature. Therefore taking the heat exchange between the liquids into account was unnecessary. In the process of numerical simulation, only the principles of mass conservation and conservation of momentum needed to be considered.
Grid division method
The overall grid of the VAFP device is shown in Figure 9. The ESIP, 90° elbow, and straight outlet passage were all divided into hexahedral grids by ICEM CFD. 31 The Determinant 2 × 2 × 2 values of each flow component grid are all above 0.3, and ensuring good grid quality. ANSYS Turbogrid is used to divide the impeller and guide vane into hexahedral grids. The dimensionless distance y+ from the center height of the first layer of the grid in the near-wall region of the impeller domain to the wall is less than 30, meeting the VLES (Very Large Eddy Simulation) model requirements for y+ in the near-wall region.32,33 The following is the definition of y+:


Grid diagram of VAFP device.
In equation (1),
In the process of grid division, although the precision of the numerical simulation increases with decreasing grid size, but to avoid the waste of computing resources caused by the excessive number of grids, before grid division, it is necessary to distinguish the grid size and density of the whole flow field where the safety barrier is located. For the far field and the region with more uniform flow, the number of grids can be appropriately reduced, while for the region with more complex near-field flow, appropriate grid refinement is needed. Due to the complexity of the flow near the bars of the safety barrier, dense grids are required in this area. As shown in Figure 10, Ogrid was used to make the local grids of three different bar cross-sections of safety barrier dense.

Local grid densification of bars of safety barrier with different cross-sections: (a) rectangular bar, (b) circular bar, and (c) square bar.
Turbulence model and boundary conditions
The inlet boundary condition of the calculation object was the static pressure, which was defined as the total pressure, with the pressure set at standard atmospheric pressure (1 atm). 34 To better simulate the flow field around the safety barrier and the internal flow of the pump device, a water inlet extension section was added at the inlet of the safety barrier to ensure that the flow was fully developed during the process of entering the pump device through the safety barrier, thereby forming turbulent flow. To guarantee the full development of flow in the outlet passage, an outlet extension section was added to the outlet of the straight outlet passage. The outlet boundary condition of the calculation domain was placed at the outlet section of the extension section, and the outlet section adopted the mass flow. Wall boundary conditions were used to constrain the fluid and solid regions, ensuring that the fluid cannot flow in the solid wall region. Each solid wall was set to a non-slip boundary condition, ignoring the influence of wall roughness. Data transmission between the two adjacent calculation domains was connected by GGI method. The dynamic and static interface between the rotating domain and the static domain was set to Stage type in steady numerical calculation, Transient Rotor Stator interface type was used in unsteady calculation. The other static and static interfaces were defined as None type. The discrete format is a first-order upwind format. The governing equations are discretized by the finite volume method based on finite element (CV-FEM), and the discrete equations are solved by the fully implicit coupled algebraic multigrid method. In the discretization process, the convection term adopts the high resolution scheme, and the other terms adopt the central difference scheme. The VLES model according to SST k-ω model was employed in numerical simulation. The mixed URANS/LES method is a commonly used model in the calculation of large-scale engineering separated rotational turbulent flow. The VLES model proposed by Speziale in 1998 was widely used, and the subsequent VLES improvement models were carried out on the basis of this model. To address the problem of too much damping Reynolds stress in the original VLES model, Han and Krajnović 35 proposed a new generalized functional form of the resolution control function Fr of the VLES model based on the turbulent energy spectrum, as illustrated in equation (2). Equation (3) provides the eddy viscosity calculation equation of the VLES model based on the SST k-ω model as the base model, 35 and the expression of each variables are shown in equations (4) and (5). 35 The turbulence model can well simulate the complex flow inside the VAFP device, and the convergence precision is 10−5.


In these equations, L
c
is the truncation length scale, C
x
is the model coefficient, and L
i
is the turbulence length scale, which is the model constant 0.09. L
k
is Kolmogorov scale,
In the near-wall region, the truncation length scale L c is larger than the turbulence length scale L i , and the resolution control function Fr = 1 is simulated and regressed to the RANS model. When the truncation length scale L c is smaller than the turbulence length scale L i , 0 < Fr < 1, the simulation is VLES.
Analysis of grid independence and convergence
As grid independence can significantly influence the validity of the numerical calculation, efforts were made to eliminate the influence of grid density on the calculation results by conducting grid independence verification. The numerical calculation results of the VAFP device under the optimal flow condition were selected for analysis, considering different grid numbers. The efficiency of the VAFP device under the optimal flow conditions was summarized in Figure 11. The efficiency of the VAFP device improved with an increasing number of grids, tending to stabilize. When the grid count increased from 3.85 million to 6.85 million, the efficiency amplitude became noticeably less than 1%. Therefore, the numerical calculation model with a grid number of 6.85 million was selected for further analysis.
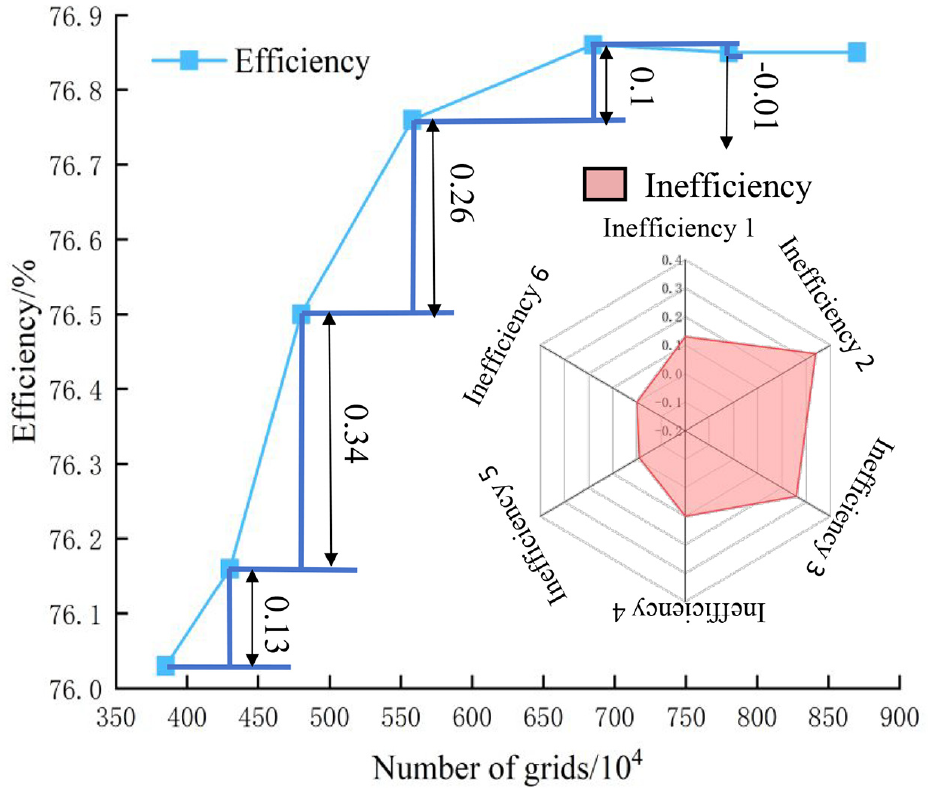
The impact of the number of grids on the efficiency of VAFP device.
Head and efficiency are two key parameters used to the hydraulic performance of the VAFP device. For the grid convergence analysis, the efficiency of these key parameters under optimal flow conditions in the numerical simulation calculations was selected as the evaluation parameter. The upshots were displayed in Table 3. GCI progressively dropped as the grid density increased, reaching less than 5%, indicating minimal discretization error. Through the analysis of grid convergence and independence, it was determined that 6.85 million grids represented the optimal grid number. Table 4 displays the number of grids for each flow component.
Grid convergence index.

The number of grids of each flow component.

Validation of numerical calculation method
Through meticulous calculations, the data on EPT of the VAFP device under different conditions were acquired at 2200 rpm as the safety barrier without flow resistance and with flow resistance (blockage ratio 0.3). To better contrast and scrutinize the test upshots against model numerical prediction, we employed the ratio of the flow Q at non-optimal operating points to the flow Qbep at the optimal operating point, denoted as Q/Qbep. As demonstrated in Figure 12, the test data and the flow-head curve fitted by the numerical calculation upshots were contrasted. The predicted performance curve from the numerical calculation of the VAFP device closely mirrored the changing trend of the test curve, demonstrating a high level of agreement. Under various flow conditions, the maximum relative error of head loss and the maximum absolute error of efficiency between model tests and numerical calculations were 4.78% and 1.33%, respectively, both falling within acceptable limits of 5%. This indicates an excellent accord between numerical calculations and model tests.
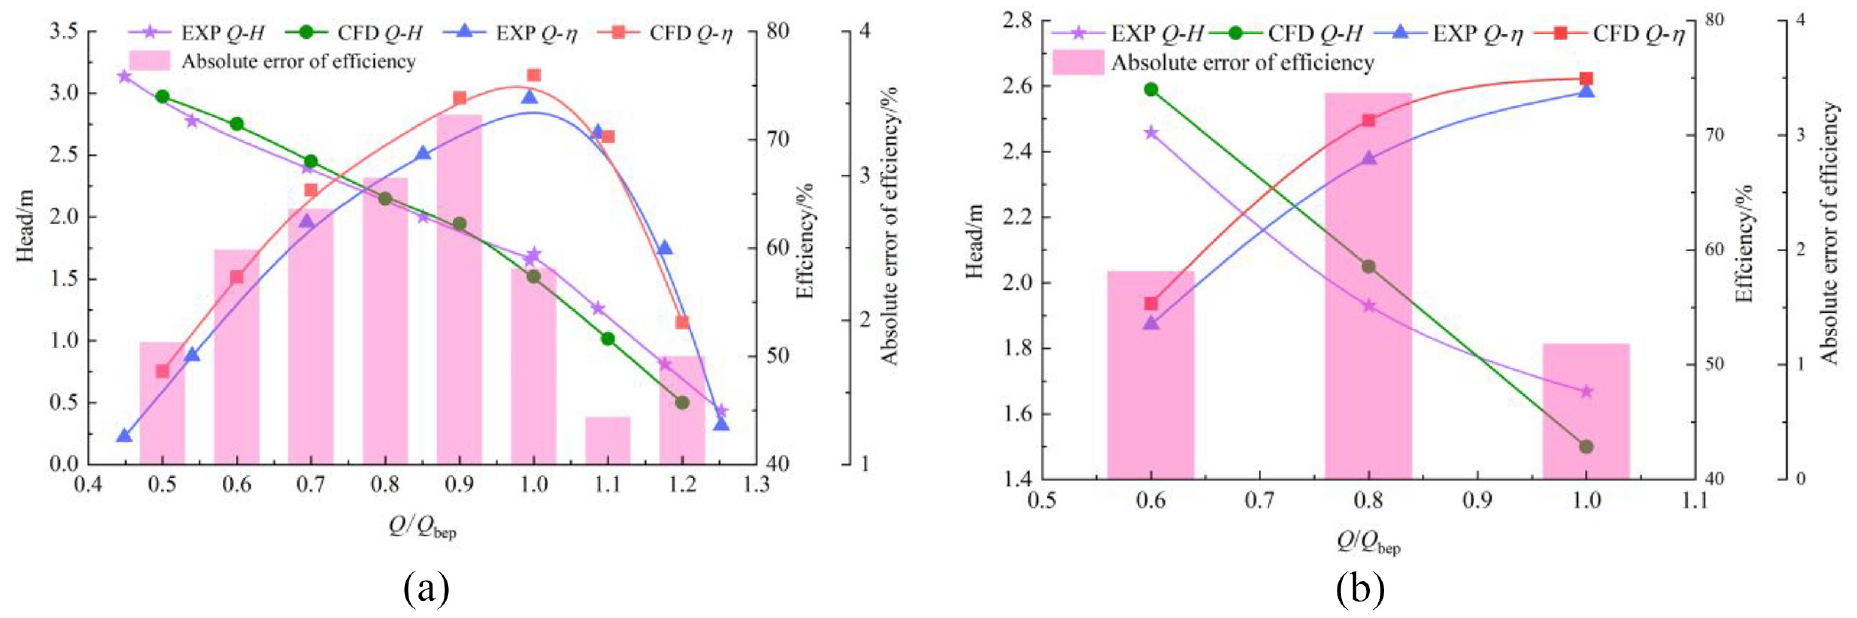
Comparison between numerical simulation and model test: (a) the safety barrier without flow resistance and (b) safety barrier with flow resistance (blockage ratio is 0.3).
Outcomes analysis
Influence of safety barrier structure on head loss
Analysis of the influence of the cross-sections of the bars on head loss
The local head loss of safety barriers with different cross-sections under optimal flow conditions was scrutinized. Two cross-sections were intercepted, labeled as cross-section 1 and cross-section 2. Cross-section 1 was positioned 2.5D away from the front of the safety barrier in the direction perpendicular to the mainstream, while cross-section 2 was located at the inlet section of the ESIP. To calculate the local head loss caused by the flow through the safety barrier, the head loss between these two cross-sections was calculated by equation (6).

Since the average elevations of the two cross-sections are the same, the equation can be simplified as follows:

In equations (6) and (7), Z1 and Z2 represent the average elevation of the two cross-sections, P1 and P2 denote the average pressure of the two cross-sections, v1 and v2 stand for the average velocity of the two cross-sections. Additionally α is the kinetic energy correction coefficient, and the turbulence value is set at 1. 22 The head loss between the two cross-sections is denoted as h w .
Table 5 shows the head loss of the safety barrier with different cross-section forms under the optimal flow condition. It can be seen from Table 5 that the head loss is the minimal when the cross-section of the safety barrier is circular, measuring 1.9 mm. Conversely, the head loss is maximal at 5.0 mm, which is 2.63 times that of the circular section. The square section, characterized by equal length and width, hinders full flow development as it passes through the bars, resulting in more disordered flow and consequently a larger head loss. In contrast, the flow near the bars of the circular and rectangular sections is more gentle, leading to a smaller head loss.
Calculation upshots of head loss of safety barrier with different cross-sections.

Analysis of the impact of bar spacing on head loss
The bar spacing has a certain impact on both the head loss and the manufacturing cost of the safety barrier. Consequently, the bar spacing underwent careful scrutiny in this study. Three safety barrier cross-sections with a spacing of 10 mm were selected for analysis. The upshots shown that the head loss was minimized when the cross-section of bars was circular. In this study, subsequently, the bar spacing was varied by 2 mm increments based on the model with a circular cross-section of bars. The eight different bar spacing, such as 6, 8, 10, 12, 14, 16, 18, and 20 mm, were selected for analysis through numerical simulation. The head loss was calculated using equations (6) and (7). It’s noteworthy that the selection of the cross-section aligns with cross-section 1 and cross-section 2, as defined earlier.
Figure 13 is the distribution of the influence of different spacing on the head loss. The least-square method was used to fit the relationship between the spacing Δl and the head loss Δh. The binary function relationship between Δh = f (Δ) satisfies the equation (8):


The influence of different bar spacing of safety barrier on head loss.
Figure 13 displays that the head loss is maximized when the bar spacing is 6 mm. As the bar spacing increases to 8 mm, the head loss experiences a sharp decrease compared to the 6 mm spacing. Within the range of D/15 to 7D/60 (8–14 mm), the head loss tends to be stable. When the bar spacing is within this range, the head loss first decreased and then tended to be stable at about 3D/20 (18 mm). When the bar spacing was between D/12 and D/6 (10 and 20 mm), the difference between the head loss was less than 2 mm. Considering that the bar spacing of the safety barrier was too large, which will lead to the decrease of the pollution blocking capacity, and the bar spacing was too small, which will cause more head loss. Combined with the analysis upshots of the safety barrier with different cross-sections above, the circular cross-section bars with a spacing of 16 mm (2D/15) were selected for further analysis. At this time, the number of bars was 16, and the over current area of the safety barrier accounted for 86.07%. It is consistent with the flow area of bars proposed in Gao et al. 25 For large and medium-sized pump stations (impeller diameter is not less than 1600 mm), a recommended safety barrier spacing is 20–25 cm.
Impact of blockage ratio on hydraulic performance of inlet passage
Analysis of head loss and velocity distribution uniformity of ESIP
To explore the impact of blockage ratio on head loss of the safety barrier, the relationship between different blockage ratios and head loss of the safety barrier under the optimal flow condition was scrutinized. The blockage ratio was defined as the ratio of the blockage area in front of the safety barrier to the area of the safety barrier. Eight different blockage ratios 0, 0.1, 0.2, 0.3, 0.4, 0.5, 0.6, and 0.7 were chosen for analysis.
Figure 14 demonstrates the connection between different blockage ratios and the head loss of the safety barrier. It is evident that the head loss of the safety barrier increased with the blockage ratio under the same flow conditions. For blockage ratios ranging from 0 to 0.3, the variation in the head loss of the safety barrier remained within 15 mm. When the blockage ratio exceeded 0.3, the variation range of the head loss of the safety barrier was the smallest within the range of 0.3–0.4, at 30 mm. The largest variation range of the head loss of the safety barrier occurred at blockage ratios of 0.6–0.7, measuring 366.05 mm. Under the same flow condition, the slope between adjacent two points also increased as the blockage ratio grew. At a blockage 0.6–0.7, the slope k4 of the fitting curve is about 2 times that of the slope k3 of the fitting curve when the blockage ratio was 0.5–0.6. When the blockage ratio was below 0.3, the change of the head loss of the safety barrier was relatively gentle. When the blockage ratio exceeded 0.3, the change of the head loss of the safety barrier was geometrically increased compared with the change of the head loss of the safety barrier corresponding to the blockage ratio below 0.3 for every 0.1 increase in the blockage ratio. So the critical blockage ratio of the safety barrier was 0.3. Consequently, to ensure the pump device operates steadily and safely, the safety barrier should be cleaned promptly when the blockage ratio exceeds 0.3.

The relationship between different blockage ratios and head loss of safety barrier.
To elucidate the variation of the flow field in the ESIP based on the safety barrier’s blockage ratio, the VDU (Velocity Distribution Uniformity) was employed to examine the internal flow field of the ESIP, as depicted in Figure 15. Three distinctive sections were identified within the ESIP, and the VDU for each section was calculated. These sections include the inlet section, the elbow section, and the outlet section of the ESIP.

The schematic diagram of different characteristic sections inside the ESIP.
The VDU of the three characteristic sections inside the ESIP under the optimal condition was scrutinized. Figure 16 presents the findings. The figure shows that the inlet section of the ESIP was most obviously affected by the flow resistance of the safety barrier. The VDU of the outlet section of the ESIP was the least affected by the flow resistance of the safety barrier, and its overall change was relatively stable. The VDU of the inlet section of the ESIP decreased as the blockage ratio grew. When there was blockage ratio 0.1, the VDU of the inlet section of the ESIP decreased sharply, and the decrease range was more than 25% compared with the blockage ratio 0. When the blockage ratio exceeded 0.3, the blockage ratio increased by 0.1, and the VDU of the inlet section of the ESIP decreases by no more than 10%, which changed little when the blockage ratio was 0–0.5. When the blockage ratio exceeded 0.5, the VDU of the inlet section of elbow section decreased obviously. At a blockage ratio 0.7, the VDU of the inlet section of elbow section decreased by 35% compared with that when the blockage ratio was 0–0.5.
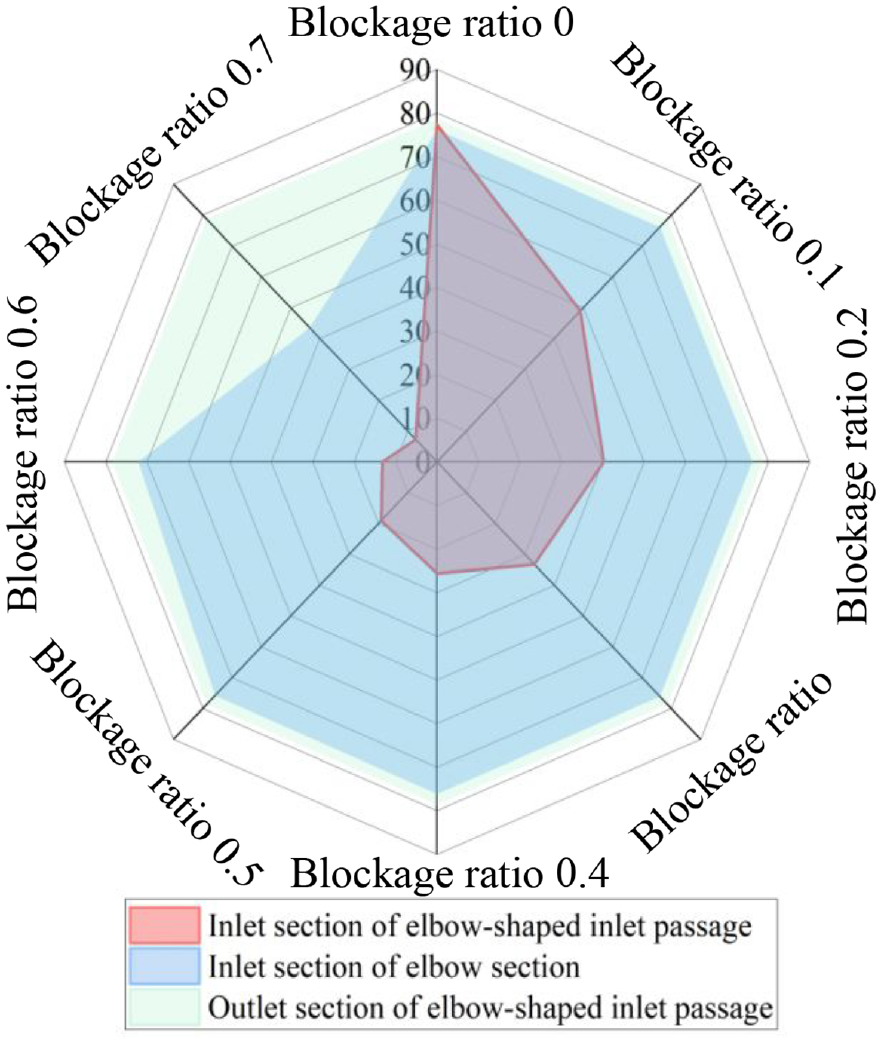
The connection between the blockage ratio of different characteristic sections and the VDU of the ESIP.
Flow field analysis of ESIP
To scrutinize the impact of different blockage ratios on the internal flow pattern of the ESIP, the velocity and streamline distribution of the CLS (central longitudinal section) of the ESIP were drawn, as shown in Figure 17. In conditions where the safety barrier imposed no flow resistance, the velocity and streamline distribution of the CLS of the ESIP were more uniform, with no evident vortex at the inlet section. However, when flow was obstructed, a noticeable vortex formed near the inlet of the CLS of the ESIP. As the blockage ratio increased, the vortex area expanded. At the blockage ratio 0.1–0.2, the vortex was mainly concentrated at the top of the inlet of the ESIP. When the blockage ratio was 0.3–0.4, the vortex area at the inlet gradually occupied half of the area of the straight shrinking section of the ESIP. When the blockage ratio was 0.5, the vortex gradually developed to the inlet of the elbow section. When the blockage ratio was 0.6, except for the straight shrinking section of the ESIP and the top of the elbow section, there were obvious vortices at the top of the elbow section. Affected by the blockage of the safety barrier, the velocity of the flow through the safety barrier increased obviously, which squeezed the flow below the elbow section and formed obvious vortices below the elbow section. When the blockage ratio was 0.7, two vortices with opposite directions and large volume emerged above the inlet section of the ESIP. Additionally, noticeable high-speed flow was observed below the ESIP, leading to chaotic flow distribution in the elbow section.

The velocity streamline distribution of the CLS of the ESIP under different blockage ratios: (a) blockage ratio 0, (b) blockage ratio 0.1, (c) blockage ratio 0.2, (d) blockage ratio 0.3, (e) blockage ratio 0.4, (f) blockage ratio 0.5, (g) blockage ratio 0.6, and (h) blockage ratio 0.7.
To quantitatively scrutinize the flow pattern distribution characteristics of the CLS of the ESIP under different blockage ratios, the parameter vortex area ratio A w is introduced. The equation is as follows:
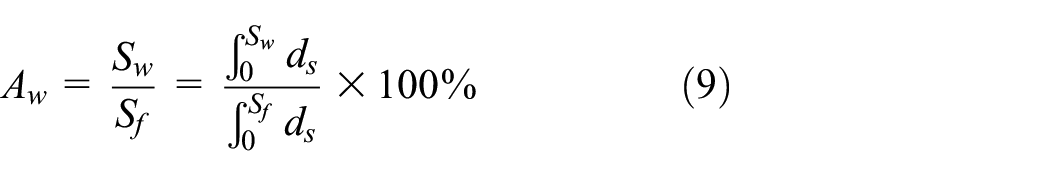
In equation (9), A w is the vortex area ratio, S w is the vortex area of the CLS of the ESIP, S f is the area of the CLS of the ESIP, and 0.087 m2 was taken in this model.
The vortex area of the CLS of the ESIP under different blockage ratios is displayed in Figure 18. The formula in the figure is the fitting function of the blockage ratio of the safety barrier and the vortex area ratio at the CLS of the ESIP. The figure displays that the vortex area ratio of the CLS of the ESIP increases as the blockage ratio grew. The vortex area ratio of the longitudinal section of the ESIP increases by less than 7% for every 0.1 rise in the blockage ratio within the range of 0.1–0.3. When the blockage ratio exceeds 0.3, the vortex area ratio increases by more than 8% for every 0.1 rise in the blockage ratio. Up to a blockage ratio of 0.3, the vortex area ratio of the CLS of the ESIP remains within 20%. Beyond a blockage ratio of 0.4, the vortex area ratio surpasses 20%. At the blockage ratio of 0.7, the vortex area ratio reaches 77.55%.

The vortex area ratio of the CLS of the ESIP under different blockage ratios.
To further scrutinize the distribution characteristics of vortex structure inside the ESIP under different blockage ratios, the Omega criterion was employed to identify these structures. The threshold Ω was 0.52, as displayed in Figure 19. The figure clearly shows that due to the increase of the blockage ratio of the safety barrier, the proportion of the flow area of the safety barrier decreases, which leads to the increase of the bottom flow velocity of the ESIP and the decrease of the top flow velocity, which leads to the more obvious vortex structure in the ESIP. At the blockage ratio 0, the vortex structure inside the ESIP was mainly concentrated at the rear of the safety barrier and the elbow section. Among them, the flow through the safety barrier was affected by the bars, leading to a continuous dissipation as it passed through the bars, resulting in a slender strip vortex structure behind the safety barrier. For blockage ratios of 0.1 and 0.2, the vortex structure primarily manifested above the inlet of the ESIP. As the blockage ratio increased to 0.3, the position of the vortex structure gradually shifted downward compared to the first two blockage ratios, and a distinct vortex structure began to appear above the elbow section. In the case of blockage ratios ranging from 0.4 to 0.5, the primary body of the vortex structure was mostly located in the center of the straight tapered section of the ESIP. Moreover, the distribution of the vortex structure above the elbow section significantly increased compared with the blockage ratio of 0.3. At the blockage ratio reached 0.6–0.7; the vortex structure nearly filled the entire ESIP.

Distribution of vortex structure in ESIP under different blockage ratios: (a) blockage ratio 0, (b) blockage ratio 0.1, (c) blockage ratio 0.2, (d) blockage ratio 0.3, (e) blockage ratio 0.4, (f) blockage ratio 0.5, (g) blockage ratio 0.6, and (h) blockage ratio 0.7.
To further quantitatively scrutinized distribution characteristics of vortex structure inside the ESIP under different blockage ratios, the parameter vortex structure volume ratio V w was introduced. The specific calculation equation is as follows:
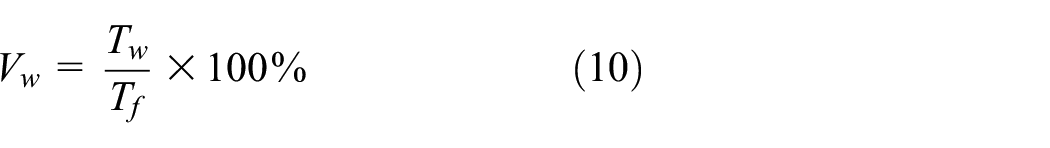
In equation (10), V w is the volume ratio of the vortex structure, T w is the volume of vortex structure inside the ESIP, and T f is overall volume of the ESIP. In this model, 17,764 cm3 is taken.
The volume of vortex structure inside the ESIP under different blockage ratios is displayed in Figure 20. The formula in the figure is the fitting function of the blockage ratio of the safety barrier and the vortex volume ratio inside the ESIP. The volume ratio of the vortex structure inside the ESIP was the smallest when the safety barrier was unblocked, at 16.04%. As the safety barrier becomes blocked, the volume ratio of the vortex structure inside the ESIP increased with the growing blockage ratio. At the blockage ratio 0.2, the volume ratio of the vortex structure inside the ESIP increased by 2.92% compared to a blockage ratio 0.1. In the blockage ratio 0.3–0.5, for every 0.1 rise in the blockage ratio, the volume ratio of the vortex structure inside the ESIP was stable within 1.07%. When the blockage ratio exceeded 0.5, the volume ratio of the vortex structure inside the ESIP increased by more than 3.5%. At the blockage ratio 0.7, the volume ratio of the vortex structure inside the ESIP had the largest increase of 7.94% compared with the blockage ratio of 0.6. At this point, the volume ratio of the vortex structure inside the ESIP was 33.86%, which was 17.82% higher than that of the safety barrier without flow resistance.

Volume ratio of vortex structure in ESIP under different blockage ratios.
Through the streamline velocity distribution and internal vortex structure distribution inside the ESIP, it is evident that at the blockage ratios between 0.3 and 0.4, the vortex area of the CLS within the ESIP gradually occupied half of the area of the straight shrinking section of the ESIP. Upon surpassing a blockage ratio of 0.3, with each 0.1 increase in blockage ratio, the growth rate of the vortex area ratio exceeded 8%. At a blockage ratio of 0.3, the vortex structure within the ESIP gradually extended to the elbow section. Within the blockage ratio was 0.3–0.5, the volume ratio of the vortex structure inside the ESIP increased by 0.1 for each increase of the blockage ratio, and the growth rate did not surpass 1.07%.
Conclusion
In this paper, the impact of the geometric structure size of the safety barrier bar on head loss was compared and scrutinized through numerical simulation combined with physical model test. The optimal cross-section of the safety barrier and the spacing of the barrier were determined. The impact of different blockage ratios on the hydraulic performance of the inlet passage was examined by numerical simulation. The specific conclusions are as follows:
(1) The head loss was the smallest when the cross-section of the safety barrier was circular, measuring 1.9 mm. For the square cross-section, the head loss was maximum at 5.0 mm, 2.63 times that of the circular section. The head loss was maximum when the bar spacing was D/20 (6 mm). For bar spacing between 7D/60 and D/6 (14 and 20 mm), the head loss decreased and then stabilized at about 3D/20 (18 mm). At a bar spacing of 2D/15 (16 mm), the flow area of the safety barrier was 86.07%, consistent with that proposed in the actual project. For large and medium-sized pump stations (impeller diameter not less than 1600 mm), the recommended bar spacing of the safety barrier is 20–25 mm.
(2) Under optimal conditions, as the blockage ratio increased, the head loss of the safety barrier also increased. In the blockage ratio range of 0–0.3, the change in the head loss of the safety barrier was relatively gentle and stable within 15 mm. When the blockage ratio exceeded 0.3, for each 0.1 rise in the blockage ratio, the variation range of the head loss of the safety barrier geometrically increased compared to the variation range corresponding to the blockage ratios below 0.3. Therefore, the critical blockage ratio is 0.3. At the blockage ratio range of 0.3–0.4, the variation range of the head loss of the safety barrier is the smallest; while the variation range is the largest at the blockage ratio of 0.6–0.7.
(3) Under optimal conditions, the inlet section of the ESIP was most obviously affected by the flow resistance of the safety barrier, and the VDU of the outlet section was least affected, with overall changes being relatively stable. The VDU of the inlet section of the ESIP decreased as the blockage ratio grew. It dropped sharply at a blockage ratio of 0.1. When the blockage ratio exceeded 0.3, for each 0.1 rise in the blockage ratio, the VDU of the inlet section of the ESIP decreased steadily within 10%. The VDU of the inlet section of elbow section changed little at the blockage ratio of 0–0.5. The VDU of the inlet section of elbow section decreased by 35% compared with that at the blockage ratio of 0–0.5 at the blockage ratio of 0.7.
(4) When the blockage ratio was 0.1–0.3, for each 0.1 rise in the blockage ratio, the expansion pace of the vortex area ratio of the CLS of the ESIP was stable within 7%. When the blockage ratio exceeded 0.3, for every 0.1 rise in the blockage ratio, the expansion pace of the vortex area ratio was above 8%. At the blockage ratio 0.3–0.5, the volume ratio of the vortex structure inside the ESIP increased within 1.07% for every 0.1 increase in the blockage ratio. When blockage ratio exceeded 0.5, the volume ratio of the vortex structure inside the ESIP increased by more than 3.5%.
Footnotes
Handling Editor: Sharmili Pandian
Declaration of conflicting interests
The author(s) declared no potential conflicts of interest with respect to the research, authorship, and/or publication of this article.
Funding
The author(s) disclosed receipt of the following financial support for the research, authorship, and/or publication of this article: This research was supported by the National Natural Science Foundation of China (Grant No. 51609210), Major Basic Research Project of the Natural Science Foundation of the Jiangsu Higher Education Institutions (Grant No. 20KJA570001), the Technology Project of the Water Resources Department of Jiangsu Province (Grant No. 2022074), the Science and Technology Plan Project of Yangzhou City (Grant No. YZ2022192), Qing-Lan Project of Yangzhou University (2023040), and Jiangsu Province Graduate Research and Practice Innovation Project (Grant No. SJCX24_2245).