
Abstract
According to the World Health Organization (WHO), air pollution is the single greatest worldwide health risk especially in urban environments. In these areas, the vehicle traffic significantly contributes to the fine dust concentration in the ambient air. While the current legislation focuses mainly on the exhaust emission of vehicles, 85% of the overall fine dust emissions originating from brakes, tires, and road abrasion are not yet regulated. In this context, an integrated particulate filter system fitted into previously unused installation spaces in frontend of a vehicle in front of the radiator allows to compensate a part of the particle emissions of a vehicle try to reach the neutral emission. Add filter is not without consequences for the cooling performances. This study aims to assess the impact of the particulate filter system on the radiator cooling performances and cooling drag coefficient. An experimental setup was developed to characterize an automotive radiator with and without particle filter in terms of power and velocity distribution. Cooling capacity of the radiator depends clearly of the airflow through the radiator. Filter increases the pressure drop and decreases airflow. Hence, the heat power exchange can be reduced up to 10% for a pressure drop level almost twice. The airflow inlet inside engine compartment is not beneficial for aerodynamic aspect. By increasing pressure drop, the cooling drag coefficient can be reduced up to 10% when a filter covers entirely the radiator surface. The results indicate that the filter affects the cooling capacity of the radiator, which can require modifications to the cooling system strategy.
Keywords
Introduction
Since 1992, exhaust emissions (EE) such as CO, HC, NOx, and particles from vehicles have been regulated by EURO standards. 1 Currently, EURO 6d is the standard that regulates EE since 2020, limiting the total number of emitted particles to 6 × 10¹¹/km for diesel and gasoline engines. To reduce EE, car manufacturers have optimized their engines and developed solutions such as exhaust gas particle filters and exhaust gas recirculation systems.
The Air Quality Expert Group has projected overall emissions from road transport for European countries until 2030. 1 The trend is that EE is considerably decreasing while non-exhaust emissions (NEE) are increasing. Many parameters need to be taken into account for NEE particle formation, such as the material used for tires, brake disks and pads, road type (roughness), and driving behavior. 2 NEE is mainly constituted by 60% PM2.5 and 73% PM10 from road transport. NEE is important in urban environments because 50% of NEE occurs on urban roads. Technical solutions, such as the brake dust filter, can be considered to catch brake particles. 3 New brake technologies can reduce brake emissions, but cannot influence tire wear, road abrasion, and road dust resuspensions. These NEE sources may even possibly increase due to fleet electrification, as heavier vehicles lead to increased road and tire abrasion and higher braking forces, generating more fine dust particles. In conclusion, even if governments push for electric vehicles, problems linked to NEE remain important and need to be addressed.
In addition to NEE, reducing CO2 emissions is a target for transportation vehicles to decrease the impact of greenhouse gases on global warming. Transportation in Europe accounted for 25% of the total greenhouse gas effect in 2019. 4 The development of combustion engines, hybrid technology, and electric cars contribute to reducing fossil energy demand. Electric cars are a good alternative to completely replace the consumption of fossil energy by electric energy by using batteries (lithium-ion for example). Lot of recent papers deal of this kind of subject5,6 and especially concerning the battery cooling, that is a real challenge for safety use. The aerodynamic design of the vehicle is another lever as it allows to reduce the air resistance of the vehicle and thus the energy demand.
One possible approach to compensate particulate emissions from vehicles is an integrated fine dust particle filter system developed by MANN+HUMMEL GmbH. 7 This system is located at the front of the vehicle, using the air velocity created by the car to collect PM10 particle. Indeed, according a scenario leaded by MANN+HUMMEL for a BEV (Battery Electric Vehicle) driving a distance of 22 km, the PM10 reduction in European city (Stuttgart) reaches 38%. This reduction is possible thanks to two modes: passive mode that corresponds at the driving mode and active mode when vehicle is parked and plugged with the fan is ON.
However, due to its location between the bumper and the radiator, the filter could affect the radiator’s cooling performance. The cooling performance of a vehicle has often been crucial for its proper functioning. The design of radiators has evolved to make them increasingly efficient, as demonstrated by the orientation of louvers, the dimensions of fins and pitch, and the materials used to enhance thermal exchange,8–11 up to the use of nanofluids as leverage to improve cooling performance 12 . Indeed, as demonstrated by Devireddy et al., 13 the addition of TiO2 nano powder in coolant can increase thermal exchange by up to 35%. The radiator has gradually become surrounded by components related to engine performance and cabin comfort, such as the charge air cooler or the air conditioning condenser, leading to a direct reduction in the airflow through the radiator.14,15 The addition of a particulate filter in the front further exacerbates this effect, resulting in a greater pressure drop. Radiator fouling can also impair its performance. Since it is located at the front of the vehicle, it is exposed to various types of pollution (dust, saline air, small debris, etc.). This progressive degradation could therefore be mitigated by the use of a filter, which would increase the radiator’s lifespan. This article investigates experimentally the impact of such a filter on the performance of the automotive radiator and its impact on the cooling drag coefficient.
Engine experimental test bench and instrumentation
An experimental test bench, see Figure 1, was built to evaluate the impact of the integrated fine dust particle filter system on the performance of an automotive radiator.

Heat exchanger test bench.
The radiator used is an aluminum automotive finned radiator with a length of 660 mm, a height of 435 mm, and a thickness of 27.1 mm that equipped a segment C vehicle with the further characteristics described in Table 1.
Radiator characteristics.

The filter used for this campaign is a filter media developed by MANN+HUMMEL. It is an optimized PM10 media focuses on a large part of the fine dust emissions of a vehicle. 7 The dust holding capacity of this filter is given for 1 year or approximately 20,000 km for an European fine dust concentration (25 μg/m3 at Stuttgart in Germany). Filter has performed tests such as stone-shipping and test pressure at two bar: no damage and deformation has been observed. To prevent any deformation due to high velocity, a plastic grid reinforcement and glue beads in order to stabilize the pleat positions composed the filter unit. In this study, the filter is a clean filter.
A three-cylinder spark ignited turbocharged engine is used as a 75 kW heat power generator. The internal combustion engine (ICE) is connected to a dynamic engine test bench HORIBA Dynas3 HT250. The radiator is mounted inside the air vein as shown in the Figure 1. A PR-L804 22 kW Dynair ventilator allows a maximum airflow of 47.650 m3/h through the radiator. All ducts used to connect the engine to the radiator are insulated with nitrile rubber pipe.
The system is instrumented with different sensors (for detailed see Table 2). Twenty four Pitot tubes equipped with temperature sensors type K and connected to relative pressure sensors (GEMS sensors) are mounted downstream of the radiator and 24 temperature sensors type K and T are mounted upstream of the radiator. A differential pressure sensor SENSIRION SDP2000-L measures the pressure drop of the system. Two temperature sensors type T are installed in each tank of the radiator. A coolant flowmeter BAMO VORTEX measures the coolant flow through the radiator. All sensors are connected to a National Instruments CompactDAQ system acquisition composed of three NI module: NI9213 (75 Hz module is used to measure temperature), NI9220 (analog input 100 kHz/ch), and NI9205 (analog input 250 kHz). The acquisition frequency of temperature is 50 Hz and all other signals recorded at 1 kHz for 30 s. In addition, an anemometer is placed at the outlet of the vein to measure the air velocity at the middle of the vein.
Sensor characteristics.

Test method
As mentioned in the previous section, the ICE is used as a heater. The engine rotational speed is set to 5000 rpm in order to use the maximum available power. The coolant pump of the engine, mechanically linked to the engine by a belt, creates coolant flow: it means that the rotational speed of the pump is fixed by the engine rotational speed. An external homemade electric valve composed on ball valve and servomotor manages coolant flow with PWM controlled. In this way, it is possible to obtain coolant flow up to 70 l/min through the radiator. To create and control the airflow through the radiator, the ventilator speed is adjusted by monitoring the pressure drop of the system. As described in Table 3, three configurations have been tested. Configuration 1 is without filter element which is considered as reference. In configuration 2 (RF100), a filter element is placed in front of the radiator and covers it entirely. While in configuration 3 (RF75), the filter element size is reduced thus it covers 75% of the radiator’s surface.
Experimental configuration tested.

The experimental setup allows to reach 70 l/min coolant flow in the radiator with a maximum inlet coolant temperature at 90°C. Two coolant flows have been chosen through the radiator in order to evaluate the effect of it (40 and 70 l/min). In order to analyze the results for each configuration, airflow sweep has been done to reach the predefined heat power. The objective is to directly compare the heat power exchange for each configuration for a given coolant flow and airflow. For that reason, the difference between air inlet and coolant inlet temperature (


Setup validation/calibration
Under hypothesis of incompressible fluid (maximum Mach number reaches in this investigation 0.06), and by neglecting the gravity term, Bernoulli equation gives the relation between the dynamic pressure and air velocity

The air velocity is directly linked to the dynamic pressure and can be calculated by the equation (5).

Due to the experimental setup, the air velocity obtained in front of the radiator is not uniformly distributed. Indeed, the fan is slightly shifted from the tunnel center that created an inhomogeneity of the air velocity. The Figure 2 shows an example of the air velocity repartition on the radiator surface without filter and without heat exchange. Each crossing of the vertical and horizontal axis represents a measurement point. For example, at the point [X = 2 Y = 2], air velocity equal to 21.3 m/s and at the point [X = 5 Y = 3] air velocity equal to 18.1 m/s, that is, a difference of around 3 m/s.

Air velocity profile in front of the radiator.
In order to obtain an average air velocity through the radiator, an arithmetic average is applied by using each discretized air velocity (equation (6)).

To ensure that the air velocity measurement obtained (by Pitot tubes) in front of the radiator is representative of air velocity on the complete range of ventilation, the measurement results are compared with data recorded with an anemometer located at the end of the air outlet (as described in Figure 1). The graph in Figure 3 shows that the air velocities results calculated by using dynamic pressure thanks to Pitot tubes is consistent with the anemometer values.

Air speed measurement by using Pitot tube and anemometer.
According to the law of mass conservation, the mass airflow rate at the inlet and the outlet of the air vein must be equal. The air mass flow rate is calculated with the equation (7).

Heat power exchange calculation
To evaluate the impact of the filter element on the radiator performances, the heat power exchange is analyzed for each configuration. The calculation of heat power exchange is presented in the equation (8).

In this equation, the temperature difference

The temperature difference at the inlet and outlet of the radiator is obtained by temperature sensors placed in the radiator tanks. The coolant specific heat

The coolant used for tests is composed at 52% of ethylene glycol so close to 50%. The specific heat capacity of coolant is then determined by a fluid properties calculation utility from Gamma Technologies software (GT-Suite) for instance 3450 J/(kg.K) at 65°C.
Experimental results
The first test permits to measure the pressure drop for the three configurations presented in Table 3 at different mass airflow rate. Figure 4 shows the pressure drop evolution with mass flow rate. It appears that a filter element in front of the radiator increases the pressure drop of the system. RF100 configuration creates more pressure drop than the reference configuration. For example, at 1 kg/s, the pressure drop for reference is 78 and 110 Pa for RF100. This value is reduced when the size of the filter element coverage is decreased (RF75 configuration). However, the filter element influences the pressure drop, it is necessary to define its consequences on the heat power exchange.

Pressure drop measurement for three configurations.
As mentioned in the test method, the heat power exchange comparison is possible because
(a) Uncertainties on dynamic pressure
24 relative pressure sensors are used to evaluate the dynamic pressure in front of the radiator in order to obtain the air velocity (equation (6)). The Table 2 indicates that three kind of dynamic gas pressure sensors are used. The accuracy of these sensors is 1% of the full scale, that means:
11 dynamic pressure sensors ±500 Pa:
9 dynamic pressure sensors ±250 Pa:
4 dynamic pressure sensors ±1000 Pa:
Dynamic pressure

The propagation of uncertainties method is defined by the equation (12).

Finally, the deviation on the dynamic pressure is
(b) Uncertainties on the temperature difference
To determine the uncertainties on the temperature difference, tests have been done where all temperature sensors signals have been recorded without heat exchange. Temperature arithmetic average was calculated by using the 24 temperature sensors in front of the radiator and 24 other behind radiator and the standard deviation obtained is
To find uncertainties on the heat power exchange, the log derivative method is used and is defined by equation (13).

Figure 5 shows the heat power exchange for each configuration with a

Heat power exchange with
The filter element placed in front of the radiator does not affect the thermal behavior of the radiator as soon as the mass airflow is maintained. The heat power exchange follows the same trend for all the tested coolant flow.
Analysis
Effect of airflow distribution on radiator performances
Kubokura et al. 15 have shown that the velocity distribution on the radiator can decrease the heat power exchange up to 10%. To evaluate the effect of the airflow distribution for each configuration, the non-uniformity factor i (defined by Ng et al. 16 ) can be used (equation (14)). The principle consists of dividing the radiator in a finite number of equal-area cells and obtain the air velocity on each area.

Air velocity is obtained with 24 points in front of the radiator and 24 temperature sensors upstream and downstream of the radiator. Hence, the radiator will be divided in 24 equal-areas. Table 4 shows the results obtained by the tests for the non-uniformity factor.
Non-uniformity factor for tested configurations.
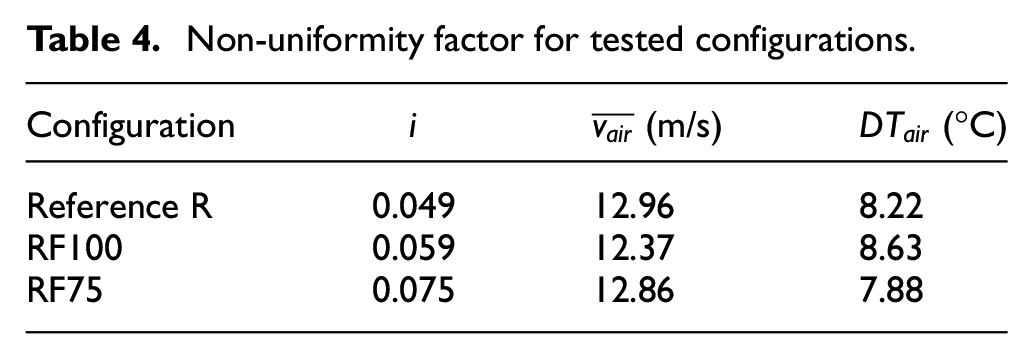
The Table 4 indicates that the non-uniformity factor is higher of around 20% when a filter covers entirely the radiator area (RF100 configuration) and 53% when the filter covers partially the radiator (RF75). These values are confirmed by seeing the air velocity distribution for the three configurations in Figure 6 where hatched gray area corresponds to the filter surface in the radiator.

Air velocity distribution measured (

Air temperature difference (
It appears that the air velocity is more uniform with configurations 1 and 2 than configuration 3. The arithmetic average air velocity at the bottom of the radiator (black rectangle in Figure 6) is equal to 14.6 m/s for configuration 3 instead of 13.6 m/s for the two other configurations. The air temperature difference is slightly reduced with this air velocity misdistribution for RF75 configuration (as presented in Table 4 and Figure 6).
When the radiator is not covered entirely by a filter element (configuration RF75), the non-uniformity factor is higher. Ng et al. 16 indicates that when non-uniformity factor is equal to 0.075, the heat power exchange is reduced by 1.5% (in the following conditions: coolant flow equal to 60 l/min and average core velocity 5 m/s). The experimental results in Figure 5 shows that for an airflow equal to 4.3 kg/s and coolant flow equal to 70 l/min, the heat power exchange is 49 kW. A reduction of 1.5% of the heat power reduces it of 0.735 kW. To conclude, the effect on the radiator performances is not significant for such air velocity misdistribution.
Vehicle speed evaluation
Velocities relation
Figure 8 shows a simple cooling system with its different elements (grid, condenser, radiator, fan, fan shroud, engine bay, and underbody) to understand the air path on a vehicle cooling system. By adding a filter element in front of the radiator, the pressure drop of the cooling system increases. The effect of increased pressure drop induces the reduction of the air velocity through the radiator for a given vehicle speed.

Simplified vehicle engine compartment without filter.
Ap
17
defined a coefficient between air velocity in front of the radiator
Pressure loss coefficient
The pressure drop causes by the radiator are usually expressed by the simple following relationship (equation (15)).

In this equation,

In this equation,

With x represents Reference, RF100 or RF75.
The total pressure loss can be expressed by equation (18).

By using experimental results, it is possible to express the total pressure loss as a function of the air velocity measured in front of the radiator as described in Figure 9. Each curve can be modeled by a second order polynomial of the form of equation (19).


Total pressure drop for each configuration.
The air velocity in the X-axis is obtained from the mass airflow by using

At this point, pressure loss coefficient can be calculated for each configuration by using equation (17). Figure 10 shows the evolution of these coefficients as a function of the measured air velocity. The pressure loss coefficients follow a linear trend for an air velocity range from 5 to 22 m/s. They can be considered constant due to their low variation on the air velocity range as mentioned by Barnard.
22
The average value of these coefficients is set at

Pressure loss coefficient for each configuration.
Effect of the filter based on the experimental setup
Williams et al. 23 have defined the major contributors to vehicle cooling airflow in four subsystems: front end subsystem, cooling subsystem, underhood, and underbody. The filter element is part of the cooling subsystem and hence leads to an increase of the pressure loss coefficient. Barnard 22 used the Bernoulli equation by considering energy loss to determine the ratio between air velocity through radiator and vehicle speed. Thus, it is possible to calculate the air speed ratio to evaluate the effect of the filter on the radiator performances under following hypothesis:
No leakage around the elements of the engine compartment
Air density is considered constant (
Air flow is considered in steady state condition

The conservation of the mass associated to the equality of the areas SS and SR give the equation (22)

Finally, it is possible to define the velocity ratio with equations (23) and (24).

With

Concerning the air outlet pressure coefficient
Speed ratio for each configuration based on the experimental setup.
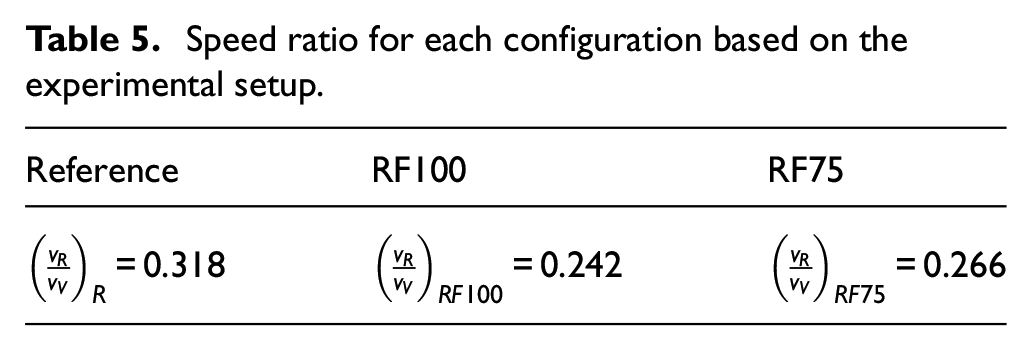
The speed ratio is directly affected by the pressure loss coefficient as showed results in Table 5. The speed ratio is reduced by around 24% and 16% respectively for configurations 2 and 3, that is, that for a same vehicle speed, the air velocity through the radiator is reduced and hence the airflow too. Due to the airflow reduction, the heat power exchange is mitigated when pressure loss coefficient is higher as shown in Figure 11. The effect on both configurations with filter (RF100 and RF75) is not significant for lower vehicle speed (<100 km/h). Moreover, for higher vehicle speed (>100 km/h), averages higher airflow through radiator, heat power exchange is reduced due to the pressure loss increase with RF100 configuration.

Heat power exchange for each configuration based on the experimental setup.
For a vehicle speed equal to 100 km/h, the heat power exchange is reduced by 7.2% for RF100 and by 6% for RF75 compared to the reference configuration based on experimental setup.
Estimation of the filter effect on real vehicle
Some authors have evaluated the impact of the pressure loss coefficients due to the air inlet, air outlet, fan size, fan shroud.15,18–20,24 The pressure loss coefficients
The idea is to use speed ratio of the reference configuration that corresponds to 0.16 (see “Velocities relation

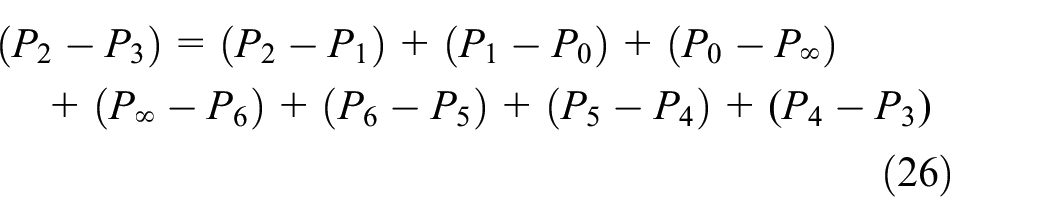


Each pressure difference is linked to an element of under hood (fan, fan shroud, condenser…) and can be modeled by pressure loss coefficient as done for the radiator (equation (24)). The pressure loss coefficient

With
This value will be taken to estimate the speed ratio for the configurations 2 and 3 (RF100 and RF75) that is defined by the equation (30).

The Table 6 indicates the speed ratio values for each configuration calculated from equation (30).
Speed ratio for each configuration based on a real vehicle.
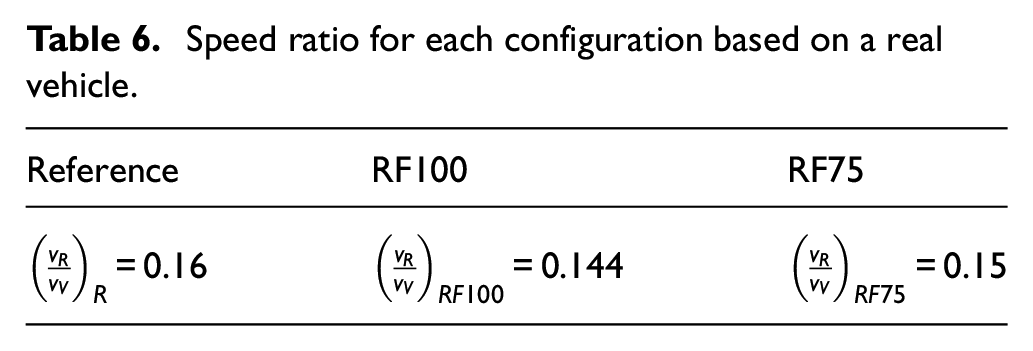
The speed ratio is less affected by considering a real engine compartment by comparing the Table 6 and Table 5 (10% instead of 24% for configuration RF100, 6.25% instead of 16% for RF75).
Regarding the heat power exchange, for RF75 configuration in conditions of coolant flow equal to 70 l/min, a reduction of 4.9% for lower vehicle speed at 100 km/h by comparison of the Reference configuration is indicated in Figure 12. When speed vehicle increases, the radiator performances are more affected until 5.7% at 200 km/h.

Heat power exchange for reference, RF75 & RF100 configurations for a real vehicle at 40 and 70 l/min of coolant flow.
Moreover, a coolant flow increase (from 40 to 70 l/min) allows improving heat power exchange for a same vehicle speed. At 120 km/h, by increasing the coolant flow at 70 l/min, heat power exchange can be improved of 15%. The cooling efficiency reduction due to the filter can be compensate by increasing the coolant flow.
Effect on the cooling drag coefficient
The cooling drag coefficient is defined as the difference between the vehicle drag with open front grid and vehicle drag with closed front grid, as depicted in equation (31).

By increasing the pressure loss of the cooling system, cooling drag coefficient will be reduced. 14 Thus, the airflow through the cooling system is reduced and can cause troubles for the engine cooling. This cooling drag coefficient is in a range of 5%–10% of the total drag coefficient.25–27 Moreover, the cooling drag coefficient can be divided in two components defined as described by equation (32).

Internal drag coefficient

With the hypothesis that all vehicle parameters are the same (inlet outlet section, exit pressure loss coefficient) and with a projected frontal surface
Speed ratio, pressure loss coefficient, and cooling drag coefficient estimated for a real vehicle.

As mentioned by Wittmeier et al., 24 the effect of the interference drag coefficient can cause the reduction of the total drag coefficient. Wolf 25 has already done this observation on the Porsche 911 Carrera because this coefficient can be negative, which averages an additional benefit for the drag coefficient. He also explained that by increasing the pressure loss coefficient K, the volume flow rate is more reduced than the cooling drag coefficient. According to him and other authors, the cooling drag coefficient is an important parameter to reduce the drag coefficient of the vehicle.
The filter increases the pressure loss coefficient of the air path and contributes to the reduction of the internal drag coefficient up to 10%. However, airflow through radiator is consequently reduced and thermal power is decreased. On a vehicle, not all-thermal power is used all the time and high speed is not often a problem because lot of air is available and not necessary. 15 That’s why, it will be judicious to use filter in front of the radiator as grille shutter which can be removed when lot of thermal power is required. In this fact, it will be possible to benefit of the reduction of the drag coefficient and consequently reduce the energy demand.
Conclusion
The objective of the filter is to compensate the Non-Exhaust Emissions without endangering the cooling system. Especially the impact of the filter on the heat power exchange has been investigated.
The filter do not significantly affect the thermal behavior of the radiator, but it reduces the air mass flow rate through the radiator due to the increase of pressure loss coefficient of the cooling system. The results indicate that the filter affects the heat power exchange for a given vehicle speed (Figure 12): power reduction of around 5% at 100 km/h for example. However, the increase of pressure loss coefficient is beneficial for the cooling drag coefficient, allowing for a decrease of up to 10% (0.0013) in the cooling drag coefficient. The total power of cooling system is not used all the time, it is wise to reduce cooling drag coefficient when cooling power is not necessary. This benefit could help reduce fuel consumption or energy demand.
To keep an equivalent power exchange with or without filter, airflow improvement can be done by modifying the fan shroud design 15 in order to increase it at low speed (+8%) and decrease it at high speed (−7%). In the same study, 15 Kubokura et al. show that a cooling fan strategy allows to reduce the cooling drag coefficient of 0.003 by reversing the fan use at speed vehicle 80 km/h.
Wolf 25 indicates that an increase of the radiator core area is a solution directly proportional at the cooling capacity and more efficient with low internal flow velocities.
A study would be possible with a loaded filter. Consequently, the cooling capacity of the radiator will be mitigated. Beyond the dust loaded filter, on real conditions, the clogging will not be uniform and would create a misdistribution of the airflow which can affect the cooling capacity in addition to the airflow reduction induced by the pressure drop.
Footnotes
Appendix
Handling Editor: Aarthy Esakkiappan
Declaration of conflicting interests
The author(s) declared no potential conflicts of interest with respect to the research, authorship, and/or publication of this article.
Funding
The author(s) disclosed receipt of the following financial support for the research, authorship, and/or publication of this article: The work in this article is done in a joint International Research Chair entitled “Filtration systems: fluid dynamics and energy consumption reduction” between MANN+HUMMEL and Ecole Centrale de Nantes. This research work is financially supported by the French Government and managed by the National Research Agency (ANR) with the Future Investments Program.